 Multi-family
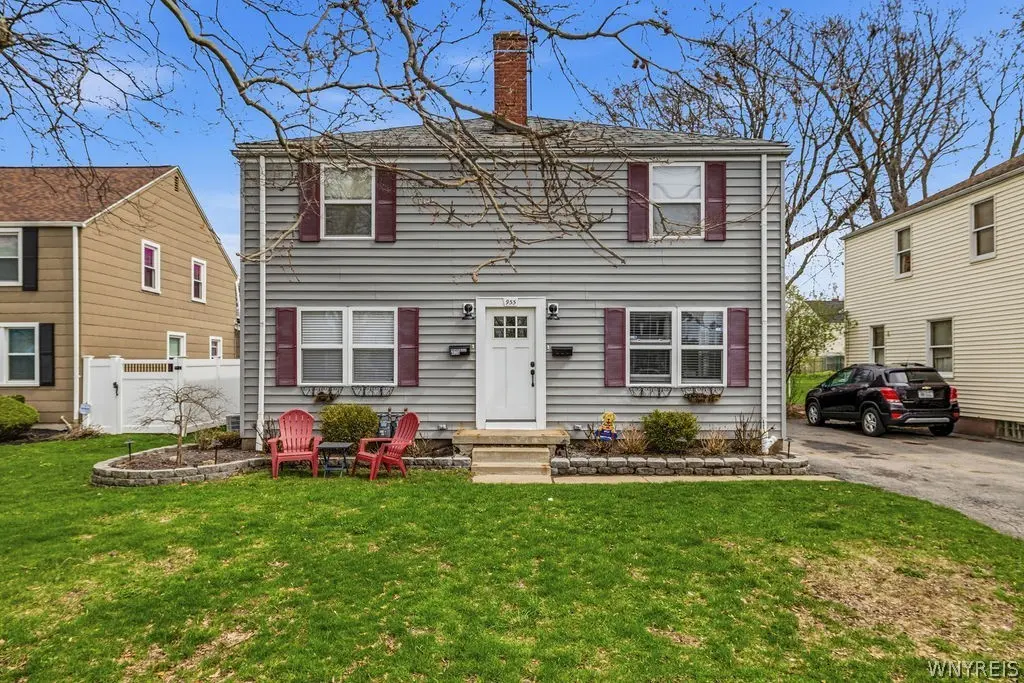
955 Beach Rd · Cheektowaga, NY
Flood risk 1/10 · Minimal
- FEMA flood zone
- X (unshaded)
- Chance of flooding over 30 yrs
- 0.0%
- Est. flood insurance / yr
- $473 – $860
Fire risk 1/10 · Minimal
- Est. fire insurance / yr
- $691 – $1,283
Heat risk 2/10 · Minimal
- Hot days now (above 92°F)
- 7 days/yr
- Hot days in 30 yrs
- 15 days/yr
Wind risk 1/10 · Minimal
- Chance of severe wind over 30 yrs
- —
Air-quality risk 3/10 · Minor
- Unhealthy air days now
- 2 days/yr
- Unhealthy air days in 30 yrs
- 3 days/yr
Risk factors via First Street. Map © Google.
Why this score? — see what drove the C+ grade
The composite is a weighted blend of 9 inputs, each scored 0–100. Each bar is that input's sub-score; the figure is the points it added to the 100-point composite (weight × sub-score).
- Cash flow +19.8/30.0
- ARV discount +15.0/15.0
- DSCR +6.3/10.0
- 1% rule +6.2/10.0
- Schools +5.9/10.0
- Livability +4.2/5.0
- Rent growth +2.5/5.0
- Condition / age +2.5/5.0
- Appreciation +0.0/10.0
$249,900
🖨 Deal sheet 📄 Offer letter ✓ Due diligence
Multi-family units
County records classify this as Multi-Family (2-4 Unit). Listing-text estimate: 1 unit. estimate disagrees with records
Listing remarks MLS
Discover an exceptional investment opportunity in the highly sought-after area of Cheektowaga! This well-maintained multi-family home offers strong income potential and consistent rental demand, making it ideal for both seasoned investors and owner-occupants. Featuring multiple spacious units, each apartment boasts bright living areas, generously sized bedrooms, and functional layouts designed for comfortable living. Tenants will appreciate the ample natural light, updated kitchens and baths, and plenty of storage throughout. The property includes separate utilities, off-street parking, and a sizable yard—adding convenience and appeal for residents. Located just minutes from shopping, dining, major highways, and everyday amenities, this home ensures long-term desirability and ease of renting. Whether you’re looking to expand your portfolio or live in one unit while generating income from the others, this high-demand Cheektowaga multi-family is a rare find you won’t want to miss! Some of the photos in listing have been AI altered. Showings begin on 4/22/26
Key facts
- Ample natural light
- Updated kitchens
- Multi-family home
Tags
Neighborhood map
What this means for you Summary
Snapshot
- This is a 4-bed/2.0-bath multifamily listed at $250k.
Deal economics
- At list price, monthly cash flow is $299 ($4k/yr) — positive.
- The deal already cash-flows at list — no discount required.
- Meets the 1% rule at list price ($3k rent vs $250k).
- Cap rate 7.7% vs local median 3.8% in Cheektowaga — top-decile yield for the area; either an underpriced asset or a hidden risk that comps aren't pricing in. Stress-test before assuming the spread holds.
Location & tenants
- Location reads 84/100 on livability (#54 in NY, #811 nationally) — a professional / high-income tenant draw. Strengths: commute A+, housing A+, health & safety A+; Watch: crime C-.
- Cheektowaga-Maryvale Union Free School District (urban): math 67% / reading 73% proficiency, ranked #154 of 590 in NY (top 26%) — strong family-tenant draw, lease renewals of 3-5y typical.
- Market conditions: 207 active listings in the ZIP; 4 comparable units currently listed for rent nearby; rentals leasing fast (median 3d on market — plan ~1-2 weeks tenant-placement turnaround); 1,244 units permitted in Erie County in 2024 (563 in 5+ unit buildings).
- At $2,788/mo this rent would consume 50% of the median local household income ($67k/yr) (locally 991% of renters already pay >50% of income on rent) — very limited rent-growth headroom before tenants either downsize or default.
Forward outlook
- Local home prices are declining (-3.0%/yr); year-one equity from $2k of loan paydown is wiped out by about $7k of value loss. Plan a longer hold.
Negotiation context
- Only 12 days on market — expect competitive offers; lowballing is unlikely to land.
- 3 sale attempts since 13y ago with the ask held roughly flat each time — persistent listings suggest the price (not the market) is what's stuck; bring a comps-based counter.
- Current owner paid $127k; list at $250k implies a 97% gain — meaningful room to come down on a strong offer.
Risks & watch-outs
- Watch-outs: built in 1952 — expect roof / HVAC / electrical / plumbing capex.
Questions for the listing agent
- Built in 1952 — when were the roof, HVAC, electrical panel, plumbing, and water heater last replaced?
- Is there a deadline driving the sale (1031 exchange, divorce, estate, relocation)? That informs how much negotiation room exists.
- Schools are B-rated — typically a magnet for longer-tenancy family renters. What's the average tenant stay here, and is there a school-zone premium baked into asking?
- What's the average days-on-market for RENTAL listings here right now (not sales)? A rising rental-DOM trend means longer vacancies and softer asking-rent achievability than the comps imply.
- What's the recent tenant-quality profile in this submarket — average credit score on applications, eviction rate, late-payment / NSF rate, and stable-employment percentage? A property-management company in the area should have these aggregated.
- How much new apartment / multifamily construction is in the pipeline within 1–3 miles? Heavy new supply (>2% of stock underway) typically softens rents 12–24 months out; light construction supports rent growth.
Investment metrics
- 1% rule
- 1.12% ✓
- Cap rate
- 7.73%
- Cash-on-cash
- 5.12%
- DSCR
- 1.23
- GRM
- 7.5
CMA / ARV
- ARV (median comp)
- $439,105
- List price
- $249,900
- Delta
- -43.09%
- Verdict
- UNDERPRICED
- Comps
- 20 within 1.0 mi
Show comp detail 9 sales within ~0.75 mi
| Address | Dist | Beds/Ba | Sqft | Sold | Price | $/sf | Match |
|---|---|---|---|---|---|---|---|
| 24 Garden Rd | 0.04mi | 4/2.0 | 1,856 (0%) | 12mo | $273,000 | $147 | 88 |
| 7 Matthew Ln | 0.08mi | 4/2.0 | 1,792 (-3%) | 4mo | $250,000 | $140 | 87 |
| 1 Jean | 0.13mi | 4/2.0 | 1,798 (-3%) | 22mo | $270,000 | $150 | 70 |
| 302 S Forest Rd | 0.38mi | 5/2.0 (+1) | 1,822 (-2%) | 6mo | $282,500 | $155 | 70 |
| 16 Wilshire Rd | 0.18mi | 4/2.0 | 1,930 (+4%) | 22mo | $201,350 | $104 | 67 |
| 36 Montfort Dr | 0.36mi | 4/2.0 | 1,941 (+5%) | 17mo | $241,100 | $124 | 61 |
| 18 Doyle Ct | 0.48mi | 5/2.5 (+1) | 1,926 (+4%) | 16mo | $340,000 | $177 | 51 |
| 4613 Union Rd | 0.58mi | 4/2.0 | 1,612 (-13%) | 9mo | $200,000 | $124 | 44 |
| 620 Beach Rd | 0.64mi | 4/2.0 | 1,600 (-14%) | 14mo | $224,000 | $140 | 36 |
Match score weights: distance 35% · size 25% · config 20% · recency 20%. Top-matched comps best support the ARV.
Projected returns pro-forma
-3.0% appreciation · 3.0% rent growth · sell at horizon
- IRR
- -8.3%
- Equity multiple
- 0.70×
- Total profit
- $-21,326
- Equity at exit
- $37,261
- IRR
- 1.3%
- Equity multiple
- 1.09×
- Total profit
- $6,530
- Equity at exit
- $21,607
Cash invested: $69,972 (down + closing). Projections, not guarantees.
Landlord ↔ Tenant lean methodology
- Overall (STATE)
- 15 Strongly Tenant-Friendly
- State New York
- 15 Strongly Tenant-Friendly · D+10
- County
- — inherits STATE
- City
- — inherits STATE
ZIP-level market 14225
- Home prices YoY
- -27.3%
- Active inventory
- 207
- Price-to-rent
- 14.9×
Monthly cashflow live
- Estimated rent
- $2,788 high interval (Pro) →
- Mortgage (P&I)
- −$1,311
- Tax from tax record
- −$489 /mo · $5,872/yr
- Insurance
- −$104
- HOA
- −$0
- Vacancy / Maint / Mgmt
- −$585
- Net cashflow
- $299
Break-even live
2-unit breakdown (identical units grouped — click to expand)
| Units | Beds | Baths | Est. rent |
|---|---|---|---|
| 2× units | 2 | 1 | $2,788 |
| #1 | 2 | 1 | $1,394 |
| #2 | 2 | 1 | $1,394 |
| Total (2 units) | $2,788 | ||
UW: 25.0% down · 7.5% · 30yr · 1.5% tax · 5.0% vac · 8.0% maint · 8.0% mgmt
Financing live
Cash to close
- Down payment
- $62,475
- Closing costs
- $7,497
- Reserves months
- —
- Total cash needed
- —
Loan-product check · same deal, 3 products live
Conventional
25% down · 7.5% · 30yr
- Down + closing
- —
- Monthly P&I
- —
- Monthly cashflow
- —
- DSCR
- —
- Eligible?
- —
Personal DTI + credit; lowest rate.
DSCR
20% down · 8.5% · 30yr
- Down + closing
- —
- Monthly P&I
- —
- Monthly cashflow
- —
- DSCR
- —
- Eligible?
- —
No personal income docs; deal must DSCR.
Hard money
10% down · 12.0% · 12mo
- Down + closing
- —
- Monthly P&I
- —
- Monthly cashflow
- —
- DSCR
- —
- Eligible?
- —
Short-term bridge; refi at stabilization.
Rent comps 4 comps
| Address | Beds | Baths | Sqft | Rent | $/sqft | DOM | Units | Dist |
|---|---|---|---|---|---|---|---|---|
| 758 S Huth Rd Buffalo, NY | 5.0 | 2.0 | 2235 | $2,800 | $1.25 | 43d | 1 | 0.55mi |
| 512 Cayuga Rd Buffalo, NY | 3.0 | 1.0 | 1944 | $1,795 | $0.92 | 1d | 1 | 0.78mi |
| 239 Lehn Springs Dr Buffalo, NY | 3.0 | 1.0 | 1700 | $3,200 | $1.88 | 3d | 1 | 1.10mi |
| 44 Aurora Dr Buffalo, NY | 3.0 | 1.0 | 1272 | $3,300 | $2.59 | 1d | 1 | 1.33mi |
Listing history 10 events
-
2026-05-02status Pending 1092-char remark
Show marketing remark (1092 chars)
Discover an exceptional investment opportunity in the highly sought-after area of Cheektowaga! This well-maintained multi-family home offers strong income potential and consistent rental demand, making it ideal for both seasoned investors and owner-occupants. Featuring multiple spacious units, each apartment boasts bright living areas, generously sized bedrooms, and functional layouts designed for comfortable living. Tenants will appreciate the ample natural light, updated kitchens and baths, and plenty of storage throughout. The property includes separate utilities, off-street parking, and a sizable yard—adding convenience and appeal for residents. Located just minutes from shopping, dining, major highways, and everyday amenities, this home ensures long-term desirability and ease of renting. Whether you’re looking to expand your portfolio or live in one unit while generating income from the others, this high-demand Cheektowaga multi-family is a rare find you won’t want to miss! Some of the photos in listing have been AI altered. Showings begin on 4/22/26
-
2026-04-20$249,900 Active 1092-char remark
Show marketing remark (1092 chars)
Discover an exceptional investment opportunity in the highly sought-after area of Cheektowaga! This well-maintained multi-family home offers strong income potential and consistent rental demand, making it ideal for both seasoned investors and owner-occupants. Featuring multiple spacious units, each apartment boasts bright living areas, generously sized bedrooms, and functional layouts designed for comfortable living. Tenants will appreciate the ample natural light, updated kitchens and baths, and plenty of storage throughout. The property includes separate utilities, off-street parking, and a sizable yard—adding convenience and appeal for residents. Located just minutes from shopping, dining, major highways, and everyday amenities, this home ensures long-term desirability and ease of renting. Whether you’re looking to expand your portfolio or live in one unit while generating income from the others, this high-demand Cheektowaga multi-family is a rare find you won’t want to miss! Some of the photos in listing have been AI altered. Showings begin on 4/22/26
-
2016-07-21soldstatus $127,000 Closed Sale or Rented 372-char remark
Show marketing remark (372 chars)
Beautifully & completely updated duplex '13. Nothing to do but move in or purchase as investment property. New kitchens, baths flooring thruout, extras include: crown molding, ceramic tiles, tasteful neutral decor. furnace '12 & other 2010, hwt'12, vinyl siding, windows '12. High demand duplex, great location!! Star savings $533.14. annually on school taxes.
-
2016-07-15soldstatus $127,000
-
2016-04-26status Pending Sale 372-char remark
Show marketing remark (372 chars)
Beautifully & completely updated duplex '13. Nothing to do but move in or purchase as investment property. New kitchens, baths flooring thruout, extras include: crown molding, ceramic tiles, tasteful neutral decor. furnace '12 & other 2010, hwt'12, vinyl siding, windows '12. High demand duplex, great location!! Star savings $533.14. annually on school taxes.
-
2016-04-04$134,900 Active 372-char remark
Show marketing remark (372 chars)
Beautifully & completely updated duplex '13. Nothing to do but move in or purchase as investment property. New kitchens, baths flooring thruout, extras include: crown molding, ceramic tiles, tasteful neutral decor. furnace '12 & other 2010, hwt'12, vinyl siding, windows '12. High demand duplex, great location!! Star savings $533.14. annually on school taxes.
-
2013-07-01soldstatus $122,000
-
2013-06-26soldstatus $122,000
-
2013-01-25$130,000
-
2012-07-18soldstatus $42,400
ⓘ Source: listings_history table (triggers on properties + properties_extension) + one-shot
backfill from property_details.listing_events for pre-trigger history.
Tax reassessment forecast NY · Partial reset (capped growth)
- Current annual tax
- $5,872 · $489/mo
- Projected year-2 tax
- $5,872 · $489/mo
- Expected delta
- $0/yr ($0/mo · 0.0%)
ⓘ Screening estimate from a state-policy table — verify with the county assessor before closing.
Climate risk First Street
- Flood 1/10 Low FEMA zone X (unshaded) · 0% chance over 30 yrs
- Wildfire 1/10 Low
- Heat 2/10 Low 7 d/yr ≥92°F today · 15 d/yr by 30 yrs out
- Wind 1/10 Low
- Air quality 3/10 Moderate 2 unhealthy d/yr today · 3 by 30 yrs out
Nearby sold comps map
Loading sold comps map…
Walkable amenities ~0.75 mi
Loading nearby amenities…
Taxation est. · year 1
- Rental income
- $33,456
- − Mortgage interest
- −$13,998
- − Property taxes
- −$5,872
- − Insurance
- −$1,250
- − Repairs & maintenance
- −$2,676
- − Management
- −$2,676
- − Depreciation
- −$7,270
- Taxable loss
- −$286
- Est. tax savings @ 24.0%
- +$69
- After-tax cash flow
- $3,652/yr
For passive investors: Depreciation is non-cash, so a rental often shows a tax loss while cash-flowing — sheltering income. Rental losses are passive: they offset passive income freely, and up to $25,000/yr can offset ordinary (W-2) income if you actively participate and your MAGI is under $100k (phasing out to $0 by $150k); unused losses carry forward. On sale, claimed depreciation is recaptured at up to 25%, and gains may owe capital-gains tax (a 1031 exchange can defer both). Figures are a year-1 estimate at your 24.0% rate — not tax advice; consult a CPA.
Schools (NCES district)
- District
- Cheektowaga-Maryvale Union Free School District
- NCES district ID
- 3618600
- Math proficiency
- 67% ▲ 11.00%
- Reading proficiency
- 73% ▲ 23.00%
- Median HH income
- $46,537
- Composite
- 59.02/100
- National rank
- #960
- State rank
- #154 of 590 in NY
Livability — Cheektowaga
- Score
- 84/100
- State rank
- #54
- US rank
- #811
Category grades
Schools grade is shown separately in the Schools card above.
Census & demographics
- Census place
- Cheektowaga, NY
- County
- Erie County · 714,559 people
- City population
- 55,470
- Metro
- Buffalo-Cheektowaga, NY
- Population (ZIP)
- 33,620
- Household income
- $67,237
- Rent vs Own
- Severe rent burden
- 991.0
Population outlook (Erie County) Hauer SSP2
- Today (2025)
- 933,037 people
- By 2030
- 935,181 · +0.2%
- By 2040
- 928,531 · -0.5%
- By 2050
- 905,725 · -2.9%
- By 2075
- 834,037 · -10.6%
- By 2100
- 708,033 · -24.1%
Race, ethnicity, and origin ACS 2023
- Neighborhood character
- Predominantly White (74%)
- Race & ethnicity
- White 74% Black 13% Two or more races 7% Hispanic / Latino 4% Asian 3%
- Common ancestry
- Romanian 21% Lithuanian 3% Iranian 1%
- Foreign-born
- 6% · Canada, Vietnam
- Languages at home
- 92% English-only · Other Indo-European 2% Spanish 2% Arabic 1%
Political lean MEDSL · Erie
- 2024 margin
- Lean D (+9.7) · D 54.8% · R 45.2%
- 2008→2024 swing
- -7.9pp toward R · 2008: 17.5pp · 2024: 9.7pp
- All cycles
- 2024: D+9.7 2020: D+14.7 2016: D+4.8 2012: D+15.6 2008: D+17.5
Not yet ingested
- Civics
- —
Market trends
- HPI YoY
- ▼ -120.26%
- Current HPI
- 320.6248
- Rent YoY
- —
- Metro
- Buffalo-Cheektowaga, NY
- State GDP YoY
- ▲ 2.60%
- F500 in state
- 92
Industry mix (Fortune 500 HQ in NY)
| Industry | F500 HQs | Revenue |
|---|---|---|
| Financial Services | 10 | $950B |
|
||
| Consumer Goods | 9 | $162B |
|
||
| Insurance | 4 | $225B |
|
||
| Telecommunications | 2 | $144B |
|
||
| Pharmaceuticals | 2 | $112B |
|
||
| Media / Entertainment | 2 | $69B |
|
||
Price history
+489.4% since first listed10 events — show timeline
- 2026-05-02 Pending — WNYREIS
- 2026-04-20 Listed $249,900 WNYREIS
- 2016-07-21 Sold (MLS) $127,000 WNYREIS
- 2016-07-15 Sold (Public Records) $127,000 Public Records
- 2016-04-26 Pending — WNYREIS
- 2016-04-04 Listed $134,900 WNYREIS
- 2013-07-01 Sold (MLS) $122,000 WNYREIS
- 2013-06-26 Sold (Public Records) $122,000 Public Records
- 2013-01-25 Listed $130,000 WNYREIS
- 2012-07-18 Sold (Public Records) $42,400 Public Records
Property tax history
+7.1%/yrLatest (2025): $5,872 · +0.9% YoY. Source: county tax records.
Cash-flow waterfall
monthlySold comps — $/sqft
last 12 mo · ≤1 miLoading sold comps…