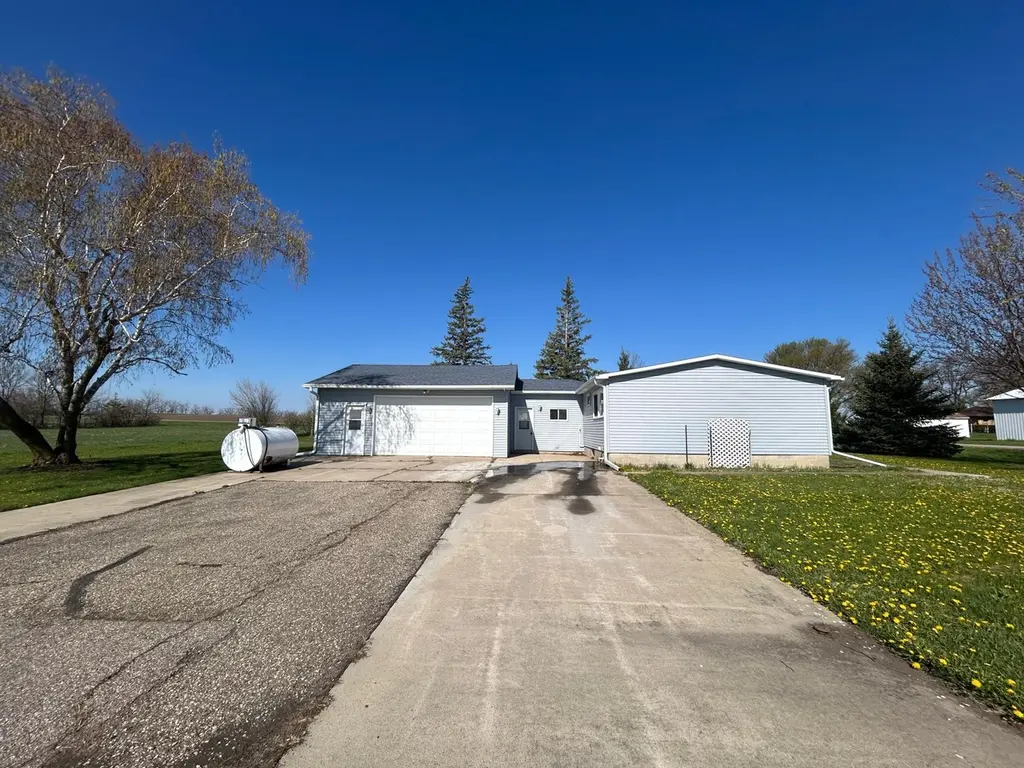
200 Prairie Ave · Darfur, MN
Flood risk 1/10 · Minimal
- FEMA flood zone
- X (unshaded)
- Chance of flooding over 30 yrs
- 0.0%
- Est. flood insurance / yr
- $507 – $1,088
Fire risk 1/10 · Minimal
- Est. fire insurance / yr
- $888 – $1,650
Heat risk 2/10 · Minimal
- Hot days now (above 99°F)
- 7 days/yr
- Hot days in 30 yrs
- 15 days/yr
Wind risk 2/10 · Minimal
- Chance of severe wind over 30 yrs
- —
Air-quality risk 1/10 · Minimal
- Unhealthy air days now
- 0 days/yr
- Unhealthy air days in 30 yrs
- 0 days/yr
Risk factors via First Street. Map © Google.
Why this score? — see what drove the C grade
The composite is a weighted blend of 9 inputs, each scored 0–100. Each bar is that input's sub-score; the figure is the points it added to the 100-point composite (weight × sub-score).
- Cash flow +21.7/30.0
- ARV discount +7.5/15.0
- DSCR +6.9/10.0
- 1% rule +5.3/10.0
- Appreciation +5.0/10.0
- Schools +3.7/10.0
- Livability +3.1/5.0
- Rent growth +2.5/5.0
- Condition / age +2.5/5.0
$115,000
🖨 Deal sheet 📄 Offer letter ✓ Due diligence
Listing remarks
Welcome to 200 Prairie Ave in Darfur, MN! This 3-bedroom, 2-bath home offers plenty of space and opportunity in a quiet small-town setting. Sitting on a generous lot, the property features a functional layout with comfortable living areas and a design that fits a variety of needs. Outside, you’ll find spacious patios perfect for relaxing or entertaining, along with a handy storage shed for tools, lawn equipment, or extra storage. With solid square footage and room to update or customize, this home is a great option for someone looking to build equity or create their ideal space. Whether you’re an investor or a buyer looking for a project, this property has strong potential in a
Key facts
- Peaceful location
- Functional layout
- Spacious patios
Tags
Property features AI
Finance
- Other: No fractional ownership
Exterior
- Parking: Attached garage with 2 spaces (garage dimensions approximately 26 x 26)
- Utilities: City water connected; City sewer connected; Electric fuel
- Home design: Residential property; One level; City view; Primary bedroom with walk-in closet; Walk-in closet
- Construction: Block foundation; Foundation area approximately 1,344; Above grade finished area approximately 1,520; Total building area approximately 2,864
- Exterior features: Vinyl exterior; Patio; Corner lot; City street frontage
Interior
- Kitchen: Includes washer/dryer hookup
- Bedrooms: 3 bedrooms (primary and an additional bedroom on the main floor)
- Bathrooms: 1 full bathroom on the main floor; 1 half bathroom in the basement
- Heating & cooling: Forced air heating; Central air conditioning
- Interior features: Main floor primary bedroom and main floor bedroom; Main floor laundry; Block basement
- Laundry & utility: Main level laundry; Washer/dryer hookup
Neighborhood map
What this means for you Summary
Snapshot
- This is a 3-bed/2.0-bath single-family listed at $115k.
Deal economics
- At list price, monthly cash flow is $178 ($2k/yr) — positive.
- The deal already cash-flows at list — no discount required.
- Meets the 1% rule at list price ($1k rent vs $115k).
- Recommended offer: $112k (3.0% below list) — sets the bar for market timing.
Location & tenants
- Location reads 62/100 on livability (#677 in MN) — a middle-class / working-renter tenant base. Strengths: cost of living A+, housing A+; Watch: crime D+, health & safety D+, schools F.
- Comfrey Public School District (rural): math 25% / reading 55% proficiency, ranked #356 of 467 in MN (top 76%) — families likely to look elsewhere, expect single-tenant / working-renter base with shorter leases.
- Market conditions: 1 active listings in the ZIP; 4 units permitted in Watonwan County in 2024 (0 in 5+ unit buildings).
Forward outlook
- In year one you build about $4k of equity ($795 loan paydown + $3k appreciation (3.0% local appreciation)).
- Watonwan County population projected to shrink 10% by 2050 — rents likely to lag national; underwrite the cash flow, not the appreciation.
- At projected returns (3.0% appreciation + 3.0% rent growth), your $32k cash investment doubles in ~5 years — after that, you're playing with house money.
- By year 8, paydown + projected appreciation supports a ~$31k cash-out refi (75% LTV) — recoverable capital for the next deal without selling this one.
Negotiation context
- It's been on market 44 days — a 3% lower offer ($112k) is reasonable based on typical stale-listing flexibility.
- Current owner paid $21k; list at $115k implies a 453% gain — meaningful room to come down on a strong offer.
Questions for the listing agent
- It's been on market 44 days. Have you received any prior offers? Is the seller open to a 3% concession, seller financing, or rate buy-down credit?
- Built in 1973 — when were the roof, HVAC, electrical panel, plumbing, and water heater last replaced?
- Is there a deadline driving the sale (1031 exchange, divorce, estate, relocation)? That informs how much negotiation room exists.
- Schools are F-rated, which usually means shorter tenancies and higher turnover. Who's the typical renter profile here, and what's been the actual vacancy rate?
- Crime grade is D in this area — have there been break-ins, vandalism, or insurance claims at this property in the last 3 years? What carrier currently insures it and at what premium?
- What's the average days-on-market for RENTAL listings here right now (not sales)? A rising rental-DOM trend means longer vacancies and softer asking-rent achievability than the comps imply.
- What's the recent tenant-quality profile in this submarket — average credit score on applications, eviction rate, late-payment / NSF rate, and stable-employment percentage? A property-management company in the area should have these aggregated.
- How much new for-sale + rental construction is in the pipeline within 1–3 miles? Heavy new supply typically softens prices + rents 12–24 months out; constrained supply supports both.
Investment metrics
- 1% rule
- 1.03% ✓
- Cap rate
- 8.15%
- Cash-on-cash
- 6.62%
- DSCR
- 1.29
- GRM
- 8.1
CMA / ARV
- ARV (median comp)
- $43,857
- List price
- $115,000
- Delta
- 162.22%
- Verdict
- OVERPRICED
- Comps
- 2 within 1.0 mi
Show comp detail 2 sales within ~0.75 mi
| Address | Dist | Beds/Ba | Sqft | Sold | Price | $/sf | Match |
|---|---|---|---|---|---|---|---|
| 103 1st Street North St | 0.13mi | 3/1.0 | 1,421 (-6%) | 19mo | $46,000 | $32 | 63 |
| 314 Pioneer Avenue Ave | 0.18mi | 3/1.0 | 1,364 (-10%) | 9mo | $42,000 | $31 | 63 |
Match score weights: distance 35% · size 25% · config 20% · recency 20%. Top-matched comps best support the ARV.
Projected returns pro-forma
3.0% appreciation · 3.0% rent growth · sell at horizon
- IRR
- 13.7%
- Equity multiple
- 1.78×
- Total profit
- $25,169
- Equity at exit
- $51,709
- IRR
- 15.6%
- Equity multiple
- 3.29×
- Total profit
- $73,742
- Equity at exit
- $79,690
Cash invested: $32,200 (down + closing). Projections, not guarantees.
Landlord ↔ Tenant lean methodology
- Overall (STATE)
- 46 Balanced
- State Minnesota
- 46 Balanced · D+2
- County
- — inherits STATE
- City
- — inherits STATE
ZIP-level market 56022
- Active inventory
- 1
- Price-to-rent
- 8.1×
Monthly cashflow live
- Estimated rent
- $1,182 medium interval (Pro) →
- Mortgage (P&I)
- −$603
- Tax from tax record
- −$105 /mo · $1,260/yr
- Insurance
- −$48
- HOA
- −$0
- Vacancy / Maint / Mgmt
- −$248
- Net cashflow
- $178
Break-even live
UW: 25.0% down · 7.5% · 30yr · 1.5% tax · 5.0% vac · 8.0% maint · 8.0% mgmt
Financing live
Cash to close
- Down payment
- $28,750
- Closing costs
- $3,450
- Reserves months
- —
- Total cash needed
- —
Loan-product check · same deal, 3 products live
Conventional
25% down · 7.5% · 30yr
- Down + closing
- —
- Monthly P&I
- —
- Monthly cashflow
- —
- DSCR
- —
- Eligible?
- —
Personal DTI + credit; lowest rate.
DSCR
20% down · 8.5% · 30yr
- Down + closing
- —
- Monthly P&I
- —
- Monthly cashflow
- —
- DSCR
- —
- Eligible?
- —
No personal income docs; deal must DSCR.
Hard money
10% down · 12.0% · 12mo
- Down + closing
- —
- Monthly P&I
- —
- Monthly cashflow
- —
- DSCR
- —
- Eligible?
- —
Short-term bridge; refi at stabilization.
Listing history 18 events
-
2026-06-18days on market $115,000 Active 44 DOM
-
2026-06-17days on market $115,000 Active 43 DOM
-
2026-06-16days on market $115,000 Active 42 DOM
-
2026-06-15days on market $115,000 Active 41 DOM
-
2026-06-13days on market $115,000 Active 39 DOM
-
2026-06-12days on market $115,000 Active 38 DOM
-
2026-06-09days on market $115,000 Active 35 DOM
-
2026-06-08days on market $115,000 Active 34 DOM
-
2026-06-07days on market $115,000 Active 33 DOM
-
2026-06-05days on market $115,000 Active 31 DOM
-
2026-06-04days on market $115,000 Active 29 DOM
-
2026-06-02days on market $115,000 Active 28 DOM
-
2026-06-01days on market $115,000 Active 27 DOM
-
2026-05-31days on market $115,000 Active 26 DOM
-
2026-05-31days on market $115,000 Active 25 DOM
-
2026-05-05$115,000 Active 718-char remark
-
2005-05-12soldstatus $20,800
-
1998-09-18soldstatus $24,750
ⓘ Source: listings_history table (triggers on properties + properties_extension) + one-shot
backfill from property_details.listing_events for pre-trigger history.
Tax reassessment forecast MN · Partial reset (capped growth)
- Current annual tax
- $1,260 · $105/mo
- Projected year-2 tax
- $1,274 · $106/mo
- Expected delta
- +$14/yr (+$1/mo · 1.1%)
ⓘ Screening estimate from a state-policy table — verify with the county assessor before closing.
Climate risk First Street
- Flood 1/10 Low FEMA zone X (unshaded) · 0% chance over 30 yrs
- Wildfire 1/10 Low
- Heat 2/10 Low 7 d/yr ≥99°F today · 15 d/yr by 30 yrs out
- Wind 2/10 Low
- Air quality 1/10 Low 0 unhealthy d/yr today · 0 by 30 yrs out
Nearby sold comps map
Loading sold comps map…
Walkable amenities ~0.75 mi
Loading nearby amenities…
Taxation est. · year 1
- Rental income
- $14,184
- − Mortgage interest
- −$6,442
- − Property taxes
- −$1,260
- − Insurance
- −$575
- − Repairs & maintenance
- −$1,135
- − Management
- −$1,135
- − Depreciation
- −$3,345
- Taxable income
- $292
- Est. tax owed @ 24.0%
- −$70
- After-tax cash flow
- $2,063/yr
For passive investors: Depreciation is non-cash, so a rental often shows a tax loss while cash-flowing — sheltering income. Rental losses are passive: they offset passive income freely, and up to $25,000/yr can offset ordinary (W-2) income if you actively participate and your MAGI is under $100k (phasing out to $0 by $150k); unused losses carry forward. On sale, claimed depreciation is recaptured at up to 25%, and gains may owe capital-gains tax (a 1031 exchange can defer both). Figures are a year-1 estimate at your 24.0% rate — not tax advice; consult a CPA.
Schools (NCES district)
- District
- Comfrey Public School District
- NCES district ID
- 2709540
- Math proficiency
- 25% ▬ 0.00%
- Reading proficiency
- 55% ▲ 5.00%
- Median HH income
- $52,708
- Composite
- 37.12/100
- National rank
- #9031
- State rank
- #356 of 467 in MN
Livability — Darfur
- Score
- 62/100
- State rank
- #677
- US rank
- #16455
Category grades
Schools grade is shown separately in the Schools card above.
Census & demographics
- Census place
- Darfur, MN
- City population
- 100
- Population (ZIP)
- 100
Population outlook (Watonwan County) Hauer SSP2
- Today (2025)
- 10,579 people
- By 2030
- 10,354 · -2.1%
- By 2040
- 9,923 · -6.2%
- By 2050
- 9,558 · -9.7%
- By 2075
- 9,236 · -12.7%
- By 2100
- 8,812 · -16.7%
Race, ethnicity, and origin ACS 2023
- Neighborhood character
- Predominantly White (88%)
- Race & ethnicity
- White 88% Hispanic / Latino 12% Two or more races 1%
- Hispanic origin (detail)
- Mexican 11%
- Common ancestry
- Italian 18% Portuguese 4%
Political lean MEDSL · Watonwan
- 2024 margin
- Strong R (+27.8) · D 35.1% · R 62.9% · Other 2.0%
- 2008→2024 swing
- -28.5pp toward R · 2008: 0.7pp · 2024: -27.8pp
- All cycles
- 2024: R+27.8 2020: R+21.5 2016: R+19.2 2012: R+0.5 2008: D+0.7
Not yet ingested
- Civics
- —
Market trends
- HPI YoY
- —
- Current HPI
- —
- Rent YoY
- —
- Metro
- —
- State GDP YoY
- ▲ 2.41%
- F500 in state
- 34
Industry mix (Fortune 500 HQ in MN)
| Industry | F500 HQs | Revenue |
|---|---|---|
| Healthcare | 2 | $407B |
|
||
| Retail | 2 | $150B |
|
||
| Consumer Goods | 2 | $32B |
|
||
| Industrial Machinery | 2 | $6B |
|
||
| Agriculture | 1 | $40B |
|
||
| Healthcare / Medical Devices | 1 | $32B |
|
||
Price history
+364.6% since first listed3 events — show timeline
- 2026-05-05 Listed $115,000 NORTHSTARMLS as Distributed by MLS Grid
- 2005-05-12 Sold (Public Records) $20,800 Public Records
- 1998-09-18 Sold (Public Records) $24,750 Public Records
Property tax history
+7.1%/yrLatest (2025): $1,260 · +9.0% YoY. Source: county tax records.
Cash-flow waterfall
monthlySold comps — $/sqft
last 12 mo · ≤1 miLoading sold comps…