 7-Plex
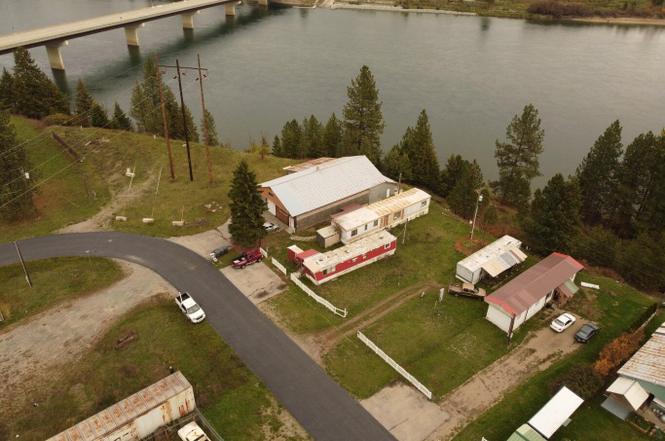
215 N Montana Ave · Oldtown, ID
Flood risk 1/10 · Minimal
- FEMA flood zone
- X (unshaded)
- Chance of flooding over 30 yrs
- 0.0%
- Est. flood insurance / yr
- $507 – $1,088
Fire risk 4/10 · Minor
- Est. fire insurance / yr
- $584 – $1,086
Heat risk 2/10 · Minimal
- Hot days now (above 92°F)
- 7 days/yr
- Hot days in 30 yrs
- 16 days/yr
Wind risk 1/10 · Minimal
- Chance of severe wind over 30 yrs
- —
Air-quality risk 9/10 · Severe
- Unhealthy air days now
- 16 days/yr
- Unhealthy air days in 30 yrs
- 16 days/yr
Risk factors via First Street. Map © Google.
Why this score? — see what drove the D grade
The composite is a weighted blend of 9 inputs, each scored 0–100. Each bar is that input's sub-score; the figure is the points it added to the 100-point composite (weight × sub-score).
- Cash flow +9.4/30.0
- ARV discount +7.5/15.0
- Appreciation +6.2/10.0
- Schools +3.7/10.0
- Livability +3.4/5.0
- 1% rule +2.8/10.0
- DSCR +2.6/10.0
- Rent growth +2.5/5.0
- Condition / age +2.5/5.0
$999,000
🖨 Deal sheet 📄 Offer letter ✓ Due diligence
Multi-family units
County records classify this as Multi-Family (2-4 Unit). Listing-text estimate: 7 units. estimate disagrees with records
Listing remarks
INCREDIBLE RIVERFRONT INVESTMENT PROPERTY in downtown Oldtown. Fantastic Pend Oreille River and mountain views from this level property, with river access down to the river. Perfect property for multi-unit housing, tiny homes, rental homes, etc. Conveniences of Oldtown and Newport, WA are within a couple blocks. Public boat launch at the park across the river! Property has a large shop building that could be indoor storage, garage parking, or some other creative use to accompany your development. Public maintained roads, city services and level building site makes this a gem! Seller currently rents out four mobile homes onsite, which used to have seven units, as well as RV sites in years pa
Key facts
- Garage parking
- River access
- Multi-unit housing
Tags
Property features AI
Exterior
- Parking: Open RV parking
- Utilities: Public water; Public sewer; Cable TV available
- Home design: Multi-unit property (4 units)
- Construction: Wood siding frame construction; Metal roof; Concrete perimeter foundation
- Exterior features: Partial front-yard fencing; Open, irregular, sloped and level mixed lot with southern exposure; Wooded areas and bordering special land; Workshop and storage structures; Paved public-maintained road access; Waterfront on the lot; Views
Interior
- Bedrooms: One 3-bedroom unit; Three 2-bedroom units
- Bathrooms: Four 1-bath units
- Heating & cooling: Cadet electric baseboard heating
- Interior features: Cable internet available; Satellite service; Satellite dish
Neighborhood map
What this means for you Summary
Snapshot
- This is a 7 × 9-bed/4.0-bath units multifamily listed at $999k.
Deal economics
- At list price, monthly cash flow is $-719 ($-9k/yr) — negative. Per door: $-103/mo.
- To cash-flow at today's rent, offer at most $895k (10.4% below list).
- To meet the 1% rule (rent ≥ 1% of price), the offer needs to be $783k (21.6% below list).
- Recommended offer: $783k (21.6% below list) — sets the bar for 1% rule.
- Cap rate 5.4% vs local median 0.5% in Oldtown — top-decile yield for the area; either an underpriced asset or a hidden risk that comps aren't pricing in. Stress-test before assuming the spread holds.
Location & tenants
- Location reads 67/100 on livability (#94 in ID) — a middle-class / working-renter tenant base. Strengths: cost of living A+, housing A+, crime B+; Watch: schools D-, amenities F, commute F.
- West Bonner County District (rural): math 36% / reading 53% proficiency, ranked #51 of 92 in ID (top 55%) — families likely to look elsewhere, expect single-tenant / working-renter base with shorter leases.
- Market conditions: 70 active listings in the ZIP; 147 units permitted in Bonner County in 2024 (24 in 5+ unit buildings).
Forward outlook
- In year one you build about $31k of equity ($7k loan paydown + $24k appreciation (2.4% local appreciation)).
- By year 3, paydown + projected appreciation supports a ~$79k cash-out refi (75% LTV) — recoverable capital for the next deal without selling this one.
Negotiation context
- It's been on market 235 days — a 12% lower offer ($879k) is reasonable based on typical stale-listing flexibility.
- 6 sale attempts since 8y ago with the ask held roughly flat each time — persistent listings suggest the price (not the market) is what's stuck; bring a comps-based counter.
Questions for the listing agent
- What do current leases actually rent for vs. the listed asking? Can we see a recent rent roll and the last 12 months of T-12 income?
- It's been on market 235 days. Have you received any prior offers? Is the seller open to a 22% concession, seller financing, or rate buy-down credit?
- Can we see the unit-by-unit rent roll, current vacancy, and any below-market leases? What's the average tenancy length?
- What capital expenditures (roof, boiler, parking lot, exteriors) have been made in the last 5 years, and what's planned in the next 2?
- Built in 1970 — when were the roof, HVAC, electrical panel, plumbing, and water heater last replaced?
- Why hasn't it sold? Are there any deal-killer items the seller is aware of (foundation, flood, title, zoning, code violations)?
- Is there a deadline driving the sale (1031 exchange, divorce, estate, relocation)? That informs how much negotiation room exists.
- Schools are D-rated, which usually means shorter tenancies and higher turnover. Who's the typical renter profile here, and what's been the actual vacancy rate?
- The area grade is low — what's the realistic commute time and amenity access for the typical tenant pool here? Any planned neighborhood developments (good or bad) we should know about?
- What's the average days-on-market for RENTAL listings here right now (not sales)? A rising rental-DOM trend means longer vacancies and softer asking-rent achievability than the comps imply.
- What's the recent tenant-quality profile in this submarket — average credit score on applications, eviction rate, late-payment / NSF rate, and stable-employment percentage? A property-management company in the area should have these aggregated.
- How much new apartment / multifamily construction is in the pipeline within 1–3 miles? Heavy new supply (>2% of stock underway) typically softens rents 12–24 months out; light construction supports rent growth.
Investment metrics
- 1% rule
- 0.78% ✗
- Cap rate
- 5.43%
- Cash-on-cash
- -3.08%
- DSCR
- 0.86
- GRM
- 10.6
CMA / ARV
No comps found within radius.
Projected returns pro-forma
2.44% appreciation · 3.0% rent growth · sell at horizon
- IRR
- 2.9%
- Equity multiple
- 1.16×
- Total profit
- $45,336
- Equity at exit
- $417,985
- IRR
- 6.6%
- Equity multiple
- 1.94×
- Total profit
- $263,216
- Equity at exit
- $620,878
Cash invested: $279,720 (down + closing). Projections, not guarantees.
Landlord ↔ Tenant lean methodology
- Overall (STATE)
- 91 Strongly Landlord-Friendly
- State Idaho
- 91 Strongly Landlord-Friendly · R+18
- County
- — inherits STATE
- City
- — inherits STATE
ZIP-level market 83822
- Home prices YoY
- 0.8%
- Active inventory
- 70
- Price-to-rent
- 74.4×
Monthly cashflow live
- Estimated rent
- $7,829 medium interval (Pro) →
- Mortgage (P&I)
- −$5,239
- Tax est. 1.5%
- −$1,249 /mo · $14,985/yr
- Insurance
- −$416
- HOA
- −$0
- Vacancy / Maint / Mgmt
- −$1,644
- Net cashflow
- $-719
Break-even live
7-unit breakdown (identical units grouped — click to expand)
| Units | Beds | Baths | Est. rent |
|---|---|---|---|
| 7× units | 9 | 4 | $7,826 |
| #1 | 9 | 4 | $1,118 |
| #2 | 9 | 4 | $1,118 |
| #3 | 9 | 4 | $1,118 |
| #4 | 9 | 4 | $1,118 |
| #5 | 9 | 4 | $1,118 |
| #6 | 9 | 4 | $1,118 |
| #7 | 9 | 4 | $1,118 |
| Total (7 units) | $7,829 | ||
UW: 25.0% down · 7.5% · 30yr · 1.5% tax · 5.0% vac · 8.0% maint · 8.0% mgmt
Financing live
Cash to close
- Down payment
- $249,750
- Closing costs
- $29,970
- Reserves months
- —
- Total cash needed
- —
Loan-product check · same deal, 3 products live
Conventional
25% down · 7.5% · 30yr
- Down + closing
- —
- Monthly P&I
- —
- Monthly cashflow
- —
- DSCR
- —
- Eligible?
- —
Personal DTI + credit; lowest rate.
DSCR
20% down · 8.5% · 30yr
- Down + closing
- —
- Monthly P&I
- —
- Monthly cashflow
- —
- DSCR
- —
- Eligible?
- —
No personal income docs; deal must DSCR.
Hard money
10% down · 12.0% · 12mo
- Down + closing
- —
- Monthly P&I
- —
- Monthly cashflow
- —
- DSCR
- —
- Eligible?
- —
Short-term bridge; refi at stabilization.
Listing history 28 events
-
2026-06-19days on market $999,000 Active 235 DOM
-
2026-06-18days on market $999,000 Active 234 DOM
-
2026-06-17days on market $999,000 Active 233 DOM
-
2026-06-16days on market $999,000 Active 232 DOM
-
2026-06-15days on market $999,000 Active 231 DOM
-
2026-06-14days on market $999,000 Active 229 DOM
-
2026-06-12days on market $999,000 Active 228 DOM
-
2026-06-09days on market $999,000 Active 225 DOM
-
2026-06-08days on market $999,000 Active 224 DOM
-
2026-06-07days on market $999,000 Active 223 DOM
-
2026-06-07days on market $999,000 Active 222 DOM
-
2026-06-04days on market $999,000 Active 219 DOM
-
2026-06-02days on market $999,000 Active 218 DOM
-
2026-06-01days on market $999,000 Active 217 DOM
-
2026-05-31days on market $999,000 Active 216 DOM
-
2026-05-31days on market $999,000 Active 215 DOM
-
2025-10-27$999,000 Active
-
2024-07-18$905,000 Active
-
2024-02-02price $905,000
-
2023-10-19$995,000 Active
-
2022-12-08price $999,000
-
2022-06-22price $1,000,000
-
2022-05-13$1,100,000 Active
-
2019-09-05soldstatus Closed
-
2019-08-14status Pending
-
2019-01-18$299,000 Active
-
2019-01-01historical Expired
-
2018-06-30$299,000 Active
ⓘ Source: listings_history table (triggers on properties + properties_extension) + one-shot
backfill from property_details.listing_events for pre-trigger history.
Climate risk First Street
- Flood 1/10 Low FEMA zone X (unshaded) · 0% chance over 30 yrs
- Wildfire 4/10 Moderate
- Heat 2/10 Low 7 d/yr ≥92°F today · 16 d/yr by 30 yrs out
- Wind 1/10 Low
- Air quality 9/10 Extreme 16 unhealthy d/yr today · 16 by 30 yrs out
Nearby sold comps map
Loading sold comps map…
Walkable amenities ~0.75 mi
Loading nearby amenities…
Taxation est. · year 1
- Rental income
- $93,948
- − Mortgage interest
- −$55,960
- − Property taxes
- −$14,985
- − Insurance
- −$4,995
- − Repairs & maintenance
- −$7,516
- − Management
- −$7,516
- − Depreciation
- −$29,062
- Taxable loss
- −$26,085
- Est. tax savings @ 24.0%
- +$6,260
- After-tax cash flow
- $-2,367/yr
For passive investors: Depreciation is non-cash, so a rental often shows a tax loss while cash-flowing — sheltering income. Rental losses are passive: they offset passive income freely, and up to $25,000/yr can offset ordinary (W-2) income if you actively participate and your MAGI is under $100k (phasing out to $0 by $150k); unused losses carry forward. On sale, claimed depreciation is recaptured at up to 25%, and gains may owe capital-gains tax (a 1031 exchange can defer both). Figures are a year-1 estimate at your 24.0% rate — not tax advice; consult a CPA.
Schools (NCES district)
- District
- West Bonner County District
- NCES district ID
- 1600001
- Math proficiency
- 36% ▼ -2.00%
- Reading proficiency
- 53% ▲ 4.00%
- Median HH income
- $40,392
- Composite
- 37.24/100
- National rank
- #4460
- State rank
- #51 of 92 in ID
Livability — Oldtown
- Score
- 67/100
- State rank
- #94
- US rank
- #10461
Category grades
Schools grade is shown separately in the Schools card above.
Census & demographics
- Census place
- Oldtown, ID
- Population (ZIP)
- 2,511
Population outlook (Bonner County) Hauer SSP2
- Today (2025)
- 43,740 people
- By 2030
- 44,203 · +1.1%
- By 2040
- 43,936 · +0.4%
- By 2050
- 42,871 · -2.0%
- By 2075
- 41,254 · -5.7%
- By 2100
- 39,074 · -10.7%
Race, ethnicity, and origin ACS 2023
- Neighborhood character
- Predominantly White (94%)
- Race & ethnicity
- White 94% Native American 3% Two or more races 2% Hispanic / Latino 2%
- Common ancestry
- Slovak 5% Lithuanian 4% Iranian 2%
- Foreign-born
- 2%
- Languages at home
- 97% English-only · Russian/Polish/Slavic 1% Spanish 1% German/W. Germanic 1%
Political lean MEDSL · Bonner
- 2024 margin
- Solid R (+46.1) · D 25.8% · R 71.9% · Other 2.3%
- 2008→2024 swing
- -29.2pp toward R · 2008: -16.9pp · 2024: -46.1pp
- All cycles
- 2024: R+46.1 2020: R+36.8 2016: R+30.2 2012: R+26.2 2008: R+16.9
Not yet ingested
- Civics
- —
Market trends
- HPI YoY
- ▲ 2.44%
- Current HPI
- 314.8272
- Rent YoY
- —
- Metro
- —
- State GDP YoY
- ▲ 4.51%
- F500 in state
- 6
Industry mix (Fortune 500 HQ in ID)
| Industry | F500 HQs | Revenue |
|---|---|---|
| Retail | 1 | $79B |
|
||
| Technology | 1 | $25B |
|
||
| Food / Agriculture | 1 | $6B |
|
||
Price history
+234.1% since first listed12 events — show timeline
- 2025-10-27 Listed $999,000 CDAMLS
- 2024-07-18 Listed $905,000 CDAMLS
- 2024-02-02 Price Changed $905,000 CDAMLS
- 2023-10-19 Listed $995,000 CDAMLS
- 2022-12-08 Price Changed $999,000 CDAMLS
- 2022-06-22 Price Changed $1,000,000 CDAMLS
- 2022-05-13 Listed $1,100,000 CDAMLS
- 2019-09-05 Sold (MLS) — CDAMLS
- 2019-08-14 Pending — CDAMLS
- 2019-01-18 Listed $299,000 CDAMLS
- 2019-01-01 Delisted — CDAMLS
- 2018-06-30 Listed $299,000 CDAMLS
Cash-flow waterfall
monthlySold comps — $/sqft
last 12 mo · ≤1 miLoading sold comps…