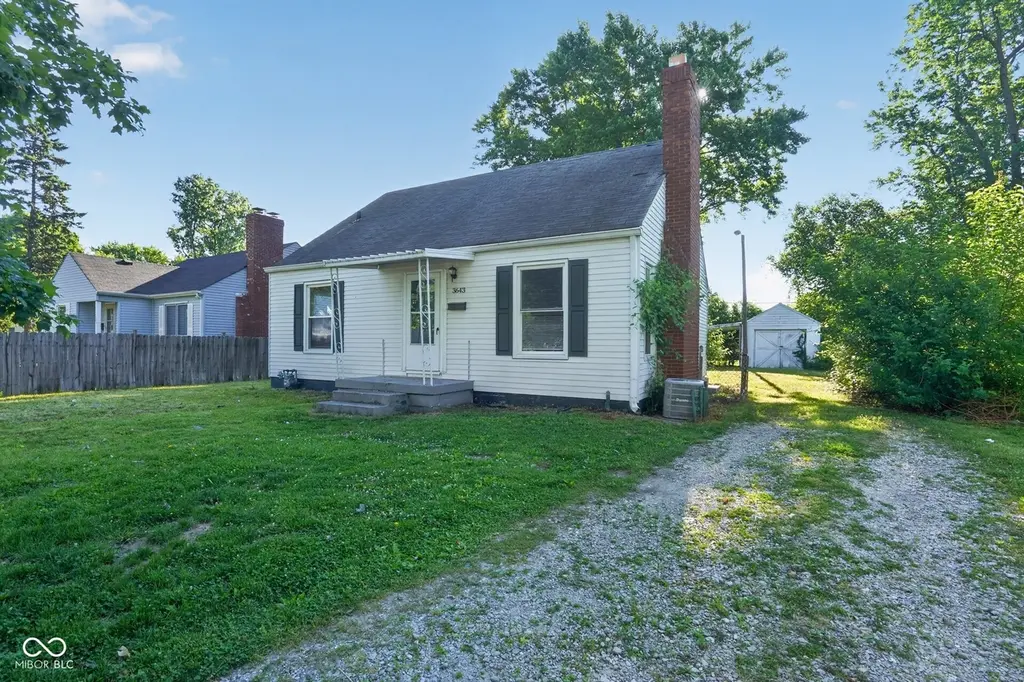
3643 N Lesley Ave · Indianapolis city (balance), IN
Flood risk 1/10 · Minimal
- FEMA flood zone
- X (unshaded)
- Chance of flooding over 30 yrs
- 0.0%
- Est. flood insurance / yr
- $473 – $860
Fire risk 1/10 · Minimal
- Est. fire insurance / yr
- $717 – $1,331
Heat risk 3/10 · Minor
- Hot days now (above 101°F)
- 7 days/yr
- Hot days in 30 yrs
- 18 days/yr
Wind risk 2/10 · Minimal
- Chance of severe wind over 30 yrs
- 1.0%
Air-quality risk 4/10 · Minor
- Unhealthy air days now
- 5 days/yr
- Unhealthy air days in 30 yrs
- 7 days/yr
Risk factors via First Street. Map © Google.
Why this score? — see what drove the B grade
The composite is a weighted blend of 9 inputs, each scored 0–100. Each bar is that input's sub-score; the figure is the points it added to the 100-point composite (weight × sub-score).
- Cash flow +28.1/30.0
- ARV discount +15.0/15.0
- DSCR +10.0/10.0
- 1% rule +7.9/10.0
- Rent growth +2.7/5.0
- Livability +2.5/5.0
- Condition / age +2.5/5.0
- Schools +1.4/10.0
- Appreciation +0.0/10.0
$114,900
🖨 Deal sheet 📄 Offer letter ✓ Due diligence
Listing remarks MLS
3 Bd 1Ba Investment opportunity sits on two lots*LR w/ wood burning FP* Separate DR*2BD on main flr with large 3rd BD on upper level*Unfinished Basement great for storage*Property being "SOLD AS IS"All room sizes are approximate
Key facts
- Single-level home
- Fireplace
- 8,220 sq ft lot
Tags
Property features AI
Finance
- Other: Not in subdivision; Sidewalks, storm sewer, and street lights nearby; Lot is under 1/4 acre (approx. 0.19 acre)
Exterior
- Parking: Detached garage with storage (1 car, approximately 240 sq ft); Gravel parking
- Security: Smoke alarm
- Utilities: Public water; Municipal sewer connected; Natural gas connected; Cable available; Solid waste service
- Home design: Single family residence; One story
- Construction: Vinyl siding; Block foundation
- Exterior features: Covered porch/patio; Full yard fence; Storage shed
Interior
- Kitchen: Refrigerator; Range hood
- Bedrooms: 2 bedrooms (both on the main level); Primary bedroom with tub and separate shower (see remarks)
- Flooring: Hardwood floors
- Bathrooms: 1 full bathroom (main level) with tub and separate shower
- Heating & cooling: Forced air heating (natural gas); Central air conditioning
- Interior features: Hardwood floors; Pantry; Smoke alarm; Sump pump
- Laundry & utility: Laundry in basement; Gas water heater
Neighborhood map
What this means for you Summary
Snapshot
- This is a 3-bed/1.0-bath single-family listed at $115k.
Deal economics
- At list price, monthly cash flow is $361 ($4k/yr) — positive.
- The deal already cash-flows at list — no discount required.
- Meets the 1% rule at list price ($1k rent vs $115k).
- Cap rate 10.1% vs local median 4.4% in Indianapolis city (balance) — top-decile yield for the area; either an underpriced asset or a hidden risk that comps aren't pricing in. Stress-test before assuming the spread holds.
Location & tenants
- Location reads: area grade B — affects rentability + tenant quality, not the cash-flow math above.
- Indianapolis Public Schools (urban): math 14% / reading 20% proficiency, ranked #286 of 301 in IN (top 95%) — low school quality limits family demand, transient renter base, plan for 1-2y turnover; 77% free/reduced lunch — lower-income household profile, screen leases tightly.
- Zoned schools: Arlington Woods School 99 (math 2% / reading 8%, grade F, #970 of 994 statewide, top 99%, 335 students, 85% FRL); Shortridge High School (math 20% / reading 51%, grade F, #263 of 369 statewide, top 72%, 1,089 students, 70% FRL) — zoned schools at 78% FRL track the district average.
- Market conditions: Rents flat; 334 active listings in the ZIP; 7 comparable units currently listed for rent nearby; rentals at typical pace (median 24d on market — plan ~3-4 weeks tenant-placement turnaround); 43% of comp listings sitting > 30 days — soft ceiling on asking rent; lower-income renter base — watch delinquency; 1,906 units permitted in Marion County in 2024 (621 in 5+ unit buildings).
- At $1,479/mo this rent would consume 47% of the median local household income ($38k/yr) (locally 2340% of renters already pay >50% of income on rent) — very limited rent-growth headroom before tenants either downsize or default.
Forward outlook
- Local home prices are declining (-3.0%/yr); year-one equity from $794 of loan paydown is wiped out by about $3k of value loss. Plan a longer hold.
- Marion County population projected at +18% by 2050 — long-run rental-demand tailwind backs the buy-and-hold thesis.
Negotiation context
- Only 6 days on market — expect competitive offers; lowballing is unlikely to land.
- 2 sale attempts since 9y ago with the ask held roughly flat each time — persistent listings suggest the price (not the market) is what's stuck; bring a comps-based counter.
- Current owner paid $40k; list at $115k implies a 187% gain — meaningful room to come down on a strong offer.
Risks & watch-outs
- Watch-outs: built in 1947 — expect roof / HVAC / electrical / plumbing capex.
Questions for the listing agent
- Built in 1947 — when were the roof, HVAC, electrical panel, plumbing, and water heater last replaced?
- Is there a deadline driving the sale (1031 exchange, divorce, estate, relocation)? That informs how much negotiation room exists.
- What's the average days-on-market for RENTAL listings here right now (not sales)? A rising rental-DOM trend means longer vacancies and softer asking-rent achievability than the comps imply.
- What's the recent tenant-quality profile in this submarket — average credit score on applications, eviction rate, late-payment / NSF rate, and stable-employment percentage? A property-management company in the area should have these aggregated.
- How much new for-sale + rental construction is in the pipeline within 1–3 miles? Heavy new supply typically softens prices + rents 12–24 months out; constrained supply supports both.
Investment metrics
- 1% rule
- 1.29% ✓
- Cap rate
- 10.06%
- Cash-on-cash
- 13.46%
- DSCR
- 1.60
- GRM
- 6.5
CMA / ARV
- ARV (on-the-fly)
- $186,368
- Comps found
- 12
Show comp detail 12 sales within ~0.75 mi
| Address | Dist | Beds/Ba | Sqft | Sold | Price | $/sf | Match |
|---|---|---|---|---|---|---|---|
| 5426 Culver St | 0.52mi | 3/1.0 | 1,728 (-4%) | 2mo | $179,000 | $104 | 68 |
| 3505 N Layman Ave | 0.21mi | 2/1.0 (-1) | 1,925 (+7%) | 8mo | $96,000 | $50 | 66 |
| 3506 N Lesley Ave | 0.20mi | 2/1.0 (-1) | 1,980 (+10%) | 7mo | $143,000 | $72 | 62 |
| 4013 N Graham Ave | 0.46mi | 3/2.5 | 1,913 (+7%) | 9mo | $200,000 | $105 | 54 |
| 3823 N Butler Ave | 0.51mi | 3/2.0 | 1,550 (-14%) | 5mo | $220,000 | $142 | 46 |
| 5441 E 34th St | 0.42mi | 4/1.5 (+1) | 1,588 (-11%) | 13mo | $210,000 | $132 | 44 |
| 4128 N Webster Ave | 0.73mi | 4/2.0 (+1) | 1,924 (+7%) | 2mo | $195,000 | $101 | 43 |
| 5349 Culver St | 0.59mi | 3/1.5 | 2,009 (+12%) | 9mo | $175,000 | $87 | 43 |
| 3922 N Butler Ave | 0.59mi | 4/2.0 (+1) | 1,589 (-11%) | 4mo | $123,500 | $78 | 42 |
| 5546 Marilyn Rd | 0.63mi | 3/2.0 | 1,550 (-14%) | 13mo | $205,000 | $132 | 33 |
| 4023 N Arlington Ave | 0.60mi | 4/1.5 (+1) | 1,532 (-14%) | 11mo | $222,000 | $145 | 32 |
| 4012 Sawyer St | 0.67mi | 4/2.0 (+1) | 1,987 (+11%) | 15mo | $191,000 | $96 | 29 |
Match score weights: distance 35% · size 25% · config 20% · recency 20%. Top-matched comps best support the ARV.
Projected returns pro-forma
-3.0% appreciation · 0.81% rent growth · sell at horizon
- IRR
- 1.0%
- Equity multiple
- 1.04×
- Total profit
- $1,209
- Equity at exit
- $17,132
- IRR
- 8.3%
- Equity multiple
- 1.57×
- Total profit
- $18,249
- Equity at exit
- $9,934
Cash invested: $32,172 (down + closing). Projections, not guarantees.
Landlord ↔ Tenant lean methodology
- Overall (STATE)
- 90 Strongly Landlord-Friendly
- State Indiana
- 90 Strongly Landlord-Friendly · R+11
- County
- — inherits STATE
- City
- — inherits STATE
ZIP-level market 46218
- Home prices YoY
- -17.1%
- Rents YoY
- 0.8%
- Active inventory
- 334
- Price-to-rent
- 6.5×
Monthly cashflow live
- Estimated rent
- $1,479 high interval (Pro) →
- Mortgage (P&I)
- −$603
- Tax from tax record
- −$157 /mo · $1,887/yr
- Insurance
- −$48
- HOA
- −$0
- Vacancy / Maint / Mgmt
- −$311
- Net cashflow
- $361
Break-even live
UW: 25.0% down · 7.5% · 30yr · 1.5% tax · 5.0% vac · 8.0% maint · 8.0% mgmt
Financing live
Cash to close
- Down payment
- $28,725
- Closing costs
- $3,447
- Reserves months
- —
- Total cash needed
- —
Loan-product check · same deal, 3 products live
Conventional
25% down · 7.5% · 30yr
- Down + closing
- —
- Monthly P&I
- —
- Monthly cashflow
- —
- DSCR
- —
- Eligible?
- —
Personal DTI + credit; lowest rate.
DSCR
20% down · 8.5% · 30yr
- Down + closing
- —
- Monthly P&I
- —
- Monthly cashflow
- —
- DSCR
- —
- Eligible?
- —
No personal income docs; deal must DSCR.
Hard money
10% down · 12.0% · 12mo
- Down + closing
- —
- Monthly P&I
- —
- Monthly cashflow
- —
- DSCR
- —
- Eligible?
- —
Short-term bridge; refi at stabilization.
Rent comps 7 comps
| Address | Beds | Baths | Sqft | Rent | $/sqft | DOM | Units | Dist |
|---|---|---|---|---|---|---|---|---|
| 3940 N Graham Ave Indianapolis, IN | 3.0 | 1.0 | 2378 | $1,501 | $0.63 | 43d | 1 | 0.41mi |
| 3912 N Webster Ave Indianapolis, IN | 4.0 | 1.0 | 1274 | $1,350 | $1.06 | 21d | 1 | 0.56mi |
| 3070 N Layman Ave #1 Indianapolis, IN | 3.0 | 2.0 | 1480 | $1,700 | $1.15 | 43d | 1 | 0.71mi |
| 3707 N Riley Ave Indianapolis, IN | 3.0 | 1.5 | 2016 | $1,500 | $0.74 | 23d | 1 | 0.76mi |
| 3734 Manor Ct Indianapolis, IN | 3.0 | 1.0 | 1414 | $1,399 | $0.99 | 7d | 1 | 1.05mi |
| 4176 N Irwin Ave Indianapolis, IN | 4.0 | 2.0 | 2006 | $1,595 | $0.80 | 21d | 1 | 1.17mi |
| 5865 E 46th St Indianapolis, IN | 3.0 | 2.0 | 1400 | $1,500 | $1.07 | 43d | 1 | 1.20mi |
Listing history 6 events
-
2026-06-18days on market $114,900 Active 6 DOM
-
2026-06-17days on market $114,900 Active 5 DOM
-
2026-06-16days on market $114,900 Active 4 DOM
-
2026-06-15days on market $114,900 Active 3 DOM
-
2026-06-13remarks 611-char remark
-
2026-06-13$114,900 Active 1 DOM
ⓘ Source: listings_history table (triggers on properties + properties_extension) + one-shot
backfill from property_details.listing_events for pre-trigger history.
Tax reassessment forecast IN · Partial reset (capped growth)
- Current annual tax
- $1,887 · $157/mo
- Projected year-2 tax
- $1,887 · $157/mo
- Expected delta
- $0/yr ($0/mo · -0.0%)
ⓘ Screening estimate from a state-policy table — verify with the county assessor before closing.
Climate risk First Street
- Flood 1/10 Low FEMA zone X (unshaded) · 0% chance over 30 yrs
- Wildfire 1/10 Low
- Heat 3/10 Moderate 7 d/yr ≥101°F today · 18 d/yr by 30 yrs out
- Wind 2/10 Low 100% chance of damaging wind over 30 yrs
- Air quality 4/10 Moderate 5 unhealthy d/yr today · 7 by 30 yrs out
Nearby sold comps map
Loading sold comps map…
Walkable amenities ~0.75 mi
Loading nearby amenities…
Taxation est. · year 1
- Rental income
- $17,751
- − Mortgage interest
- −$6,436
- − Property taxes
- −$1,887
- − Insurance
- −$574
- − Repairs & maintenance
- −$1,420
- − Management
- −$1,420
- − Depreciation
- −$3,343
- Taxable income
- $2,670
- Est. tax owed @ 24.0%
- −$641
- After-tax cash flow
- $3,690/yr
For passive investors: Depreciation is non-cash, so a rental often shows a tax loss while cash-flowing — sheltering income. Rental losses are passive: they offset passive income freely, and up to $25,000/yr can offset ordinary (W-2) income if you actively participate and your MAGI is under $100k (phasing out to $0 by $150k); unused losses carry forward. On sale, claimed depreciation is recaptured at up to 25%, and gains may owe capital-gains tax (a 1031 exchange can defer both). Figures are a year-1 estimate at your 24.0% rate — not tax advice; consult a CPA.
Schools (NCES district)
- District
- Indianapolis Public Schools
- NCES district ID
- 1804770
- Math proficiency
- 14% ▼ -7.00%
- Reading proficiency
- 20% ▼ -3.00%
- Median HH income
- $32,034
- Composite
- 13.69/100
- National rank
- #9499
- State rank
- #286 of 301 in IN
Livability — Indianapolis city (balance)
No livability data for this city. (Only ~50 U.S. cities are tracked.)
Census & demographics
- Census place
- Indianapolis city (balance), IN
- County
- Marion County · 998,460 people
- City population
- 881,119
- Metro
- Indianapolis-Carmel-Anderson, IN
- Population (ZIP)
- 29,360
- Household income
- $38,063
- Rent vs Own
- Severe rent burden
- 2340.0
Population outlook (Marion County) Hauer SSP2
- Today (2025)
- 1,025,572 people
- By 2030
- 1,065,727 · +3.9%
- By 2040
- 1,141,577 · +11.3%
- By 2050
- 1,208,920 · +17.9%
- By 2075
- 1,367,288 · +33.3%
- By 2100
- 1,438,201 · +40.2%
Race, ethnicity, and origin ACS 2023
- Neighborhood character
- Predominantly Black (68%)
- Race & ethnicity
- Black 68% White 18% Hispanic / Latino 9% Two or more races 6%
- Hispanic origin (detail)
- Mexican 6%
- Common ancestry
- Romanian 1%
- Foreign-born
- 5% · Canada, Philippines
- Languages at home
- 92% English-only · Spanish 7%
Political lean MEDSL · Marion
- 2024 margin
- Strong D (+27.7) · D 63.0% · R 35.3% · Other 1.7%
- 2008→2024 swing
- -0.7pp no change · 2008: 28.4pp · 2024: 27.7pp
- All cycles
- 2024: D+27.7 2020: D+29.1 2016: D+22.8 2012: D+22.2 2008: D+28.4
Not yet ingested
- Civics
- —
Market trends
- HPI YoY
- ▼ -81.57%
- Current HPI
- 395.7071
- Rent YoY
- ▲ 0.81%
- Metro
- Indianapolis-Carmel-Anderson, IN
- State GDP YoY
- ▲ 2.90%
- F500 in state
- 18
Industry mix (Fortune 500 HQ in IN)
| Industry | F500 HQs | Revenue |
|---|---|---|
| Industrial Machinery | 2 | $37B |
|
||
| Healthcare | 1 | $177B |
|
||
| Pharmaceuticals | 1 | $45B |
|
||
| Metals / Steel | 1 | $18B |
|
||
| Agriculture | 1 | $17B |
|
||
| Packaging | 1 | $12B |
|
||
Price history
+139.9% since first listed5 events — show timeline
- 2026-06-12 Listed $114,900 MIBOR as Distributed by MLS Grid
- 2017-11-01 Sold (MLS) $40,000 MIBOR as Distributed by MLS Grid
- 2017-10-23 Pending — MIBOR as Distributed by MLS Grid
- 2017-10-22 Contingent — MIBOR as Distributed by MLS Grid
- 2017-10-22 Listed $47,900 MIBOR as Distributed by MLS Grid
Property tax history
+2.0%/yrLatest (2025): $1,887 · +13.8% YoY. Source: county tax records.
Cash-flow waterfall
monthlySold comps — $/sqft
last 12 mo · ≤1 miLoading sold comps…