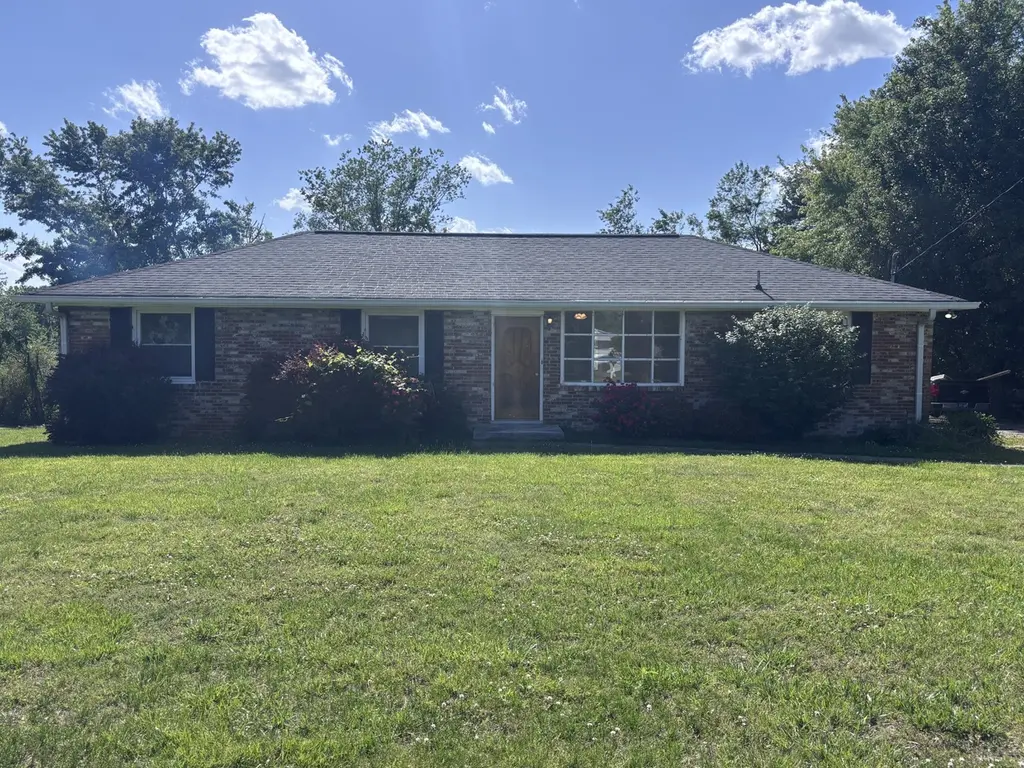
7107 Rusty Dr · Fairview, TN
Flood risk 1/10 · Minimal
- FEMA flood zone
- X (unshaded)
- Chance of flooding over 30 yrs
- 0.0%
- Est. flood insurance / yr
- $507 – $1,088
Fire risk 3/10 · Minor
- Est. fire insurance / yr
- $949 – $1,763
Heat risk 5/10 · Moderate
- Hot days now (above 107°F)
- 7 days/yr
- Hot days in 30 yrs
- 19 days/yr
Wind risk 4/10 · Minor
- Chance of severe wind over 30 yrs
- 11.0%
Air-quality risk 2/10 · Minimal
- Unhealthy air days now
- 1 days/yr
- Unhealthy air days in 30 yrs
- 1 days/yr
Risk factors via First Street. Map © Google.
Why this score? — see what drove the D+ grade
The composite is a weighted blend of 9 inputs, each scored 0–100. Each bar is that input's sub-score; the figure is the points it added to the 100-point composite (weight × sub-score).
- Cash flow +14.1/30.0
- ARV discount +11.7/15.0
- Schools +5.5/10.0
- DSCR +4.3/10.0
- Livability +3.6/5.0
- 1% rule +2.8/10.0
- Rent growth +2.5/5.0
- Condition / age +2.5/5.0
- Appreciation +0.0/10.0
$330,000
🖨 Deal sheet (PDF) 📄 Offer letter ✓ Due diligence
Listing remarks
4 bedroom 1 bathroom home Room to add a second bath 0.47 acres Freshly painted, brand new HVAC, and brand new stainless steel fridge. Built in 1965 Most affordable 4 beds in Fairview
Key facts
- 0.47 acres
- Brand new hvac
- 0.57 acre lot
Tags
Property features AI
Finance
- Other: Living area reported as 1,375 sq ft (owner provided); Lot size approximately 0.57 acres
- Financial info:
- HOA & community: Pets allowed
Exterior
- Parking: No covered parking reported; No parking total reported
- Security:
- Utilities: Public water; Public sewer; Water available
- Home design: Single-family residence; One story; Existing construction
- Construction: Brick construction; Slab foundation; Shingle roof
- Exterior features: Level lot; Lot dimensions approximately 112 x 184
Interior
- Kitchen: Range, Dishwasher, Microwave, Refrigerator
- Bedrooms: 4 bedrooms (all on the main level)
- Flooring: Wood flooring
- Bathrooms: 1 full bathroom
- Heating & cooling: Central heating; Central air conditioning
- Interior features: Range, Dishwasher, Microwave, Refrigerator; Wood flooring; No basement
- Laundry & utility:
Neighborhood map
What this means for you Summary
Snapshot
- This is a 4-bed/1.0-bath single-family listed at $330k.
Deal economics
- At list price, monthly cash flow is $46 ($550/yr) — positive.
- The deal already cash-flows at list — no discount required.
- To meet the 1% rule (rent ≥ 1% of price), the offer needs to be $257k (22.2% below list).
- Recommended offer: $257k (22.2% below list) — sets the bar for 1% rule.
- Cap rate 6.5% vs local median 1.6% in Fairview — top-decile yield for the area; either an underpriced asset or a hidden risk that comps aren't pricing in. Stress-test before assuming the spread holds.
Location & tenants
- Location reads 72/100 on livability (#31 in TN) — a middle-class / working-renter tenant base. Strengths: crime A+, housing A+, health & safety A; Watch: amenities F, commute F.
- Williamson County (rural): math 58% / reading 59% proficiency, ranked #1 of 139 in TN (top 1%) — acceptable for families but not a draw, mixed tenant base, ~2y average lease; only 9% free/reduced lunch — higher-income household profile.
- Zoned schools: Westwood Elementary School (math 57% / reading 51%, grade C, #95 of 952 statewide, top 10%, 533 students, 0% FRL); Fairview Middle School (math 33% / reading 34%, grade F, #73 of 333 statewide, top 23%, 530 students, 0% FRL); Fairview High School (math 12% / reading 37%, grade F, #129 of 332 statewide, top 43%, 719 students, 0% FRL).
- Zoned-school proficiency averages 37% at this address vs 58% district-wide (-21 pts) — the specific schools serving this property underperform the Williamson County average; the district grade overstates school quality for this exact location.
- Market conditions: 356 active listings in the ZIP; 4 comparable units currently listed for rent nearby; rentals lingering (median 46d on market — plan ~5-8 weeks vacancy on turnover, expect pricing pressure); 75% of comp listings sitting > 30 days — soft ceiling on asking rent; solid renter incomes; 1,994 units permitted in Williamson County in 2024 (637 in 5+ unit buildings).
- This rent runs 34% of the median local income ($92k/yr) — at the standard rent-burdened threshold; future hikes will face affordability resistance.
Forward outlook
- Local home prices are declining (-3.0%/yr); year-one equity from $2k of loan paydown is wiped out by about $10k of value loss. Plan a longer hold.
- Williamson County population projected at +59% by 2050 — long-run rental-demand tailwind backs the buy-and-hold thesis.
Negotiation context
- Only 6 days on market — expect competitive offers; lowballing is unlikely to land.
- Current owner paid $202k; list at $330k implies a 63% gain — meaningful room to come down on a strong offer.
Risks & watch-outs
- Climate carrying-cost: extreme-heat days projected 7→19/yr by 2055 (HVAC capex compounding) — expect insurance premiums to compound above CPI over the hold.
Questions for the listing agent
- Built in 1965 — when were the roof, HVAC, electrical panel, plumbing, and water heater last replaced?
- Is there a deadline driving the sale (1031 exchange, divorce, estate, relocation)? That informs how much negotiation room exists.
- Schools are D-rated, which usually means shorter tenancies and higher turnover. Who's the typical renter profile here, and what's been the actual vacancy rate?
- The area grade is low — what's the realistic commute time and amenity access for the typical tenant pool here? Any planned neighborhood developments (good or bad) we should know about?
- What's the average days-on-market for RENTAL listings here right now (not sales)? A rising rental-DOM trend means longer vacancies and softer asking-rent achievability than the comps imply.
- What's the recent tenant-quality profile in this submarket — average credit score on applications, eviction rate, late-payment / NSF rate, and stable-employment percentage? A property-management company in the area should have these aggregated.
- How much new for-sale + rental construction is in the pipeline within 1–3 miles? Heavy new supply typically softens prices + rents 12–24 months out; constrained supply supports both.
Investment metrics
- 1% rule
- 0.78% ✗
- Cap rate
- 6.46%
- Cash-on-cash
- 0.59%
- DSCR
- 1.03
- GRM
- 10.7
CMA / ARV
- ARV (on-the-fly)
- $364,375
- Comps found
- 6
Show comp detail 6 sales within ~0.75 mi
| Address | Dist | Beds/Ba | Sqft | Sold | Price | $/sf | Match |
|---|---|---|---|---|---|---|---|
| 7520 Scarborough Pl | 0.24mi | 3/2.5 (-1) | 1,416 (+3%) | 2mo | $375,000 | $265 | 71 |
| 7213 Old Nashville Rd | 0.26mi | 3/2.0 (-1) | 1,300 (-6%) | 19mo | $310,000 | $238 | 54 |
| 7518 Scarborough Pl | 0.24mi | 3/2.5 (-1) | 1,442 (+5%) | 22mo | $359,900 | $250 | 51 |
| 7320 Fernvale Rd | 0.39mi | 3/1.0 (-1) | 1,568 (+14%) | 4mo | $530,000 | $338 | 50 |
| 7111 Harrison Dr | 0.65mi | 3/1.5 (-1) | 1,200 (-13%) | 6mo | $425,000 | $354 | 36 |
| 7154 Mapleside Ln | 0.59mi | 3/2.5 (-1) | 1,558 (+13%) | 22mo | $353,000 | $227 | 21 |
Match score weights: distance 35% · size 25% · config 20% · recency 20%. Top-matched comps best support the ARV.
Projected returns pro-forma
-3.0% appreciation · 3.0% rent growth · sell at horizon
- IRR
- -15.4%
- Equity multiple
- 0.45×
- Total profit
- $-50,701
- Equity at exit
- $49,204
- IRR
- -7.0%
- Equity multiple
- 0.56×
- Total profit
- $-40,978
- Equity at exit
- $28,532
Cash invested: $92,400 (down + closing). Projections, not guarantees.
Landlord ↔ Tenant lean methodology
- Overall (STATE)
- 87 Strongly Landlord-Friendly
- State Tennessee
- 87 Strongly Landlord-Friendly · R+13
- County
- — inherits STATE
- City
- — inherits STATE
ZIP-level market 37062
- Home prices YoY
- -21.0%
- Active inventory
- 356
- Price-to-rent
- 10.7×
Monthly cashflow live
- Estimated rent
- $2,568 medium interval (Pro) →
- Mortgage (P&I)
- −$1,731
- Tax from tax record
- −$115 /mo · $1,377/yr
- Insurance
- −$138
- HOA
- −$0
- Vacancy / Maint / Mgmt
- −$539
- Net cashflow
- $46
Break-even live
Sensitivity live
| Price | -10% $233 | -5% $139 | +0% $46 | +5% $-48 | +10% $-141 |
|---|---|---|---|---|---|
| Rent | -10% $-157 | -5% $-56 | +0% $46 | +5% $147 | +10% $249 |
| Rate | -1.0pp $212 | -0.5pp $130 | base $46 | +0.5pp $-40 | +1.0pp $-127 |
UW: 25.0% down · 7.5% · 30yr · 1.5% tax · 5.0% vac · 8.0% maint · 8.0% mgmt
Financing live
Cash to close
- Down payment
- $82,500
- Closing costs
- $9,900
- Reserves months
- —
- Total cash needed
- —
Loan-product check · same deal, 3 products live
Conventional
25% down · 7.5% · 30yr
- Down + closing
- —
- Monthly P&I
- —
- Monthly cashflow
- —
- DSCR
- —
- Eligible?
- —
Personal DTI + credit; lowest rate.
DSCR
20% down · 8.5% · 30yr
- Down + closing
- —
- Monthly P&I
- —
- Monthly cashflow
- —
- DSCR
- —
- Eligible?
- —
No personal income docs; deal must DSCR.
Hard money
10% down · 12.0% · 12mo
- Down + closing
- —
- Monthly P&I
- —
- Monthly cashflow
- —
- DSCR
- —
- Eligible?
- —
Short-term bridge; refi at stabilization.
Rent comps 4 comps
| Address | Beds | Baths | Sqft | Rent | $/sqft | DOM | Units | Dist |
|---|---|---|---|---|---|---|---|---|
| 7133 Mapleside Ln Fairview, TN | 3.0 | 2.5 | 1558 | $2,100 | $1.35 | 45d | 1 | 0.52mi |
| 7124 Mapleside Ln Fairview, TN | 3.0 | 2.5 | 1558 | $2,300 | $1.48 | 45d | 1 | 0.54mi |
| 7100 Colquitt Way Fairview, TN | 3.0 | 2.5 | 1615 | $1,949 | $1.21 | 46d | 1 | 0.86mi |
| 7184 Chester Rd Fairview, TN | 3.0 | 2.0 | 1165 | $1,850 | $1.59 | 18d | 1 | 1.15mi |
Listing history 4 events
-
2026-06-09days on market $330,000 Active 6 DOM
-
2026-06-08days on market $330,000 Active 5 DOM
-
2026-06-07remarks 182-char remark
-
2026-06-07$330,000 Active 4 DOM
ⓘ Source: listings_history table (triggers on properties + properties_extension) + one-shot
backfill from property_details.listing_events for pre-trigger history.
Tax reassessment forecast TN · Resets to sale price
- Current annual tax
- $1,377 · $115/mo
- Projected year-2 tax
- $2,343 · $195/mo
- Expected delta
- +$966/yr (+$80/mo · 70.2%)
ⓘ Screening estimate from a state-policy table — verify with the county assessor before closing.
Climate risk First Street
- Flood 1/10 Low FEMA zone X (unshaded) · 0% chance over 30 yrs
- Wildfire 3/10 Moderate
- Heat 5/10 Major 7 d/yr ≥107°F today · 19 d/yr by 30 yrs out
- Wind 4/10 Moderate 11% chance of damaging wind over 30 yrs
- Air quality 2/10 Low 1 unhealthy d/yr today · 1 by 30 yrs out
Nearby sold comps map
Loading sold comps map…
Walkable amenities ~0.75 mi
Loading nearby amenities…
Taxation est. · year 1
- Rental income
- $30,814
- − Mortgage interest
- −$18,485
- − Property taxes
- −$1,377
- − Insurance
- −$1,650
- − Repairs & maintenance
- −$2,465
- − Management
- −$2,465
- − Depreciation
- −$9,600
- Taxable loss
- −$5,228
- Est. tax savings @ 24.0%
- +$1,255
- After-tax cash flow
- $1,804/yr
For passive investors: Depreciation is non-cash, so a rental often shows a tax loss while cash-flowing — sheltering income. Rental losses are passive: they offset passive income freely, and up to $25,000/yr can offset ordinary (W-2) income if you actively participate and your MAGI is under $100k (phasing out to $0 by $150k); unused losses carry forward. On sale, claimed depreciation is recaptured at up to 25%, and gains may owe capital-gains tax (a 1031 exchange can defer both). Figures are a year-1 estimate at your 24.0% rate — not tax advice; consult a CPA.
Schools (NCES district)
- District
- Williamson County
- NCES district ID
- 4704530
- Math proficiency
- 58% ▼ -13.00%
- Reading proficiency
- 59% ▼ -8.00%
- Median HH income
- $103,392
- Composite
- 54.94/100
- National rank
- #1307
- State rank
- #1 of 139 in TN
Livability — Fairview
- Score
- 72/100
- State rank
- #31
- US rank
- #5759
Category grades
Schools grade is shown separately in the Schools card above.
Census & demographics
- Census place
- Fairview, TN
- County
- Williamson County · 237,211 people
- City population
- 13,851
- Metro
- Nashville-Davidson--Murfreesboro--Franklin, TN
- Population (ZIP)
- 13,851
- Household income
- $91,750
- Rent vs Own
- Severe rent burden
- 179.0
Population outlook (Williamson County) Hauer SSP2
- Today (2025)
- 275,925 people
- By 2030
- 308,630 · +11.9%
- By 2040
- 374,403 · +35.7%
- By 2050
- 438,644 · +59.0%
- By 2075
- 592,763 · +114.8%
- By 2100
- 691,828 · +150.7%
Race, ethnicity, and origin ACS 2023
- Neighborhood character
- Predominantly White (88%)
- Race & ethnicity
- White 88% Hispanic / Latino 9% Two or more races 7%
- Hispanic origin (detail)
- Mexican 5% Cuban 2%
- Common ancestry
- Slovak 3% Serbian 2% Lithuanian 2%
- Foreign-born
- 3% · Canada, Jamaica
- Languages at home
- 95% English-only · Spanish 5%
Political lean MEDSL · Williamson
- 2024 margin
- Solid R (+32.4) · D 33.0% · R 65.4% · Other 1.7%
- 2008→2024 swing
- +7.1pp toward D · 2008: -39.5pp · 2024: -32.4pp
- All cycles
- 2024: R+32.4 2020: R+26.1 2016: R+35.5 2012: R+46.8 2008: R+39.5
Not yet ingested
- Civics
- —
Market trends
- HPI YoY
- ▼ -95.63%
- Current HPI
- 360.3455
- Rent YoY
- —
- Metro
- Nashville-Davidson--Murfreesboro--Franklin, TN
- State GDP YoY
- ▲ 2.78%
- F500 in state
- 22
Industry mix (Fortune 500 HQ in TN)
| Industry | F500 HQs | Revenue |
|---|---|---|
| Healthcare | 3 | $91B |
|
||
| Retail | 3 | $72B |
|
||
| Transportation / Logistics | 1 | $88B |
|
||
| Paper / Packaging | 1 | $19B |
|
||
| Insurance | 1 | $13B |
|
||
| Energy | 1 | $12B |
|
||
Price history
+63.4% since first listed2 events — show timeline
- 2026-06-03 Listed $330,000 REALTRACS as Distributed by MLS Grid
- 2026-03-26 Sold (Public Records) $202,000 Public Records
Property tax history
+4.0%/yrLatest (2025): $1,377 · +0.4% YoY. Source: county tax records.
Cash-flow waterfall
monthlySold comps — $/sqft
last 12 mo · ≤1 miLoading sold comps…