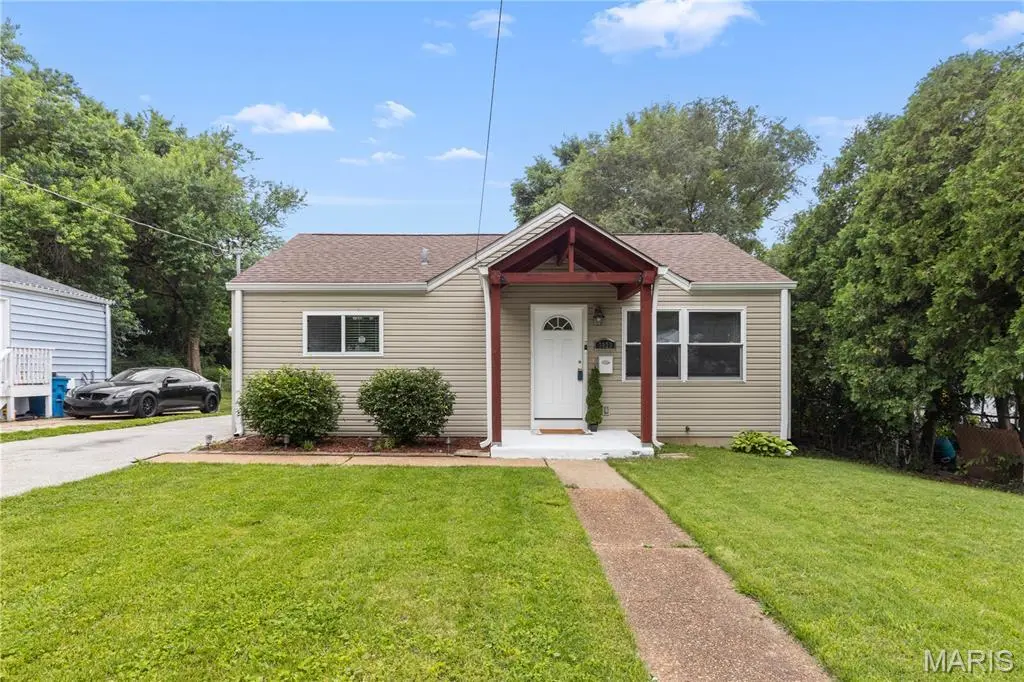
3023 Ridgeway Ave · St. John, MO
Flood risk 1/10 · Minimal
- FEMA flood zone
- X (unshaded)
- Chance of flooding over 30 yrs
- 0.0%
- Est. flood insurance / yr
- $473 – $860
Fire risk 1/10 · Minimal
- Est. fire insurance / yr
- $1,054 – $1,958
Heat risk 4/10 · Minor
- Hot days now (above 106°F)
- 7 days/yr
- Hot days in 30 yrs
- 21 days/yr
Wind risk 2/10 · Minimal
- Chance of severe wind over 30 yrs
- 1.0%
Air-quality risk 4/10 · Minor
- Unhealthy air days now
- 4 days/yr
- Unhealthy air days in 30 yrs
- 5 days/yr
Risk factors via First Street. Map © Google.
Why this score? — see what drove the D- grade
The composite is a weighted blend of 9 inputs, each scored 0–100. Each bar is that input's sub-score; the figure is the points it added to the 100-point composite (weight × sub-score).
- Cash flow +17.0/30.0
- DSCR +5.3/10.0
- 1% rule +4.1/10.0
- Rent growth +3.0/5.0
- Livability +2.5/5.0
- Condition / age +2.5/5.0
- Schools +1.7/10.0
- ARV discount +0.0/15.0
- Appreciation +0.0/10.0
$145,000
🖨 Deal sheet (PDF) 📄 Offer letter ✓ Due diligence
Listing remarks
Welcome to 3023 Ridgeway—a charming, thoughtfully refreshed 3-bedroom, 1-bath bungalow offering comfort, functionality, and exceptional value in the heart of St. John. From the moment you arrive, you’ll notice the home’s inviting presence, enhanced by a freshly power-washed exterior that reflects a sense of care and pride in ownership. Inside, natural light fills the space, highlighting beautiful hardwood flooring and creating a warm, welcoming atmosphere throughout. Designed with efficiency in mind, the layout flows seamlessly between the living area and kitchen—maximizing everyday comfort while making the most of every square foot. Each bedroom is well-proportioned
Key facts
- 7,579 sq ft lot
- Built 1956
- Listed 3 days
Property features AI
Finance
- Financial info: Lease not considered; Home warranty available; Seller may consider concessions
Exterior
- Parking: Driveway; On-street parking
- Utilities: Public water; Public sewer; Electricity connected (other electric service); Natural gas connected
- Home design: Single-family residence; One story; Private ownership
- Construction: Vinyl siding; Architectural shingle roof
- Exterior features: Front porch; Back yard fencing; Back yard lot feature; Asphalt road access; Sidewalks and street lights in the community
Interior
- Kitchen: Dishwasher; Microwave; Oven; Refrigerator; Gas water heater
- Bedrooms: 3 bedrooms (all on the main level)
- Bathrooms: 1 full bathroom (main level)
- Heating & cooling: Natural gas heating; Central air conditioning
- Interior features: Blinds on windows; Basement with walk-out access
- Laundry & utility: Laundry in basement
Neighborhood map
What this means for you Summary
Snapshot
- This is a 3-bed/1.0-bath single-family listed at $145k.
Deal economics
- At list price, monthly cash flow is $98 ($1k/yr) — positive.
- The deal already cash-flows at list — no discount required.
- To meet the 1% rule (rent ≥ 1% of price), the offer needs to be $131k (9.3% below list).
- Recommended offer: $131k (9.3% below list) — sets the bar for 1% rule.
Location & tenants
- Location reads: area grade D — affects rentability + tenant quality, not the cash-flow math above.
- Ritenour (suburban): math 13% / reading 27% proficiency, ranked #304 of 324 in MO (top 94%) — low school quality limits family demand, transient renter base, plan for 1-2y turnover; 66% free/reduced lunch — lower-income household profile, screen leases tightly.
- Zoned schools: Marvin Elem. (math 11% / reading 16%, grade F, #1,003 of 1,115 statewide, top 90%, 517 students, 99% FRL); Ritenour Middle (math 15% / reading 28%, grade F, #339 of 391 statewide, top 87%, 467 students, 99% FRL); Ritenour Sr. High (math 9% / reading 36%, grade F, #455 of 521 statewide, top 88%, 1,873 students, 100% FRL) — zoned schools average 100% FRL vs 66% district-wide (34 pts higher); higher-poverty schools than district average — tighter screening recommended.
- Market conditions: Rents rising (+2.0%/yr); 120 active listings in the ZIP; 13 comparable units currently listed for rent nearby; rentals lingering (median 46d on market — plan ~5-8 weeks vacancy on turnover, expect pricing pressure); 54% of comp listings sitting > 30 days — soft ceiling on asking rent; 920 units permitted in St. Louis County in 2024 (250 in 5+ unit buildings).
Forward outlook
- Local home prices are declining (-3.0%/yr); year-one equity from $1k of loan paydown is wiped out by about $4k of value loss. Plan a longer hold.
Negotiation context
- Only 3 days on market — expect competitive offers; lowballing is unlikely to land.
- Current owner paid $55k; list at $145k implies a 164% gain — meaningful room to come down on a strong offer.
Risks & watch-outs
- Watch-outs: built in 1956 — expect roof / HVAC / electrical / plumbing capex.
Questions for the listing agent
- Built in 1956 — when were the roof, HVAC, electrical panel, plumbing, and water heater last replaced?
- Is there a deadline driving the sale (1031 exchange, divorce, estate, relocation)? That informs how much negotiation room exists.
- The area grade is low — what's the realistic commute time and amenity access for the typical tenant pool here? Any planned neighborhood developments (good or bad) we should know about?
- What's the average days-on-market for RENTAL listings here right now (not sales)? A rising rental-DOM trend means longer vacancies and softer asking-rent achievability than the comps imply.
- What's the recent tenant-quality profile in this submarket — average credit score on applications, eviction rate, late-payment / NSF rate, and stable-employment percentage? A property-management company in the area should have these aggregated.
- How much new for-sale + rental construction is in the pipeline within 1–3 miles? Heavy new supply typically softens prices + rents 12–24 months out; constrained supply supports both.
Investment metrics
- 1% rule
- 0.91% ✗
- Cap rate
- 7.10%
- Cash-on-cash
- 2.89%
- DSCR
- 1.13
- GRM
- 9.2
CMA / ARV
- ARV (on-the-fly)
- $117,216
- Comps found
- 12
Show comp detail 12 sales within ~0.75 mi
| Address | Dist | Beds/Ba | Sqft | Sold | Price | $/sf | Match |
|---|---|---|---|---|---|---|---|
| 8417 Betty Lee Ave | 0.11mi | 2/1.0 (-1) | 792 (0%) | 3mo | $154,000 | $194 | 88 |
| 3415 Ginger Dr | 0.10mi | 2/1.0 (-1) | 792 (0%) | 5mo | $117,000 | $148 | 86 |
| 8710 Ezra Dr | 0.32mi | 2/1.5 (-1) | 791 (-0%) | 2mo | $119,900 | $152 | 76 |
| 8591 Ardelia Ave | 0.26mi | 2/1.0 (-1) | 792 (0%) | 10mo | $165,000 | $208 | 74 |
| 8614 Hume Ave | 0.33mi | 2/1.0 (-1) | 720 (-9%) | 9mo | $57,500 | $80 | 57 |
| 3630 Brown Rd Rear | 0.66mi | 2/1.0 (-1) | 816 (+3%) | 2mo | $44,900 | $55 | 57 |
| 8626 Engler Ave | 0.46mi | 2/2.0 (-1) | 828 (+4%) | 8mo | $145,000 | $175 | 55 |
| 2835 Walton Rd | 0.31mi | 2/1.0 (-1) | 891 (+12%) | 6mo | $168,000 | $189 | 55 |
| 2840 Ridgeway Ave | 0.34mi | 2/1.0 (-1) | 882 (+11%) | 9mo | $109,900 | $125 | 52 |
| 8540 Leith Ave | 0.70mi | 2/1.0 (-1) | 816 (+3%) | 8mo | $119,900 | $147 | 51 |
| 8815 Kendale Dr | 0.68mi | 2/1.0 (-1) | 850 (+7%) | 4mo | $85,000 | $100 | 48 |
| 8907 Argyle Ave | 0.75mi | 2/1.0 (-1) | 899 (+14%) | 6mo | $129,900 | $144 | 33 |
Match score weights: distance 35% · size 25% · config 20% · recency 20%. Top-matched comps best support the ARV.
Projected returns pro-forma
-3.0% appreciation · 2.04% rent growth · sell at horizon
- IRR
- -12.8%
- Equity multiple
- 0.54×
- Total profit
- $-18,549
- Equity at exit
- $21,620
- IRR
- -5.2%
- Equity multiple
- 0.67×
- Total profit
- $-13,275
- Equity at exit
- $12,537
Cash invested: $40,600 (down + closing). Projections, not guarantees.
Landlord ↔ Tenant lean methodology
- Overall (STATE)
- 81 Strongly Landlord-Friendly
- State Missouri
- 81 Strongly Landlord-Friendly · R+10
- County
- — inherits STATE
- City
- — inherits STATE
ZIP-level market 63114
- Rents YoY
- 2.0%
- Active inventory
- 120
- Price-to-rent
- 9.2×
Monthly cashflow live
- Estimated rent
- $1,315 high interval (Pro) →
- Mortgage (P&I)
- −$760
- Tax from tax record
- −$120 /mo · $1,440/yr
- Insurance
- −$60
- HOA
- −$0
- Vacancy / Maint / Mgmt
- −$276
- Net cashflow
- $98
Break-even live
Sensitivity live
| Price | -10% $180 | -5% $139 | +0% $98 | +5% $57 | +10% $16 |
|---|---|---|---|---|---|
| Rent | -10% $-6 | -5% $46 | +0% $98 | +5% $150 | +10% $202 |
| Rate | -1.0pp $171 | -0.5pp $135 | base $98 | +0.5pp $60 | +1.0pp $22 |
UW: 25.0% down · 7.5% · 30yr · 1.5% tax · 5.0% vac · 8.0% maint · 8.0% mgmt
Financing live
Cash to close
- Down payment
- $36,250
- Closing costs
- $4,350
- Reserves months
- —
- Total cash needed
- —
Loan-product check · same deal, 3 products live
Conventional
25% down · 7.5% · 30yr
- Down + closing
- —
- Monthly P&I
- —
- Monthly cashflow
- —
- DSCR
- —
- Eligible?
- —
Personal DTI + credit; lowest rate.
DSCR
20% down · 8.5% · 30yr
- Down + closing
- —
- Monthly P&I
- —
- Monthly cashflow
- —
- DSCR
- —
- Eligible?
- —
No personal income docs; deal must DSCR.
Hard money
10% down · 12.0% · 12mo
- Down + closing
- —
- Monthly P&I
- —
- Monthly cashflow
- —
- DSCR
- —
- Eligible?
- —
Short-term bridge; refi at stabilization.
Rent comps 13 comps
| Address | Beds | Baths | Sqft | Rent | $/sqft | DOM | Units | Dist |
|---|---|---|---|---|---|---|---|---|
| 8819 McNulty Dr Saint Louis, MO | 2.0 | 1.0 | 752 | $1,225 | $1.63 | 45d | 1 | 0.69mi |
| 9316 Koenig Cir Berkeley, MO | 2.0 | 1.0 | 720 | $1,150 | $1.60 | 0d | 4 | 0.84mi |
| 2452 Ashland Ave Saint Louis, MO | 2.0 | 1.0 | 1028 | $1,350 | $1.31 | 45d | 1 | 0.87mi |
| 9310 Shirley Gardens Dr Apt C St. Louis, MO | 2.0 | 1.0 | 800 | $1,200 | $1.50 | 45d | 1 | 1.16mi |
| 9310 Shirley Gardens Dr Apt B St. Louis, MO | 2.0 | 1.0 | 800 | $1,100 | $1.38 | 45d | 1 | 1.16mi |
| 9183 Harold Dr Saint Louis, MO | 3.0 | 1.0 | 912 | $1,200 | $1.32 | 45d | 1 | 1.16mi |
| 9429 Baltimore Ave Saint Louis, MO | 2.0 | 1.0 | 900 | $1,200 | $1.33 | 0d | 1 | 1.23mi |
| 9429 Baltimore Ave Saint Louis, MO | 2.0 | 1.0 | 900 | $1,200 | $1.33 | 25d | 1 | 1.23mi |
| 3208 Dix Ave Saint Louis, MO | 2.0 | 1.0 | 656 | $1,215 | $1.85 | 0d | 1 | 1.29mi |
| 3209 Dix Ave Saint Louis, MO | 3.0 | 1.0 | 1122 | $1,550 | $1.38 | 25d | 1 | 1.31mi |
| 2732 Annapolis Ave Saint Louis, MO | 2.0 | 1.0 | 768 | $1,250 | $1.63 | 45d | 1 | 1.40mi |
| 9535 Baltimore Ave Saint Louis, MO | 2.0 | 1.0 | 800 | $1,145 | $1.43 | 25d | 1 | 1.42mi |
| 3648 Edmundson Rd Unit 1 St. Louis, MO | 2.0 | 1.0 | 900 | $995 | $1.11 | 45d | 1 | 1.46mi |
Listing history 13 events
-
2026-05-31status $145,000 Pending 3 DOM
-
2026-05-31days on market $145,000 Active 3 DOM
-
2026-05-29$145,000 Active
-
2026-05-27historical $145,000
-
2017-05-08soldstatus $55,000
-
2013-02-07soldstatus $565,000
-
2010-06-22soldstatus $195,000
-
2010-06-22soldstatus $290,000
-
2008-01-09soldstatus $57,000
-
1990-10-01soldstatus $41,750
-
1990-08-01soldstatus
-
1990-08-01soldstatus $29,300
-
1989-01-01soldstatus $21,500
ⓘ Source: listings_history table (triggers on properties + properties_extension) + one-shot
backfill from property_details.listing_events for pre-trigger history.
Tax reassessment forecast MO · Resets to sale price
- Current annual tax
- $1,440 · $120/mo
- Projected year-2 tax
- $1,440 · $120/mo
- Expected delta
- $0/yr ($0/mo · 0.0%)
ⓘ Screening estimate from a state-policy table — verify with the county assessor before closing.
Climate risk First Street
- Flood 1/10 Low FEMA zone X (unshaded) · 0% chance over 30 yrs
- Wildfire 1/10 Low
- Heat 4/10 Moderate 7 d/yr ≥106°F today · 21 d/yr by 30 yrs out
- Wind 2/10 Low 100% chance of damaging wind over 30 yrs
- Air quality 4/10 Moderate 4 unhealthy d/yr today · 5 by 30 yrs out
Nearby sold comps map
Loading sold comps map…
Walkable amenities ~0.75 mi
Loading nearby amenities…
Taxation est. · year 1
- Rental income
- $15,775
- − Mortgage interest
- −$8,122
- − Property taxes
- −$1,440
- − Insurance
- −$725
- − Repairs & maintenance
- −$1,262
- − Management
- −$1,262
- − Depreciation
- −$4,218
- Taxable loss
- −$1,255
- Est. tax savings @ 24.0%
- +$301
- After-tax cash flow
- $1,473/yr
For passive investors: Depreciation is non-cash, so a rental often shows a tax loss while cash-flowing — sheltering income. Rental losses are passive: they offset passive income freely, and up to $25,000/yr can offset ordinary (W-2) income if you actively participate and your MAGI is under $100k (phasing out to $0 by $150k); unused losses carry forward. On sale, claimed depreciation is recaptured at up to 25%, and gains may owe capital-gains tax (a 1031 exchange can defer both). Figures are a year-1 estimate at your 24.0% rate — not tax advice; consult a CPA.
Schools (NCES district)
- District
- Ritenour
- NCES district ID
- 2926640
- Math proficiency
- 13% ▼ -14.00%
- Reading proficiency
- 27% ▼ -7.00%
- Median HH income
- $41,410
- Composite
- 17.04/100
- National rank
- #9125
- State rank
- #304 of 324 in MO
Livability — St. John
No livability data for this city. (Only ~50 U.S. cities are tracked.)
Census & demographics
- Census place
- St. John, MO
- County
- Saint Louis County · 888,823 people
- Metro
- St. Louis, MO-IL
- Population (ZIP)
- 33,969
- Household income
- $55,870
- Rent vs Own
- Severe rent burden
- 1595.0
Population outlook (St. Louis County) Hauer SSP2
- Today (2025)
- 1,025,227 people
- By 2030
- 1,028,023 · +0.3%
- By 2040
- 1,020,940 · -0.4%
- By 2050
- 1,007,280 · -1.8%
- By 2075
- 987,277 · -3.7%
- By 2100
- 921,984 · -10.1%
Race, ethnicity, and origin ACS 2023
- Neighborhood character
- Diverse neighborhood (Simpson 0.64)
- Race & ethnicity
- White 50% Black 30% Hispanic / Latino 11% Two or more races 6% Asian 2%
- Hispanic origin (detail)
- Mexican 7%
- Common ancestry
- Lithuanian 3% Italian 2% Romanian 1%
- Foreign-born
- 9% · Canada, Vietnam
- Languages at home
- 84% English-only · Spanish 10% French/Haitian/Cajun 2% Tagalog/Filipino 1%
Political lean MEDSL · St. Louis
- 2024 margin
- Strong D (+23.4) · D 60.8% · R 37.4% · Other 1.7%
- 2008→2024 swing
- +3.5pp toward D · 2008: 19.9pp · 2024: 23.4pp
- All cycles
- 2024: D+23.4 2020: D+24.0 2016: D+16.2 2012: D+13.7 2008: D+19.9
Not yet ingested
- Civics
- —
Market trends
- HPI YoY
- ▼ -276.62%
- Current HPI
- 223.9305
- Rent YoY
- ▲ 2.04%
- Metro
- St. Louis, MO-IL
- State GDP YoY
- ▲ 1.84%
- F500 in state
- 20
Industry mix (Fortune 500 HQ in MO)
| Industry | F500 HQs | Revenue |
|---|---|---|
| Healthcare | 1 | $163B |
|
||
| Insurance | 1 | $21B |
|
||
| Industrial Technology | 1 | $17B |
|
||
| Retail | 1 | $16B |
|
||
| Industrial Distribution | 1 | $10B |
|
||
| Utilities | 1 | $9B |
|
||
Price history
+574.4% since first listed11 events — show timeline
- 2026-05-29 Listed $145,000 MARIS as Distributed by MLS Grid
- 2026-05-27 Coming Soon $145,000 MARIS as Distributed by MLS Grid
- 2017-05-08 Sold (Public Records) $55,000 Public Records
- 2013-02-07 Sold (Public Records) $565,000 Public Records
- 2010-06-22 Sold (Public Records) $290,000 Public Records
- 2010-06-22 Sold (Public Records) $195,000 Public Records
- 2008-01-09 Sold (Public Records) $57,000 Public Records
- 1990-10-01 Sold (Public Records) $41,750 Public Records
- 1990-08-01 Sold (Public Records) $29,300 Public Records
- 1990-08-01 Sold (Public Records) — Public Records
- 1989-01-01 Sold (Public Records) $21,500 Public Records
Property tax history
+4.0%/yrLatest (2022): $1,440 · +0.0% YoY. Source: county tax records.
Cash-flow waterfall
monthlySold comps — $/sqft
last 12 mo · ≤1 miLoading sold comps…