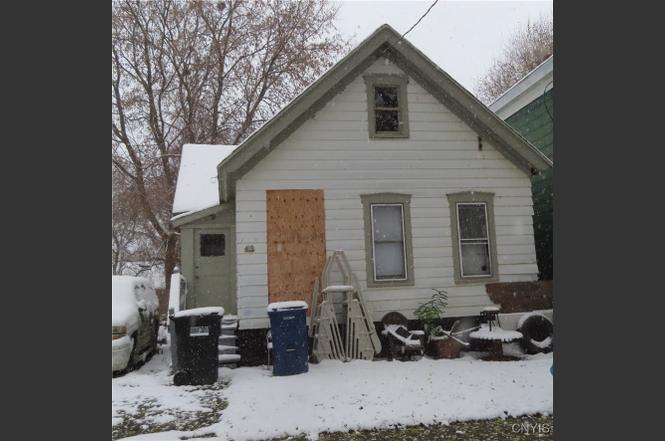
419 Rich St · Syracuse, NY
Flood risk 9/10 · Severe
- FEMA flood zone
- AE
- Chance of flooding over 30 yrs
- 0.99%
- Est. flood insurance / yr
- $2,026 – $9,024
Fire risk 1/10 · Minimal
- Est. fire insurance / yr
- $691 – $1,283
Heat risk 3/10 · Minor
- Hot days now (above 95°F)
- 7 days/yr
- Hot days in 30 yrs
- 16 days/yr
Wind risk 1/10 · Minimal
- Chance of severe wind over 30 yrs
- 1.0%
Air-quality risk 2/10 · Minimal
- Unhealthy air days now
- 0 days/yr
- Unhealthy air days in 30 yrs
- 1 days/yr
Risk factors via First Street. Map © Google.
Why this score? — see what drove the C+ grade
The composite is a weighted blend of 9 inputs, each scored 0–100. Each bar is that input's sub-score; the figure is the points it added to the 100-point composite (weight × sub-score).
- Cash flow +30.0/30.0
- 1% rule +10.0/10.0
- DSCR +10.0/10.0
- Livability +3.9/5.0
- Rent growth +2.5/5.0
- Condition / age +2.5/5.0
- Schools +1.8/10.0
- ARV discount +0.0/15.0
- Appreciation +0.0/10.0
$45,000
🖨 Deal sheet 📄 Offer letter ✓ Due diligence
Listing remarks
Looking for fixer uppers, flippers and contractors that can restore this home to its glorious shape. This home has been in the same family for the last 52 years and it will need some tender loving care. Motivated seller and let's make a deal!
Key facts
- 4,059 sq ft lot
- Built 1900
- Listed 145 days
Neighborhood map
What this means for you Summary
Snapshot
- This is a 2-bed/1.0-bath single-family listed at $45k.
Deal economics
- At list price, monthly cash flow is $683 ($8k/yr) — positive.
- The deal already cash-flows at list — no discount required.
- Meets the 1% rule at list price ($2k rent vs $45k).
- Recommended offer: $40k (12.0% below list) — sets the bar for market timing.
- Cap rate 36.8% vs local median 8.2% in Syracuse — top-decile yield for the area; either an underpriced asset or a hidden risk that comps aren't pricing in. Stress-test before assuming the spread holds.
Location & tenants
- Location reads 77/100 on livability (#187 in NY, #2,869 nationally) — a middle-class / working-renter tenant base. Strengths: amenities A+, commute A+, cost of living A+; Watch: schools D+, crime F, employment D-.
- Syracuse City School District (urban): math 18% / reading 26% proficiency, ranked #590 of 590 in NY (top 100%) — low school quality limits family demand, transient renter base, plan for 1-2y turnover; 74% free/reduced lunch — lower-income household profile, screen leases tightly.
- Market conditions: 63 active listings in the ZIP; 27 comparable units currently listed for rent nearby; rentals at typical pace (median 21d on market — plan ~3-4 weeks tenant-placement turnaround); 616 units permitted in Onondaga County in 2024 (256 in 5+ unit buildings).
Forward outlook
- Local home prices are declining (-3.0%/yr); year-one equity from $311 of loan paydown is wiped out by about $1k of value loss. Plan a longer hold.
- Onondaga County population projected to shrink 9% by 2050 — rents likely to lag national; underwrite the cash flow, not the appreciation.
- At projected returns (-3.0% appreciation + 3.0% rent growth), your $13k cash investment doubles in ~2 years — after that, you're playing with house money.
Negotiation context
- It's been on market 145 days — a 12% lower offer ($40k) is reasonable based on typical stale-listing flexibility.
- 2 sale attempts with the ask held roughly flat each time — persistent listings suggest the price (not the market) is what's stuck; bring a comps-based counter.
Risks & watch-outs
- Watch-outs: flood insurance adds $460/mo; built in 1900 — expect roof / HVAC / electrical / plumbing capex.
- Climate carrying-cost: in FEMA flood zone AE (mandatory federal flood insurance) — expect insurance premiums to compound above CPI over the hold.
Questions for the listing agent
- It's been on market 145 days. Have you received any prior offers? Is the seller open to a 12% concession, seller financing, or rate buy-down credit?
- Built in 1900 — when were the roof, HVAC, electrical panel, plumbing, and water heater last replaced?
- What's the actual annual flood-insurance premium (NFIP or private), and is the property in a SFHA with mandatory coverage?
- Why hasn't it sold? Are there any deal-killer items the seller is aware of (foundation, flood, title, zoning, code violations)?
- Is there a deadline driving the sale (1031 exchange, divorce, estate, relocation)? That informs how much negotiation room exists.
- Schools are D-rated, which usually means shorter tenancies and higher turnover. Who's the typical renter profile here, and what's been the actual vacancy rate?
- Crime grade is F in this area — have there been break-ins, vandalism, or insurance claims at this property in the last 3 years? What carrier currently insures it and at what premium?
- What's the average days-on-market for RENTAL listings here right now (not sales)? A rising rental-DOM trend means longer vacancies and softer asking-rent achievability than the comps imply.
- What's the recent tenant-quality profile in this submarket — average credit score on applications, eviction rate, late-payment / NSF rate, and stable-employment percentage? A property-management company in the area should have these aggregated.
- How much new for-sale + rental construction is in the pipeline within 1–3 miles? Heavy new supply typically softens prices + rents 12–24 months out; constrained supply supports both.
Investment metrics
- 1% rule
- 4.09% ✓
- Cap rate
- 36.79%
- Cash-on-cash
- 108.91%
- DSCR
- 5.85
- GRM
- 2.0
CMA / ARV
- ARV (on-the-fly)
- $36,960
- Comps found
- 3
Show comp detail 3 sales within ~0.75 mi
| Address | Dist | Beds/Ba | Sqft | Sold | Price | $/sf | Match |
|---|---|---|---|---|---|---|---|
| 228 Putnam St | 0.64mi | 3/1.5 (+1) | 868 (+3%) | 14mo | $55,000 | $63 | 46 |
| 162 Clyde Ave | 0.69mi | 1/1.0 (-1) | 784 (-7%) | 16mo | $32,000 | $41 | 38 |
| 327 Shonnard St #29 | 0.71mi | 2/1.0 | 912 (+9%) | 23mo | $40,000 | $44 | 34 |
Match score weights: distance 35% · size 25% · config 20% · recency 20%. Top-matched comps best support the ARV.
Projected returns pro-forma
-3.0% appreciation · 3.0% rent growth · sell at horizon
- IRR
- 64.5%
- Equity multiple
- 3.90×
- Total profit
- $36,530
- Equity at exit
- $6,710
- IRR
- 69.0%
- Equity multiple
- 8.07×
- Total profit
- $89,101
- Equity at exit
- $3,891
Cash invested: $12,600 (down + closing). Projections, not guarantees.
Landlord ↔ Tenant lean methodology
- Overall (STATE)
- 15 Strongly Tenant-Friendly
- State New York
- 15 Strongly Tenant-Friendly · D+10
- County
- — inherits STATE
- City
- — inherits STATE
ZIP-level market 13207
- Home prices YoY
- -23.0%
- Active inventory
- 63
- Price-to-rent
- 2.0×
Monthly cashflow live
- Estimated rent
- $1,842 high interval (Pro) →
- Mortgage (P&I)
- −$236
- Tax from tax record
- −$57 /mo · $682/yr
- Insurance
- −$19
- Flood insurance flood zone
- −$460 /mo · $5,525/yr
- HOA
- −$0
- Vacancy / Maint / Mgmt
- −$387
- Net cashflow
- $683
Break-even live
UW: 25.0% down · 7.5% · 30yr · 1.5% tax · 5.0% vac · 8.0% maint · 8.0% mgmt
Financing live
Cash to close
- Down payment
- $11,250
- Closing costs
- $1,350
- Reserves months
- —
- Total cash needed
- —
Loan-product check · same deal, 3 products live
Conventional
25% down · 7.5% · 30yr
- Down + closing
- —
- Monthly P&I
- —
- Monthly cashflow
- —
- DSCR
- —
- Eligible?
- —
Personal DTI + credit; lowest rate.
DSCR
20% down · 8.5% · 30yr
- Down + closing
- —
- Monthly P&I
- —
- Monthly cashflow
- —
- DSCR
- —
- Eligible?
- —
No personal income docs; deal must DSCR.
Hard money
10% down · 12.0% · 12mo
- Down + closing
- —
- Monthly P&I
- —
- Monthly cashflow
- —
- DSCR
- —
- Eligible?
- —
Short-term bridge; refi at stabilization.
Rent comps 27 comps
| Address | Beds | Baths | Sqft | Rent | $/sqft | DOM | Units | Dist |
|---|---|---|---|---|---|---|---|---|
| 122 Putnam St Syracuse, NY | 3.0 | 1.0 | 1064 | $2,050 | $1.93 | 21d | 1 | 0.48mi |
| 409 Stolp Ave Syracuse, NY | 1.0–3.0 | 1.0 | 849 | $1,262 | $1.49 | 13d | 5 | 0.51mi |
| 508-10 W Brighton Ave Syracuse, NY | 2.0 | 1.0 | 735 | $1,350 | $1.84 | 13d | 13 | 0.84mi |
| 472 S Salina St Syracuse, NY | 1.0–2.0 | 1.0 | 1022 | $2,095 | $2.05 | 13d | 3 | 1.07mi |
| 111 E Onondaga St Syracuse, NY | 1.0–2.0 | 1.0–2.0 | 1150 | $3,000 | $2.61 | 21d | 5 | 1.08mi |
| 108 W Jefferson St #706 Syracuse, NY | 1.0 | 1.0 | 959 | $1,850 | $1.93 | 43d | 1 | 1.20mi |
| 1741 W Onondaga St Syracuse, NY | 1.0–2.0 | 1.0–2.0 | 800 | $1,250 | $1.56 | 13d | 3 | 1.21mi |
| 2859 S Salina St Unit 2 Syracuse, NY | 2.0 | 1.0 | 1000 | $1,200 | $1.20 | 43d | 1 | 1.22mi |
| 120 Walton St Syracuse, NY | 1.0–2.0 | 1.0–2.0 | 825 | $3,200 | $3.88 | 43d | 2 | 1.23mi |
| 110 Walton St Unit 303 Syracuse, NY | 1.0 | 1.0 | 725 | $1,700 | $2.34 | 43d | 1 | 1.23mi |
| 110 Walton St Unit 301 Syracuse, NY | 2.0 | 2.0 | 1051 | $2,000 | $1.90 | 21d | 1 | 1.23mi |
| 110 Walton St Unit 201 Syracuse, NY | 2.0 | 2.0 | 1051 | $2,200 | $2.09 | 43d | 1 | 1.23mi |
| 110 Walton St Unit 203 Syracuse, NY | 1.0 | 1.0 | 701 | $1,600 | $2.28 | 21d | 1 | 1.23mi |
| 205 E Jefferson St Unit 2B Syracuse, NY | 2.0 | 2.5 | 1100 | $2,200 | $2.00 | 21d | 1 | 1.24mi |
| 201 E Jefferson St Syracuse, NY | 2.0 | 1.0 | 662 | $1,626 | $2.45 | 13d | 9 | 1.24mi |
| 317 S Clinton St Unit 3C/B3 Syracuse, NY | 1.0 | 1.0 | 700 | $1,675 | $2.39 | 13d | 1 | 1.25mi |
| 321 S Salina St Unit 502 Syracuse, NY | 1.0 | 1.0 | 1050 | $2,500 | $2.38 | 43d | 1 | 1.26mi |
| 321 S Salina St Unit 402 Syracuse, NY | 1.0 | 1.0 | 1050 | $2,200 | $2.10 | 13d | 1 | 1.26mi |
| 321 S Salina St Unit 303 Syracuse, NY | 1.0 | 1.0 | 978 | $1,800 | $1.84 | 43d | 1 | 1.26mi |
| 321 S Salina St Unit 403 Syracuse, NY | 1.0 | 1.0 | 978 | $1,750 | $1.79 | 21d | 1 | 1.27mi |
| 129 W Fayette St Unit 217 Syracuse, NY | 2.0 | 2.0 | 1100 | $1,550 | $1.41 | 13d | 1 | 1.27mi |
| 538 Erie Blvd W Syracuse, NY | 2.0 | 2.0 | 1110 | $2,100 | $1.89 | 21d | 1 | 1.30mi |
| 324 W Water St Syracuse, NY | 2.0 | 1.0 | 1007 | $1,975 | $1.96 | 13d | 6 | 1.36mi |
| 60 Presidential Plz Syracuse, NY | 1.0–2.0 | 1.0–1.5 | 970 | $1,315 | $1.36 | 43d | 1 | 1.38mi |
| 101 S Salina St Syracuse, NY | 2.0 | 1.0 | 651 | $2,871 | $4.41 | 13d | 14 | 1.39mi |
| 208 W Water St Syracuse, NY | 2.0 | 2.0 | 962 | $1,800 | $1.87 | 43d | 1 | 1.40mi |
| 105 Smith Ln Syracuse, NY | 1.0–2.0 | 1.0 | 518 | $1,450 | $2.80 | 13d | 23 | 1.45mi |
Listing history 4 events
-
2026-04-06status Pending
-
2026-03-06status Active
-
2026-02-12historical Active Under Contract
-
2025-11-12$45,000 Active
ⓘ Source: listings_history table (triggers on properties + properties_extension) + one-shot
backfill from property_details.listing_events for pre-trigger history.
Tax reassessment forecast NY · Partial reset (capped growth)
- Current annual tax
- $682 · $57/mo
- Projected year-2 tax
- $721 · $60/mo
- Expected delta
- +$39/yr (+$3/mo · 5.8%)
ⓘ Screening estimate from a state-policy table — verify with the county assessor before closing.
Climate risk First Street
- Flood 9/10 Extreme FEMA zone AE · 99% chance over 30 yrs
- Wildfire 1/10 Low
- Heat 3/10 Moderate 7 d/yr ≥95°F today · 16 d/yr by 30 yrs out
- Wind 1/10 Low 100% chance of damaging wind over 30 yrs
- Air quality 2/10 Low 0 unhealthy d/yr today · 1 by 30 yrs out
Nearby sold comps map
Loading sold comps map…
Walkable amenities ~0.75 mi
Loading nearby amenities…
Taxation est. · year 1
- Rental income
- $22,103
- − Mortgage interest
- −$2,521
- − Property taxes
- −$682
- − Insurance
- −$5,750
- − Repairs & maintenance
- −$1,768
- − Management
- −$1,768
- − Depreciation
- −$1,309
- Taxable income
- $8,305
- Est. tax owed @ 24.0%
- −$1,993
- After-tax cash flow
- $6,205/yr
For passive investors: Depreciation is non-cash, so a rental often shows a tax loss while cash-flowing — sheltering income. Rental losses are passive: they offset passive income freely, and up to $25,000/yr can offset ordinary (W-2) income if you actively participate and your MAGI is under $100k (phasing out to $0 by $150k); unused losses carry forward. On sale, claimed depreciation is recaptured at up to 25%, and gains may owe capital-gains tax (a 1031 exchange can defer both). Figures are a year-1 estimate at your 24.0% rate — not tax advice; consult a CPA.
Schools (NCES district)
- District
- Syracuse City School District
- NCES district ID
- 3628590
- Math proficiency
- 18% ▼ -5.00%
- Reading proficiency
- 26% ▬ 0.00%
- Median HH income
- $32,097
- Composite
- 17.83/100
- National rank
- #9007
- State rank
- #590 of 590 in NY
Livability — Syracuse
- Score
- 77/100
- State rank
- #187
- US rank
- #2869
Category grades
Schools grade is shown separately in the Schools card above.
Census & demographics
- Census place
- Syracuse, NY
- City population
- 152,627
- Population (ZIP)
- 12,383
Population outlook (Onondaga County) Hauer SSP2
- Today (2025)
- 467,894 people
- By 2030
- 463,381 · -1.0%
- By 2040
- 447,697 · -4.3%
- By 2050
- 426,399 · -8.9%
- By 2075
- 373,661 · -20.1%
- By 2100
- 307,967 · -34.2%
Race, ethnicity, and origin ACS 2023
- Neighborhood character
- Diverse neighborhood (Simpson 0.68)
- Race & ethnicity
- White 43% Black 33% Hispanic / Latino 17% Two or more races 11% Native American 1% Asian 1%
- Hispanic origin (detail)
- Puerto Rican 13% Cuban 1%
- Common ancestry
- Romanian 3% Lithuanian 1% Slovak 1%
- Foreign-born
- 4% · Canada, South Korea
- Languages at home
- 89% English-only · Spanish 9% French/Haitian/Cajun 1%
Political lean MEDSL · Onondaga
- 2024 margin
- D (+17.3) · D 58.6% · R 41.4%
- 2008→2024 swing
- -3.0pp toward R · 2008: 20.3pp · 2024: 17.3pp
- All cycles
- 2024: D+17.3 2020: D+20.6 2016: D+12.8 2012: D+21.1 2008: D+20.3
Not yet ingested
- Civics
- —
Market trends
- HPI YoY
- ▼ -95.17%
- Current HPI
- 318.9257
- Rent YoY
- —
- Metro
- —
- State GDP YoY
- ▲ 2.60%
- F500 in state
- 92
Industry mix (Fortune 500 HQ in NY)
| Industry | F500 HQs | Revenue |
|---|---|---|
| Financial Services | 10 | $950B |
|
||
| Consumer Goods | 9 | $162B |
|
||
| Insurance | 4 | $225B |
|
||
| Telecommunications | 2 | $144B |
|
||
| Pharmaceuticals | 2 | $112B |
|
||
| Media / Entertainment | 2 | $69B |
|
||
Price history
4 events — show timeline
- 2026-04-06 Pending — CNYIS
- 2026-03-06 Relisted — CNYIS
- 2026-02-12 Contingent — CNYIS
- 2025-11-12 Listed $45,000 CNYIS
Property tax history
+0.1%/yrLatest (2025): $682 · +0.0% YoY. Source: county tax records.
Cash-flow waterfall
monthlySold comps — $/sqft
last 12 mo · ≤1 miLoading sold comps…