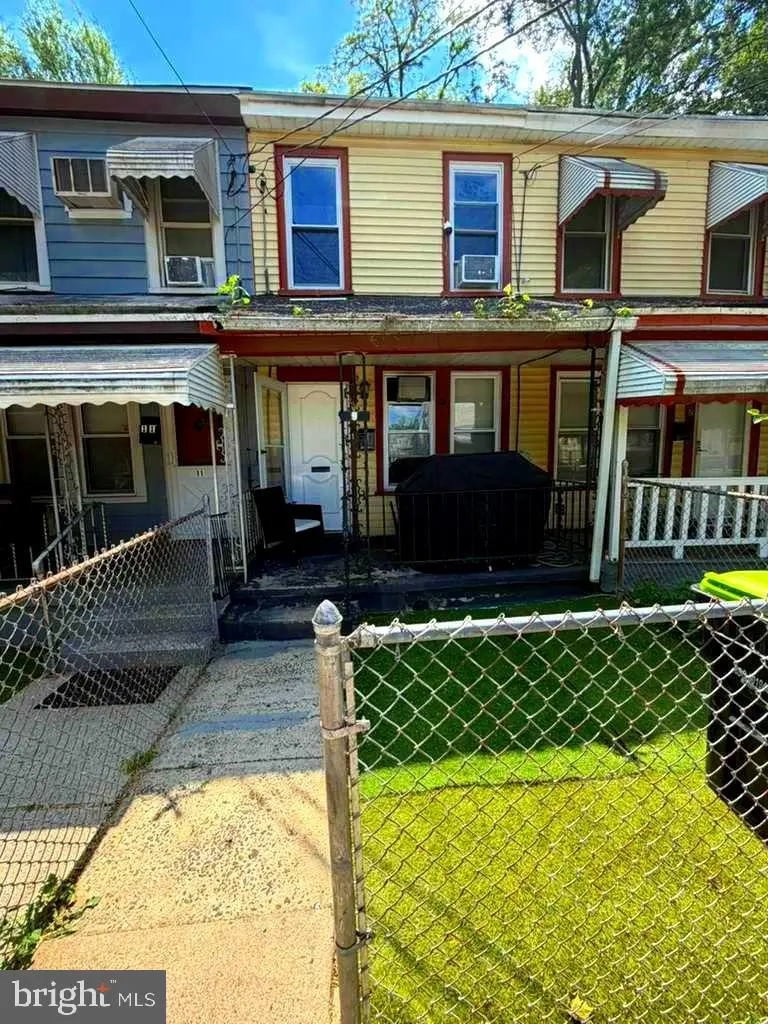
9 Race St · Trenton, NJ
Flood risk 1/10 · Minimal
- FEMA flood zone
- X (unshaded)
- Chance of flooding over 30 yrs
- 0.0%
- Est. flood insurance / yr
- $507 – $1,088
Fire risk 1/10 · Minimal
- Est. fire insurance / yr
- $526 – $976
Heat risk 6/10 · Moderate
- Hot days now (above 101°F)
- 7 days/yr
- Hot days in 30 yrs
- 15 days/yr
Wind risk 6/10 · Moderate
- Chance of severe wind over 30 yrs
- 27.0%
Air-quality risk 5/10 · Moderate
- Unhealthy air days now
- 6 days/yr
- Unhealthy air days in 30 yrs
- 8 days/yr
Risk factors via First Street. Map © Google.
Why this score? — see what drove the D grade
The composite is a weighted blend of 9 inputs, each scored 0–100. Each bar is that input's sub-score; the figure is the points it added to the 100-point composite (weight × sub-score).
- Cash flow +21.5/30.0
- DSCR +6.9/10.0
- 1% rule +4.8/10.0
- Livability +3.8/5.0
- Rent growth +3.3/5.0
- Condition / age +2.5/5.0
- Schools +0.7/10.0
- ARV discount +0.0/15.0
- Appreciation +0.0/10.0
$187,000
🖨 Deal sheet (PDF) 📄 Offer letter ✓ Due diligence
Listing remarks
Great investment opportunity! This tenant-occupied property is currently rented for $1,568/month and offers strong rental potential for investors looking to expand their portfolio. The home features a functional layout with comfortable living space and convenient access to local amenities, transportation, and major roadways. Showings will only be granted with proof of funds. Photos are subject to change and may vary due to tenant furniture, personal belongings, and current occupancy. Buyer to perform their own due diligence.
Key facts
- Built 1925
- Listed 21 days
Property features AI
Exterior
- Parking: Driveway
- Utilities: Public water; Public sewer
- Home design: End of row/townhouse; Fee simple ownership
- Construction: Frame construction; Block foundation; Above grade and below grade structures; Finished above-grade area (per assessor)
- Exterior features: 12 x 97 lot dimensions; No tidal water
Interior
- Kitchen: Kitchen (appliances not specified)
- Bedrooms: Two bedrooms on the first upper level
- Bathrooms: One full bathroom
- Heating & cooling: Forced air heating (natural gas); Electric-powered cooling (other type)
- Interior features: Unfinished basement; Living Room; Kitchen
- Laundry & utility: Hot water: Natural gas
Neighborhood map
What this means for you Summary
Snapshot
- This is a 2-bed/1.0-bath townhouse listed at $187k.
Deal economics
- At list price, monthly cash flow is $281 ($3k/yr) — positive.
- The deal already cash-flows at list — no discount required.
- To meet the 1% rule (rent ≥ 1% of price), the offer needs to be $184k (1.5% below list).
- Recommended offer: $184k (1.5% below list) — sets the bar for 1% rule.
- Cap rate 8.1% vs local median 6.0% in Trenton — top-decile yield for the area; either an underpriced asset or a hidden risk that comps aren't pricing in. Stress-test before assuming the spread holds.
Location & tenants
- Location reads 76/100 on livability (#133 in NJ, #3,533 nationally) — a middle-class / working-renter tenant base. Strengths: amenities A+, commute A+, health & safety A+; Watch: schools F, crime F, employment F.
- Trenton Public School District (urban): math 2% / reading 16% proficiency, ranked #471 of 472 in NJ (top 100%) — low school quality limits family demand, transient renter base, plan for 1-2y turnover; 80% free/reduced lunch — lower-income household profile, screen leases tightly.
- Market conditions: Rents rising (+3.3%/yr); 83 active listings in the ZIP; 31 comparable units currently listed for rent nearby; rentals at typical pace (median 22d on market — plan ~3-4 weeks tenant-placement turnaround); 2,256 units permitted in Mercer County in 2024 (1,303 in 5+ unit buildings).
- This rent runs 33% of the median local income ($67k/yr) — at the standard rent-burdened threshold; future hikes will face affordability resistance.
Forward outlook
- Local home prices are declining (-3.0%/yr); year-one equity from $1k of loan paydown is wiped out by about $6k of value loss. Plan a longer hold.
- Mercer County population projected at +4% by 2050 — modest demand growth; plan on rents tracking national, not racing it.
Negotiation context
- It's been on market 21 days — a 2% lower offer ($184k) is reasonable based on typical stale-listing flexibility.
- Current owner paid $53k; list at $187k implies a 253% gain — meaningful room to come down on a strong offer.
Risks & watch-outs
- Watch-outs: built in 1925 — expect roof / HVAC / electrical / plumbing capex.
- Climate carrying-cost: major wind risk, 27% chance of damaging wind over 30y; extreme-heat days projected 7→15/yr by 2055 (HVAC capex compounding) — expect insurance premiums to compound above CPI over the hold.
Questions for the listing agent
- Built in 1925 — when were the roof, HVAC, electrical panel, plumbing, and water heater last replaced?
- Is there a deadline driving the sale (1031 exchange, divorce, estate, relocation)? That informs how much negotiation room exists.
- Schools are F-rated, which usually means shorter tenancies and higher turnover. Who's the typical renter profile here, and what's been the actual vacancy rate?
- Crime grade is F in this area — have there been break-ins, vandalism, or insurance claims at this property in the last 3 years? What carrier currently insures it and at what premium?
- The area grade is low — what's the realistic commute time and amenity access for the typical tenant pool here? Any planned neighborhood developments (good or bad) we should know about?
- What's the average days-on-market for RENTAL listings here right now (not sales)? A rising rental-DOM trend means longer vacancies and softer asking-rent achievability than the comps imply.
- What's the recent tenant-quality profile in this submarket — average credit score on applications, eviction rate, late-payment / NSF rate, and stable-employment percentage? A property-management company in the area should have these aggregated.
- How much new for-sale + rental construction is in the pipeline within 1–3 miles? Heavy new supply typically softens prices + rents 12–24 months out; constrained supply supports both.
Investment metrics
- 1% rule
- 0.98% ✗
- Cap rate
- 8.09%
- Cash-on-cash
- 6.43%
- DSCR
- 1.29
- GRM
- 8.5
CMA / ARV
- ARV (on-the-fly)
- $131,865
- Comps found
- 12
Show comp detail 12 sales within ~0.75 mi
| Address | Dist | Beds/Ba | Sqft | Sold | Price | $/sf | Match |
|---|---|---|---|---|---|---|---|
| 51 Vine St | 0.06mi | 2/1.0 | 978 (+10%) | 7mo | $105,000 | $107 | 74 |
| 167 Kirkbride Ave | 0.23mi | 2/1.0 | 846 (-4%) | 11mo | $155,000 | $183 | 72 |
| 63 Chase St | 0.10mi | 2/1.0 | 816 (-8%) | 14mo | $122,750 | $150 | 70 |
| 38 Vine St | 0.07mi | 3/1.0 (+1) | 956 (+8%) | 11mo | $54,000 | $56 | 69 |
| 4 Lansing Aly | 0.15mi | 2/1.0 | 784 (-11%) | 8mo | $40,000 | $51 | 67 |
| 123 Vine St | 0.16mi | 3/2.0 (+1) | 980 (+11%) | 2mo | $199,000 | $203 | 64 |
| 33 Kirkbride Ave | 0.12mi | 2/1.0 | 972 (+10%) | 17mo | $144,750 | $149 | 64 |
| 1452 N Olden Ave | 0.57mi | 2/1.0 | 882 (-0%) | 18mo | $207,000 | $235 | 58 |
| 229 New Trent | 0.38mi | 2/1.0 | 990 (+12%) | 11mo | $200,000 | $202 | 53 |
| 89 Pashley Ave | 0.70mi | 2/1.0 | 888 (+0%) | 16mo | $122,000 | $137 | 53 |
| 29 Poplar St | 0.60mi | 3/1.0 (+1) | 938 (+6%) | 7mo | $68,000 | $72 | 51 |
| 828 Ohio Ave | 0.72mi | 2/1.0 | 762 (-14%) | 21mo | $110,000 | $144 | 26 |
Match score weights: distance 35% · size 25% · config 20% · recency 20%. Top-matched comps best support the ARV.
Projected returns pro-forma
-3.0% appreciation · 3.31% rent growth · sell at horizon
- IRR
- -6.1%
- Equity multiple
- 0.77×
- Total profit
- $-11,903
- Equity at exit
- $27,882
- IRR
- 3.9%
- Equity multiple
- 1.28×
- Total profit
- $14,840
- Equity at exit
- $16,168
Cash invested: $52,360 (down + closing). Projections, not guarantees.
Landlord ↔ Tenant lean methodology
- Overall (STATE)
- 21 Tenant-Leaning
- State New Jersey
- 21 Tenant-Leaning · D+6
- County
- — inherits STATE
- City
- — inherits STATE
ZIP-level market 08638
- Rents YoY
- 3.3%
- Active inventory
- 83
- Price-to-rent
- 8.5×
Monthly cashflow live
- Estimated rent
- $1,842 high interval (Pro) →
- Mortgage (P&I)
- −$981
- Tax from tax record
- −$116 /mo · $1,390/yr
- Insurance
- −$78
- HOA
- −$0
- Vacancy / Maint / Mgmt
- −$387
- Net cashflow
- $281
Break-even live
Sensitivity live
| Price | -10% $386 | -5% $333 | +0% $281 | +5% $228 | +10% $175 |
|---|---|---|---|---|---|
| Rent | -10% $135 | -5% $208 | +0% $281 | +5% $353 | +10% $426 |
| Rate | -1.0pp $375 | -0.5pp $328 | base $281 | +0.5pp $232 | +1.0pp $183 |
UW: 25.0% down · 7.5% · 30yr · 1.5% tax · 5.0% vac · 8.0% maint · 8.0% mgmt
Financing live
Cash to close
- Down payment
- $46,750
- Closing costs
- $5,610
- Reserves months
- —
- Total cash needed
- —
Loan-product check · same deal, 3 products live
Conventional
25% down · 7.5% · 30yr
- Down + closing
- —
- Monthly P&I
- —
- Monthly cashflow
- —
- DSCR
- —
- Eligible?
- —
Personal DTI + credit; lowest rate.
DSCR
20% down · 8.5% · 30yr
- Down + closing
- —
- Monthly P&I
- —
- Monthly cashflow
- —
- DSCR
- —
- Eligible?
- —
No personal income docs; deal must DSCR.
Hard money
10% down · 12.0% · 12mo
- Down + closing
- —
- Monthly P&I
- —
- Monthly cashflow
- —
- DSCR
- —
- Eligible?
- —
Short-term bridge; refi at stabilization.
Rent comps 31 comps
| Address | Beds | Baths | Sqft | Rent | $/sqft | DOM | Units | Dist |
|---|---|---|---|---|---|---|---|---|
| 77 Race St Trenton, NJ | 2.0 | 1.0 | 950 | $1,700 | $1.79 | 22d | 1 | 0.06mi |
| 901 Brunswick Ave #7 Trenton, NJ | 3.0 | 1.0 | 940 | $2,800 | $2.98 | 14d | 1 | 0.60mi |
| 125 Olive St Trenton, NJ | 2.0–3.0 | 1.0–1.5 | 896 | $1,220 | $1.36 | 22d | 1 | 0.71mi |
| 1100 Prospect St Unit 1 Ewing Township, NJ | 3.0 | 1.0 | 1100 | $2,000 | $1.82 | 22d | 1 | 0.72mi |
| 12 Belvidere St Trenton, NJ | 1.0 | 1.0 | 1068 | $1,600 | $1.50 | 22d | 1 | 0.81mi |
| 202 E Hanover St Unit 5G Trenton, NJ | 2.0 | 1.0 | 750 | $1,200 | $1.60 | 22d | 1 | 0.82mi |
| 216 E State St Trenton, NJ | 1.0–2.0 | 1.0 | 811 | $1,895 | $2.34 | 14d | 2 | 0.86mi |
| 150 E State St Trenton, NJ | 1.0 | 1.0 | 627 | $1,750 | $2.79 | 22d | 1 | 0.88mi |
| 27 Passaic St Trenton, NJ | 2.0 | 1.0 | 900 | $1,700 | $1.89 | 22d | 1 | 0.98mi |
| 417 Walnut Ave Trenton, NJ | 3.0 | 1.0 | 992 | $2,050 | $2.07 | 22d | 1 | 1.06mi |
| 1163 E State St Unit 9 Trenton, NJ | 2.0 | 1.0 | 775 | $1,770 | $2.28 | 22d | 1 | 1.06mi |
| 1165 E State St Trenton, NJ | 3.0 | 1.0 | 900 | $1,749 | $1.94 | 14d | 1 | 1.06mi |
| 416 Klagg Ave Trenton, NJ | 3.0 | 1.0 | 1034 | $2,300 | $2.22 | 22d | 1 | 1.07mi |
| 339 Tioga St #339 Trenton, NJ | 2.0 | 1.0 | 864 | $1,850 | $2.14 | 22d | 1 | 1.09mi |
| 307 Spring St Unit 3 Trenton, NJ | 2.0 | 1.0 | 559 | $1,800 | $3.22 | 14d | 1 | 1.09mi |
| 307 Spring St Unit 2 Trenton, NJ | 2.0 | 1.0 | 689 | $1,750 | $2.54 | 14d | 1 | 1.09mi |
| 186 Passaic St Trenton, NJ | 3.0 | 2.0 | 1064 | $2,400 | $2.26 | 5d | 1 | 1.09mi |
| 1001 Pennington Rd Unit 1-2B Ewing Township, NJ | 2.0 | 1.0 | 700 | $1,200 | $1.71 | 22d | 1 | 1.12mi |
| 329 W State St Trenton, NJ | 1.0 | 1.0 | 650 | $1,500 | $2.31 | 22d | 1 | 1.18mi |
| 720 Monmouth St Unit 111 Trenton, NJ | 1.0 | 1.0 | 1102 | $1,500 | $1.36 | 22d | 1 | 1.25mi |
| 720 Monmouth St Unit 103 Trenton, NJ | 1.0 | 1.0 | 832 | $1,450 | $1.74 | 22d | 1 | 1.25mi |
| 720 Monmouth St Unit 204 Trenton, NJ | 2.0 | 1.0 | 1011 | $1,750 | $1.73 | 22d | 1 | 1.26mi |
| 435 Tyler St Unit 123 Trenton, NJ | 1.0 | 1.0 | 607 | $1,475 | $2.43 | 22d | 1 | 1.26mi |
| 435 Tyler St Apt 203 Trenton, NJ | 1.0 | 1.0 | 662 | $1,500 | $2.27 | 22d | 1 | 1.26mi |
| 435 Tyler St Unit 115 Trenton, NJ | 1.0 | 1.0 | 860 | $1,600 | $1.86 | 22d | 1 | 1.26mi |
| 71 Clark St Trenton, NJ | 1.0–2.0 | 1.0–2.0 | 975 | $2,350 | $2.41 | 14d | 4 | 1.44mi |
| 702 Meadow Woods Ln Lawrence Township, NJ | 1.0 | 1.0 | 800 | $1,745 | $2.18 | 22d | 1 | 1.45mi |
| 907 Meadow Woods Ln Unit TYPE Lawrence Township, NJ | 1.0 | 1.0 | 800 | $1,600 | $2.00 | 22d | 1 | 1.47mi |
| 114 Washington Ct Hamilton Township, NJ | 1.0 | 1.0 | 560 | $1,475 | $2.63 | 22d | 3 | 1.48mi |
| 732 W State St Fl back Trenton, NJ | 1.0 | 1.0 | 600 | $1,150 | $1.92 | 22d | 1 | 1.48mi |
| 121 Columbus Ave Trenton, NJ | 3.0 | 1.0 | 1050 | $1,900 | $1.81 | 22d | 1 | 1.49mi |
Listing history 17 events
-
2026-06-18days on market $187,000 Active 21 DOM
-
2026-06-17days on market $187,000 Active 20 DOM
-
2026-06-16days on market $187,000 Active 19 DOM
-
2026-06-15days on market $187,000 Active 18 DOM
-
2026-06-14days on market $187,000 Active 16 DOM
-
2026-06-10days on market $187,000 Active 13 DOM
-
2026-06-09days on market $187,000 Active 12 DOM
-
2026-06-08days on market $187,000 Active 11 DOM
-
2026-06-07days on market $187,000 Active 10 DOM
-
2026-06-03days on market $187,000 Active 6 DOM
-
2026-06-02days on market $187,000 Active 5 DOM
-
2026-06-01days on market $187,000 Active 4 DOM
-
2026-05-31days on market $187,000 Active 3 DOM
-
2026-05-30days on market $187,000 Active 2 DOM
-
2026-05-28$187,000 Active
-
2022-03-24soldstatus $53,000
-
1979-12-01soldstatus $12,500
ⓘ Source: listings_history table (triggers on properties + properties_extension) + one-shot
backfill from property_details.listing_events for pre-trigger history.
Tax reassessment forecast NJ · Partial reset (capped growth)
- Current annual tax
- $1,390 · $116/mo
- Projected year-2 tax
- $3,023 · $252/mo
- Expected delta
- +$1,633/yr (+$136/mo · 117.5%)
ⓘ Screening estimate from a state-policy table — verify with the county assessor before closing.
Climate risk First Street
- Flood 1/10 Low FEMA zone X (unshaded) · 0% chance over 30 yrs
- Wildfire 1/10 Low
- Heat 6/10 Major 7 d/yr ≥101°F today · 15 d/yr by 30 yrs out
- Wind 6/10 Major 27% chance of damaging wind over 30 yrs
- Air quality 5/10 Major 6 unhealthy d/yr today · 8 by 30 yrs out
Nearby sold comps map
Loading sold comps map…
Walkable amenities ~0.75 mi
Loading nearby amenities…
Taxation est. · year 1
- Rental income
- $22,100
- − Mortgage interest
- −$10,475
- − Property taxes
- −$1,390
- − Insurance
- −$935
- − Repairs & maintenance
- −$1,768
- − Management
- −$1,768
- − Depreciation
- −$5,440
- Taxable income
- $324
- Est. tax owed @ 24.0%
- −$78
- After-tax cash flow
- $3,289/yr
For passive investors: Depreciation is non-cash, so a rental often shows a tax loss while cash-flowing — sheltering income. Rental losses are passive: they offset passive income freely, and up to $25,000/yr can offset ordinary (W-2) income if you actively participate and your MAGI is under $100k (phasing out to $0 by $150k); unused losses carry forward. On sale, claimed depreciation is recaptured at up to 25%, and gains may owe capital-gains tax (a 1031 exchange can defer both). Figures are a year-1 estimate at your 24.0% rate — not tax advice; consult a CPA.
Schools (NCES district)
- District
- Trenton Public School District
- NCES district ID
- 3416290
- Math proficiency
- 2% ▼ -8.00%
- Reading proficiency
- 16% ▼ -4.00%
- Median HH income
- $35,078
- Composite
- 7.31/100
- National rank
- #9956
- State rank
- #471 of 472 in NJ
Livability — Trenton
- Score
- 76/100
- State rank
- #133
- US rank
- #3533
Category grades
Schools grade is shown separately in the Schools card above.
Census & demographics
- Census place
- Trenton, NJ
- County
- Mercer County · 327,655 people
- City population
- 177,819
- Metro
- Trenton-Princeton, NJ
- Population (ZIP)
- 22,816
- Household income
- $66,875
- Rent vs Own
- Severe rent burden
- 1185.0
Population outlook (Mercer County) Hauer SSP2
- Today (2025)
- 381,395 people
- By 2030
- 384,640 · +0.9%
- By 2040
- 391,431 · +2.6%
- By 2050
- 397,845 · +4.3%
- By 2075
- 417,281 · +9.4%
- By 2100
- 420,327 · +10.2%
Race, ethnicity, and origin ACS 2023
- Neighborhood character
- Diverse neighborhood (Simpson 0.68)
- Race & ethnicity
- Black 43% White 31% Hispanic / Latino 21% Two or more races 8% Asian 2%
- Hispanic origin (detail)
- Mexican 2% Puerto Rican 6% Dominican 3%
- Common ancestry
- Romanian 4% Hispanic 2% Iranian 1%
- Foreign-born
- 24% · Canada, Guatemala, China
- Languages at home
- 76% English-only · Spanish 17% Russian/Polish/Slavic 2% Other Indo-European 2%
Political lean MEDSL · Mercer
- 2024 margin
- Solid D (+33.9) · D 65.9% · R 32.0% · Other 2.1%
- 2008→2024 swing
- -2.2pp toward R · 2008: 36.1pp · 2024: 33.9pp
- All cycles
- 2024: D+33.9 2020: D+40.0 2016: D+36.2 2012: D+36.8 2008: D+36.1
Not yet ingested
- Civics
- —
Market trends
- HPI YoY
- ▼ -286.00%
- Current HPI
- 334.5143
- Rent YoY
- ▲ 3.31%
- Metro
- Trenton-Princeton, NJ
- State GDP YoY
- ▲ 2.05%
- F500 in state
- 34
Industry mix (Fortune 500 HQ in NJ)
| Industry | F500 HQs | Revenue |
|---|---|---|
| Consumer Goods | 3 | $31B |
|
||
| Pharmaceuticals | 2 | $153B |
|
||
| Technology | 2 | $21B |
|
||
| Insurance | 2 | $20B |
|
||
| Healthcare | 2 | $19B |
|
||
| Financial Services | 1 | $70B |
|
||
Price history
+1396.0% since first listed3 events — show timeline
- 2026-05-28 Listed $187,000 BRIGHT MLS
- 2022-03-24 Sold (Public Records) $53,000 Public Records
- 1979-12-01 Sold (Public Records) $12,500 Public Records
Property tax history
+1.7%/yrLatest (2025): $1,390 · +1.5% YoY. Source: county tax records.
Cash-flow waterfall
monthlySold comps — $/sqft
last 12 mo · ≤1 miLoading sold comps…