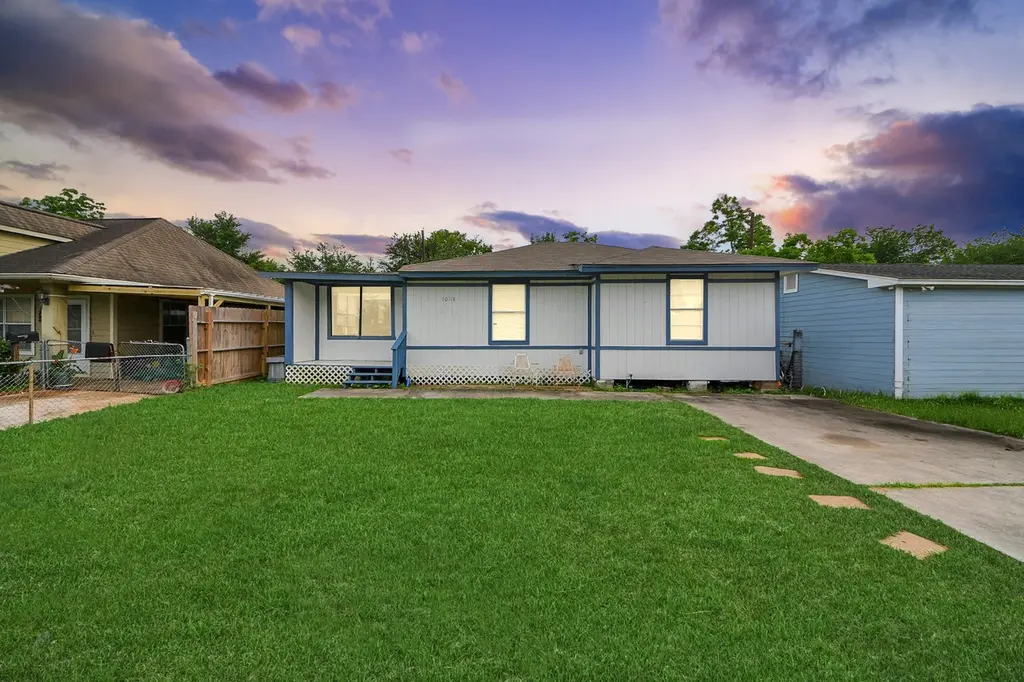
10118 Norvic St · Jacinto City, TX
Flood risk 1/10 · Minimal
- FEMA flood zone
- X (unshaded)
- Chance of flooding over 30 yrs
- 0.0%
- Est. flood insurance / yr
- $507 – $1,088
Fire risk 4/10 · Minor
- Est. fire insurance / yr
- $1,222 – $2,270
Heat risk 9/10 · Severe
- Hot days now (above 109°F)
- 7 days/yr
- Hot days in 30 yrs
- 23 days/yr
Wind risk 9/10 · Severe
- Chance of severe wind over 30 yrs
- 99.0%
Air-quality risk 3/10 · Minor
- Unhealthy air days now
- 2 days/yr
- Unhealthy air days in 30 yrs
- 3 days/yr
Risk factors via First Street. Map © Google.
Why this score? — see what drove the B+ grade
The composite is a weighted blend of 9 inputs, each scored 0–100. Each bar is that input's sub-score; the figure is the points it added to the 100-point composite (weight × sub-score).
- Cash flow +24.1/30.0
- ARV discount +15.0/15.0
- Appreciation +10.0/10.0
- DSCR +7.8/10.0
- 1% rule +7.2/10.0
- Livability +3.5/5.0
- Schools +2.8/10.0
- Rent growth +2.5/5.0
- Condition / age +2.5/5.0
$160,000
🖨 Deal sheet 📄 Offer letter ✓ Due diligence
Key facts
- 5,248 sq ft lot
- Built 1950
- Listed 26 days
Property features AI
Exterior
- Utilities: Public water; Public sewer
- Home design: Residential property; Single-story (all main rooms listed on first floor)
- Construction: Brick construction; Built in 1950
- Exterior features: Located in a subdivision
Interior
- Bedrooms: Primary bedroom on the first floor; Three additional bedrooms on the first floor
- Bathrooms: 2 full bathrooms
- Heating & cooling: Central heating (electric); Central air conditioning (electric)
- Interior features: Total of 4 rooms
Neighborhood map
What this means for you Summary
Snapshot
- This is a 5-bed/1.0-bath single-family listed at $160k.
Deal economics
- At list price, monthly cash flow is $315 ($4k/yr) — positive.
- The deal already cash-flows at list — no discount required.
- Meets the 1% rule at list price ($2k rent vs $160k).
- Recommended offer: $158k (1.5% below list) — sets the bar for market timing.
Location & tenants
- Location reads 70/100 on livability (#384 in TX) — a middle-class / working-renter tenant base. Strengths: cost of living A+, housing A+, health & safety A-; Watch: amenities F, commute F, employment F.
- Galena Park ISD (suburban): math 32% / reading 33% proficiency, ranked #578 of 826 in TX (top 70%) — families likely to look elsewhere, expect single-tenant / working-renter base with shorter leases; 74% free/reduced lunch — lower-income household profile, screen leases tightly.
- Zoned schools: Jacinto City El (math 31% / reading 32%, grade F, #2,396 of 4,322 statewide, top 56%, 714 students, 89% FRL); Galena Park Middle (math 28% / reading 31%, grade F, #1,077 of 1,662 statewide, top 66%, 943 students, 88% FRL); Galena Park H S (math 37% / reading 36%, grade F, #924 of 1,632 statewide, top 57%, 1,914 students, 87% FRL).
- Market conditions: 153 active listings in the ZIP; 29,883 units permitted in Harris County in 2024 (8,621 in 5+ unit buildings).
- At $1,954/mo this rent would consume 49% of the median local household income ($48k/yr) (locally 457% of renters already pay >50% of income on rent) — very limited rent-growth headroom before tenants either downsize or default.
Forward outlook
- In year one you build about $17k of equity ($1k loan paydown + $16k appreciation (10.0% local appreciation)).
- Harris County population projected at +47% by 2050 — long-run rental-demand tailwind backs the buy-and-hold thesis.
- At projected returns (10.0% appreciation + 3.0% rent growth), your $45k cash investment doubles in ~3 years — after that, you're playing with house money.
- By year 3, paydown + projected appreciation supports a ~$43k cash-out refi (75% LTV) — recoverable capital for the next deal without selling this one.
Negotiation context
- It's been on market 26 days — a 2% lower offer ($158k) is reasonable based on typical stale-listing flexibility.
- 7 sale attempts since 18y ago; this cycle's ask has dropped $30k (16%) from the opening price — seller is motivated, your offer sets the floor, not the list.
Risks & watch-outs
- Watch-outs: built in 1950 — expect roof / HVAC / electrical / plumbing capex.
- Climate carrying-cost: severe wind risk, 99% chance of damaging wind over 30y; extreme-heat days projected 7→23/yr by 2055 (HVAC capex compounding) — expect insurance premiums to compound above CPI over the hold.
Questions for the listing agent
- Built in 1950 — when were the roof, HVAC, electrical panel, plumbing, and water heater last replaced?
- Is there a deadline driving the sale (1031 exchange, divorce, estate, relocation)? That informs how much negotiation room exists.
- Schools are F-rated, which usually means shorter tenancies and higher turnover. Who's the typical renter profile here, and what's been the actual vacancy rate?
- What's the average days-on-market for RENTAL listings here right now (not sales)? A rising rental-DOM trend means longer vacancies and softer asking-rent achievability than the comps imply.
- What's the recent tenant-quality profile in this submarket — average credit score on applications, eviction rate, late-payment / NSF rate, and stable-employment percentage? A property-management company in the area should have these aggregated.
- How much new for-sale + rental construction is in the pipeline within 1–3 miles? Heavy new supply typically softens prices + rents 12–24 months out; constrained supply supports both.
Investment metrics
- 1% rule
- 1.22% ✓
- Cap rate
- 8.65%
- Cash-on-cash
- 8.43%
- DSCR
- 1.38
- GRM
- 6.8
CMA / ARV
- ARV (on-the-fly)
- $255,354
- Comps found
- 4
Show comp detail 4 sales within ~0.75 mi
| Address | Dist | Beds/Ba | Sqft | Sold | Price | $/sf | Match |
|---|---|---|---|---|---|---|---|
| 10134 Palestine St | 0.11mi | 4/2.0 (-1) | 1,650 (+3%) | 8mo | $199,900 | $121 | 75 |
| 10102 Wiggins | 0.06mi | 4/2.0 (-1) | 1,508 (-6%) | 5mo | $239,999 | $159 | 74 |
| 10313 Chadwick St | 0.32mi | 4/2.0 (-1) | 1,500 (-7%) | 1mo | $239,000 | $159 | 64 |
| 10329 Fairfax St | 0.41mi | 4/2.0 (-1) | 1,584 (-1%) | 9mo | $249,000 | $157 | 62 |
Match score weights: distance 35% · size 25% · config 20% · recency 20%. Top-matched comps best support the ARV.
Projected returns pro-forma
10.0% appreciation · 3.0% rent growth · sell at horizon
- IRR
- 30.5%
- Equity multiple
- 3.40×
- Total profit
- $107,296
- Equity at exit
- $144,141
- IRR
- 26.4%
- Equity multiple
- 7.71×
- Total profit
- $300,410
- Equity at exit
- $310,845
Cash invested: $44,800 (down + closing). Projections, not guarantees.
Landlord ↔ Tenant lean methodology
- Overall (STATE)
- 87 Strongly Landlord-Friendly
- State Texas
- 87 Strongly Landlord-Friendly · R+5
- County
- — inherits STATE
- City
- — inherits STATE
ZIP-level market 77029
- Home prices YoY
- 7.2%
- Active inventory
- 153
- Price-to-rent
- 6.8×
Monthly cashflow live
- Estimated rent
- $1,954 medium interval (Pro) →
- Mortgage (P&I)
- −$839
- Tax from tax record
- −$323 /mo · $3,873/yr
- Insurance
- −$67
- HOA
- −$0
- Vacancy / Maint / Mgmt
- −$410
- Net cashflow
- $315
Break-even live
UW: 25.0% down · 7.5% · 30yr · 1.5% tax · 5.0% vac · 8.0% maint · 8.0% mgmt
Financing live
Cash to close
- Down payment
- $40,000
- Closing costs
- $4,800
- Reserves months
- —
- Total cash needed
- —
Loan-product check · same deal, 3 products live
Conventional
25% down · 7.5% · 30yr
- Down + closing
- —
- Monthly P&I
- —
- Monthly cashflow
- —
- DSCR
- —
- Eligible?
- —
Personal DTI + credit; lowest rate.
DSCR
20% down · 8.5% · 30yr
- Down + closing
- —
- Monthly P&I
- —
- Monthly cashflow
- —
- DSCR
- —
- Eligible?
- —
No personal income docs; deal must DSCR.
Hard money
10% down · 12.0% · 12mo
- Down + closing
- —
- Monthly P&I
- —
- Monthly cashflow
- —
- DSCR
- —
- Eligible?
- —
Short-term bridge; refi at stabilization.
Listing history 40 events
-
2026-06-18days on market $160,000 Active 26 DOM
-
2026-06-17days on market $160,000 Active 25 DOM
-
2026-06-16days on market $160,000 Active 24 DOM
-
2026-06-15days on market $160,000 Active 23 DOM
-
2026-06-13days on market $160,000 Active 21 DOM
-
2026-06-13pricedays on market $160,000 Active 20 DOM
-
2026-06-09days on market $190,000 Active 17 DOM
-
2026-06-08days on market $190,000 Active 16 DOM
-
2026-06-07days on market $190,000 Active 15 DOM
-
2026-06-04days on market $190,000 Active 12 DOM
-
2026-06-03days on market $190,000 Active 11 DOM
-
2026-06-02days on market $190,000 Active 10 DOM
-
2026-06-01days on market $190,000 Active 9 DOM
-
2026-05-31days on market $190,000 Active 8 DOM
-
2026-05-23$190,000 Active
-
2026-01-02historical
-
2025-12-22historical $1,850
-
2025-11-13$1,850
-
2025-09-11price $189,900
-
2025-09-05$199,990 Active
-
2025-09-05historical
-
2025-06-19price $199,990
-
2025-06-13price $205,000
-
2025-06-05$214,900 Active
-
2025-06-04historical $1,850
-
2025-06-04price $1,850
-
2025-05-28price $1,875
-
2025-05-21$1,900
-
2024-02-29historical
-
2023-11-01price $200,000
-
2023-07-31price $215,000
-
2023-07-27price $225,000
-
2023-07-12$235,000 Active
-
2023-05-01soldstatus
-
2020-09-11soldstatus
-
2008-07-30historical
-
2008-05-11$59,900
-
2006-06-23soldstatus
-
2004-05-03soldstatus
-
1988-01-02soldstatus
ⓘ Source: listings_history table (triggers on properties + properties_extension) + one-shot
backfill from property_details.listing_events for pre-trigger history.
Tax reassessment forecast TX · Resets to sale price
- Current annual tax
- $3,873 · $323/mo
- Projected year-2 tax
- $3,873 · $323/mo
- Expected delta
- $0/yr ($0/mo · -0.0%)
ⓘ Screening estimate from a state-policy table — verify with the county assessor before closing.
Climate risk First Street
- Flood 1/10 Low FEMA zone X (unshaded) · 0% chance over 30 yrs
- Wildfire 4/10 Moderate
- Heat 9/10 Extreme 7 d/yr ≥109°F today · 23 d/yr by 30 yrs out
- Wind 9/10 Extreme 99% chance of damaging wind over 30 yrs
- Air quality 3/10 Moderate 2 unhealthy d/yr today · 3 by 30 yrs out
Nearby sold comps map
Loading sold comps map…
Walkable amenities ~0.75 mi
Loading nearby amenities…
Taxation est. · year 1
- Rental income
- $23,442
- − Mortgage interest
- −$8,962
- − Property taxes
- −$3,873
- − Insurance
- −$800
- − Repairs & maintenance
- −$1,875
- − Management
- −$1,875
- − Depreciation
- −$4,655
- Taxable income
- $1,402
- Est. tax owed @ 24.0%
- −$336
- After-tax cash flow
- $3,441/yr
For passive investors: Depreciation is non-cash, so a rental often shows a tax loss while cash-flowing — sheltering income. Rental losses are passive: they offset passive income freely, and up to $25,000/yr can offset ordinary (W-2) income if you actively participate and your MAGI is under $100k (phasing out to $0 by $150k); unused losses carry forward. On sale, claimed depreciation is recaptured at up to 25%, and gains may owe capital-gains tax (a 1031 exchange can defer both). Figures are a year-1 estimate at your 24.0% rate — not tax advice; consult a CPA.
Schools (NCES district)
- District
- Galena Park ISD
- NCES district ID
- 4820250
- Math proficiency
- 32% ▼ -20.00%
- Reading proficiency
- 33% ▼ -7.00%
- Median HH income
- $43,158
- Composite
- 27.62/100
- National rank
- #6927
- State rank
- #578 of 826 in TX
Livability — Jacinto City
- Score
- 70/100
- State rank
- #384
- US rank
- #8027
Category grades
Schools grade is shown separately in the Schools card above.
Census & demographics
- Census place
- Jacinto City, TX
- County
- Harris County · 4,702,590 people
- City population
- 16,154
- Metro
- Houston-The Woodlands-Sugar Land, TX
- Population (ZIP)
- 16,154
- Household income
- $48,279
- Rent vs Own
- Severe rent burden
- 457.0
Population outlook (Harris County) Hauer SSP2
- Today (2025)
- 5,571,493 people
- By 2030
- 6,089,821 · +9.3%
- By 2040
- 7,142,806 · +28.2%
- By 2050
- 8,185,864 · +46.9%
- By 2075
- 10,574,329 · +89.8%
- By 2100
- 12,109,958 · +117.4%
Race, ethnicity, and origin ACS 2023
- Neighborhood character
- Predominantly Hispanic (72%)
- Race & ethnicity
- Hispanic / Latino 72% Two or more races 32% Black 22% White 5%
- Hispanic origin (detail)
- Mexican 66%
- Foreign-born
- 31% · Canada
- Languages at home
- 39% English-only · Spanish 61%
Political lean MEDSL · Harris
- 2024 margin
- Lean D (+5.5) · D 52.0% · R 46.4% · Other 1.6%
- 2008→2024 swing
- +3.9pp toward D · 2008: 1.6pp · 2024: 5.5pp
- All cycles
- 2024: D+5.5 2020: D+13.3 2016: D+12.4 2012: D+0.1 2008: D+1.6
Not yet ingested
- Civics
- —
Market trends
- HPI YoY
- ▲ 18.53%
- Current HPI
- 276.1811
- Rent YoY
- —
- Metro
- Houston-The Woodlands-Sugar Land, TX
- State GDP YoY
- ▲ 3.95%
- F500 in state
- 110
Industry mix (Fortune 500 HQ in TX)
| Industry | F500 HQs | Revenue |
|---|---|---|
| Energy | 16 | $1,198B |
|
||
| Technology | 5 | $198B |
|
||
| Engineering / Construction | 4 | $72B |
|
||
| Energy Services | 3 | $60B |
|
||
| Utilities | 3 | $41B |
|
||
| Healthcare | 2 | $330B |
|
||
Price history
+217.2% since first listed26 events — show timeline
- 2026-05-23 Listed $190,000 HARMLS
- 2026-01-02 Listing Removed — HARMLS
- 2025-12-22 Rental Removed $1,850 HARMLS
- 2025-11-13 Listed for Rent $1,850 HARMLS
- 2025-09-11 Price Changed $189,900 HARMLS
- 2025-09-05 Listing Removed — HARMLS
- 2025-09-05 Listed $199,990 HARMLS
- 2025-06-19 Price Changed $199,990 HARMLS
- 2025-06-13 Price Changed $205,000 HARMLS
- 2025-06-05 Listed $214,900 HARMLS
- 2025-06-04 Rental Removed $1,850 HARMLS
- 2025-06-04 Price Changed $1,850 HARMLS
- 2025-05-28 Price Changed $1,875 HARMLS
- 2025-05-21 Listed for Rent $1,900 HARMLS
- 2024-02-29 Listing Removed — HARMLS
- 2023-11-01 Price Changed $200,000 HARMLS
- 2023-07-31 Price Changed $215,000 HARMLS
- 2023-07-27 Price Changed $225,000 HARMLS
- 2023-07-12 Listed $235,000 HARMLS
- 2023-05-01 Sold (Public Records) — Public Records
- 2020-09-11 Sold (Public Records) — Public Records
- 2008-07-30 Listing Removed — HARMLS
- 2008-05-11 Listed $59,900 HARMLS
- 2006-06-23 Sold (Public Records) — Public Records
- 2004-05-03 Sold (Public Records) — Public Records
- 1988-01-02 Sold (Public Records) — Public Records
Property tax history
+4.7%/yrLatest (2025): $3,873 · +4.1% YoY. Source: county tax records.
Cash-flow waterfall
monthlySold comps — $/sqft
last 12 mo · ≤1 miLoading sold comps…