343 Jenkins Ferry Rd · Knoxville, AR
Flood risk 1/10 · Minimal
- FEMA flood zone
- X (unshaded)
- Chance of flooding over 30 yrs
- 0.0%
- Est. flood insurance / yr
- $507 – $1,088
Fire risk 5/10 · Moderate
- Est. fire insurance / yr
- $1,499 – $2,785
Heat risk 7/10 · Major
- Hot days now (above 111°F)
- 7 days/yr
- Hot days in 30 yrs
- 21 days/yr
Wind risk 2/10 · Minimal
- Chance of severe wind over 30 yrs
- 3.0%
Air-quality risk 1/10 · Minimal
- Unhealthy air days now
- 0 days/yr
- Unhealthy air days in 30 yrs
- 0 days/yr
Risk factors via First Street. Map © Google.
Why this score? — see what drove the A- grade
The composite is a weighted blend of 9 inputs, each scored 0–100. Each bar is that input's sub-score; the figure is the points it added to the 100-point composite (weight × sub-score).
- Cash flow +30.0/30.0
- ARV discount +15.0/15.0
- DSCR +10.0/10.0
- Appreciation +8.4/10.0
- 1% rule +7.4/10.0
- Livability +3.1/5.0
- Schools +2.6/10.0
- Rent growth +2.5/5.0
- Condition / age +2.5/5.0
$72,000
🖨 Deal sheet 📄 Offer letter ✓ Due diligence
Listing remarks
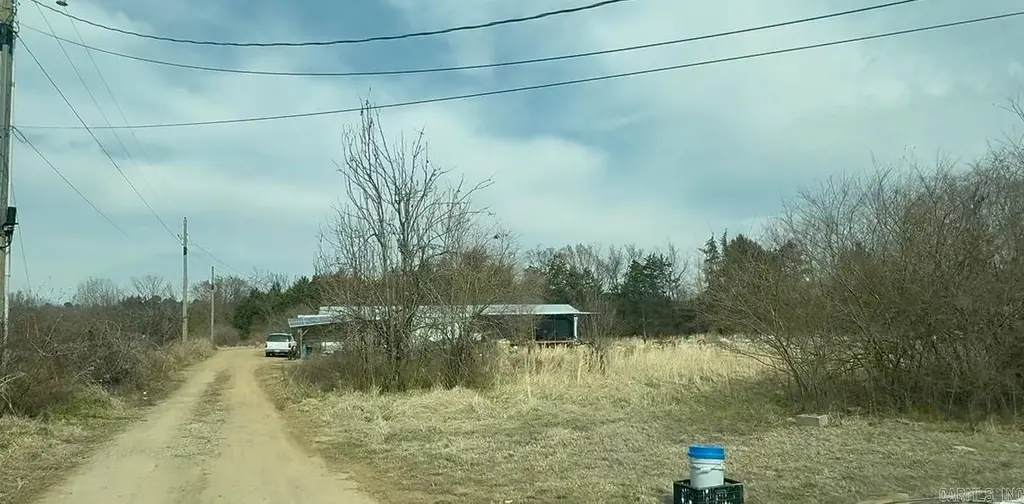
* * Investment Opportunities * * Great opportunity for investors or buyers looking for rental income potential. 2.5-acre tract with 3 existing manufactured homes each with separate septic, power poles, wells as well as registered separate mailing addresses for each. Utilities available for a fourth. Whether you are looking to renovate and rent, place new homes, or hold as income-producing property, this setup offers flexibility and upside. Priced with condition in mind and ready for someone willing to put in the effort. Solid opportunity to add to your rental portfolio.
Key facts
- One acre tract
- Three acre tract
- Power poles
Tags
Property features AI
Finance
- Other: Approximately 2.51 acres; Approximate building size: 1,200 (per tax records); Annual taxes approximately $500
- Financial info: Potential financing available: Cash or in-house financing
Exterior
- Parking: Other parking (see remarks)
- Utilities: Well water; Septic system; Electric service (Entergy available)
- Home design: Manufactured / Mobile home
- Construction: Roof: see remarks; Foundation: see remarks
- Exterior features: Paved road access; Level, wooded and cleared lot
Interior
- Kitchen: Kitchen equipment: see remarks
- Bedrooms: Bedroom details and locations: see remarks
- Flooring: Flooring: see remarks
- Bathrooms: 1 full bathroom
- Heating & cooling: Heating and cooling: see remarks
- Interior features: Level and wooded lot views inside (see remarks); Fireplace (see remarks)
- Laundry & utility: Utility hookups and locations: see remarks
Neighborhood map
What this means for you Summary
Snapshot
- This is a 3-bed/1.0-bath manufactured listed at $72k.
Deal economics
- At list price, monthly cash flow is $269 ($3k/yr) — positive.
- The deal already cash-flows at list — no discount required.
- Meets the 1% rule at list price ($896 rent vs $72k).
- Recommended offer: $68k (6.0% below list) — sets the bar for market timing.
Location & tenants
- Location reads 61/100 on livability (#250 in AR) — a middle-class / working-renter tenant base. Strengths: cost of living A+, health & safety A, housing B+; Watch: crime F, amenities F, commute F.
- Lamar School District (rural): math 32% / reading 30% proficiency, ranked #152 of 238 in AR (top 64%) — families likely to look elsewhere, expect single-tenant / working-renter base with shorter leases.
- Zoned schools: Lamar Elementary School (math 36% / reading 27%, grade F, #293 of 454 statewide, top 65%, 621 students, 67% FRL); Lamar High School (math 12% / reading 27%, grade F, #239 of 292 statewide, top 85%, 358 students, 59% FRL).
- Market conditions: 12 active listings in the ZIP; 12 units permitted in Johnson County in 2024 (0 in 5+ unit buildings).
Forward outlook
- In year one you build about $5k of equity ($498 loan paydown + $5k appreciation (6.8% local appreciation)).
- Johnson County population projected at +8% by 2050 — modest demand growth; plan on rents tracking national, not racing it.
- At projected returns (6.8% appreciation + 3.0% rent growth), your $20k cash investment doubles in ~3 years — after that, you're playing with house money.
- By year 7, paydown + projected appreciation supports a ~$36k cash-out refi (75% LTV) — recoverable capital for the next deal without selling this one.
Negotiation context
- It's been on market 63 days — a 6% lower offer ($68k) is reasonable based on typical stale-listing flexibility.
- 2 sale attempts; this cycle's ask has dropped $18k (20%) from the opening price — seller is motivated, your offer sets the floor, not the list.
- Current owner paid $61k; 18% above their basis — modest negotiation headroom, anchor on the comps not their cost.
Risks & watch-outs
- Climate carrying-cost: moderate wildfire risk; extreme-heat days projected 7→21/yr by 2055 (HVAC capex compounding) — expect insurance premiums to compound above CPI over the hold.
Questions for the listing agent
- It's been on market 63 days. Have you received any prior offers? Is the seller open to a 6% concession, seller financing, or rate buy-down credit?
- Why hasn't it sold? Are there any deal-killer items the seller is aware of (foundation, flood, title, zoning, code violations)?
- Is there a deadline driving the sale (1031 exchange, divorce, estate, relocation)? That informs how much negotiation room exists.
- Schools are F-rated, which usually means shorter tenancies and higher turnover. Who's the typical renter profile here, and what's been the actual vacancy rate?
- Crime grade is F in this area — have there been break-ins, vandalism, or insurance claims at this property in the last 3 years? What carrier currently insures it and at what premium?
- What's the average days-on-market for RENTAL listings here right now (not sales)? A rising rental-DOM trend means longer vacancies and softer asking-rent achievability than the comps imply.
- What's the recent tenant-quality profile in this submarket — average credit score on applications, eviction rate, late-payment / NSF rate, and stable-employment percentage? A property-management company in the area should have these aggregated.
- How much new for-sale + rental construction is in the pipeline within 1–3 miles? Heavy new supply typically softens prices + rents 12–24 months out; constrained supply supports both.
Investment metrics
- 1% rule
- 1.24% ✓
- Cap rate
- 10.77%
- Cash-on-cash
- 16.00%
- DSCR
- 1.71
- GRM
- 6.7
CMA / ARV
- ARV (on-the-fly)
- $104,576
- Comps found
- 2
Show comp detail 2 sales within ~0.75 mi
| Address | Dist | Beds/Ba | Sqft | Sold | Price | $/sf | Match |
|---|---|---|---|---|---|---|---|
| 913 Jenkins Ferry Rd | 0.53mi | 3/2.0 | 1,300 (+7%) | 8mo | $62,000 | $48 | 53 |
| 22756 W Hwy 64 | 0.73mi | 3/2.0 | 1,216 (0%) | 19mo | $105,000 | $86 | 46 |
Match score weights: distance 35% · size 25% · config 20% · recency 20%. Top-matched comps best support the ARV.
Projected returns pro-forma
6.75% appreciation · 3.0% rent growth · sell at horizon
- IRR
- 30.1%
- Equity multiple
- 3.04×
- Total profit
- $41,157
- Equity at exit
- $48,737
- IRR
- 27.6%
- Equity multiple
- 6.30×
- Total profit
- $106,897
- Equity at exit
- $91,549
Cash invested: $20,160 (down + closing). Projections, not guarantees.
Landlord ↔ Tenant lean methodology
- Overall (STATE)
- 92 Strongly Landlord-Friendly
- State Arkansas
- 92 Strongly Landlord-Friendly · R+14
- County
- — inherits STATE
- City
- — inherits STATE
ZIP-level market 72845
- Home prices YoY
- 4.7%
- Active inventory
- 12
- Price-to-rent
- 6.7×
Monthly cashflow live
- Estimated rent
- $896 medium interval (Pro) →
- Mortgage (P&I)
- −$378
- Tax from tax record
- −$32 /mo · $380/yr
- Insurance
- −$30
- HOA
- −$0
- Vacancy / Maint / Mgmt
- −$188
- Net cashflow
- $269
Break-even live
UW: 25.0% down · 7.5% · 30yr · 1.5% tax · 5.0% vac · 8.0% maint · 8.0% mgmt
Financing live
Cash to close
- Down payment
- $18,000
- Closing costs
- $2,160
- Reserves months
- —
- Total cash needed
- —
Loan-product check · same deal, 3 products live
Conventional
25% down · 7.5% · 30yr
- Down + closing
- —
- Monthly P&I
- —
- Monthly cashflow
- —
- DSCR
- —
- Eligible?
- —
Personal DTI + credit; lowest rate.
DSCR
20% down · 8.5% · 30yr
- Down + closing
- —
- Monthly P&I
- —
- Monthly cashflow
- —
- DSCR
- —
- Eligible?
- —
No personal income docs; deal must DSCR.
Hard money
10% down · 12.0% · 12mo
- Down + closing
- —
- Monthly P&I
- —
- Monthly cashflow
- —
- DSCR
- —
- Eligible?
- —
Short-term bridge; refi at stabilization.
Listing history 23 events
-
2026-06-19days on market $72,000 Active 63 DOM
-
2026-06-18days on market $72,000 Active 62 DOM
-
2026-06-17days on market $72,000 Active 61 DOM
-
2026-06-16days on market $72,000 Active 60 DOM
-
2026-06-15days on market $72,000 Active 59 DOM
-
2026-06-14days on market $72,000 Active 57 DOM
-
2026-06-12days on market $72,000 Active 56 DOM
-
2026-06-09days on market $72,000 Active 53 DOM
-
2026-06-08days on market $72,000 Active 52 DOM
-
2026-06-07days on market $72,000 Active 51 DOM
-
2026-06-05days on market $72,000 Active 49 DOM
-
2026-06-04statusdays on market $72,000 Active 47 DOM
-
2026-06-02days on market $72,000 Price Change 46 DOM
-
2026-06-01days on market $72,000 Price Change 45 DOM
-
2026-05-31days on market $72,000 Price Change 44 DOM
-
2026-05-31days on market $72,000 Price Change 43 DOM
-
2026-05-18status Back on Market
-
2026-04-02status Under Contract
-
2026-03-20price $83,700
-
2026-03-02$90,000 New Listing
-
2025-06-25price $86,000
-
2009-12-31soldstatus $61,000
-
2002-06-13soldstatus $70,000
ⓘ Source: listings_history table (triggers on properties + properties_extension) + one-shot
backfill from property_details.listing_events for pre-trigger history.
Tax reassessment forecast AR · Resets to sale price
- Current annual tax
- $380 · $32/mo
- Projected year-2 tax
- $461 · $38/mo
- Expected delta
- +$81/yr (+$7/mo · 21.3%)
ⓘ Screening estimate from a state-policy table — verify with the county assessor before closing.
Climate risk First Street
- Flood 1/10 Low FEMA zone X (unshaded) · 0% chance over 30 yrs
- Wildfire 5/10 Major
- Heat 7/10 Severe 7 d/yr ≥111°F today · 21 d/yr by 30 yrs out
- Wind 2/10 Low 3% chance of damaging wind over 30 yrs
- Air quality 1/10 Low 0 unhealthy d/yr today · 0 by 30 yrs out
Nearby sold comps map
Loading sold comps map…
Walkable amenities ~0.75 mi
Loading nearby amenities…
Taxation est. · year 1
- Rental income
- $10,756
- − Mortgage interest
- −$4,033
- − Property taxes
- −$380
- − Insurance
- −$360
- − Repairs & maintenance
- −$860
- − Management
- −$860
- − Depreciation
- −$2,095
- Taxable income
- $2,167
- Est. tax owed @ 24.0%
- −$520
- After-tax cash flow
- $2,706/yr
For passive investors: Depreciation is non-cash, so a rental often shows a tax loss while cash-flowing — sheltering income. Rental losses are passive: they offset passive income freely, and up to $25,000/yr can offset ordinary (W-2) income if you actively participate and your MAGI is under $100k (phasing out to $0 by $150k); unused losses carry forward. On sale, claimed depreciation is recaptured at up to 25%, and gains may owe capital-gains tax (a 1031 exchange can defer both). Figures are a year-1 estimate at your 24.0% rate — not tax advice; consult a CPA.
Schools (NCES district)
- District
- Lamar School District
- NCES district ID
- 0508700
- Math proficiency
- 32% ▼ -18.00%
- Reading proficiency
- 30% ▼ -9.00%
- Median HH income
- $34,106
- Composite
- 25.53/100
- National rank
- #7432
- State rank
- #152 of 238 in AR
Livability — Knoxville
- Score
- 61/100
- State rank
- #250
- US rank
- #18122
Category grades
Schools grade is shown separately in the Schools card above.
Census & demographics
- Census place
- Knoxville, AR
- Population (ZIP)
- 882
Population outlook (Johnson County) Hauer SSP2
- Today (2025)
- 27,452 people
- By 2030
- 28,003 · +2.0%
- By 2040
- 28,960 · +5.5%
- By 2050
- 29,627 · +7.9%
- By 2075
- 31,000 · +12.9%
- By 2100
- 31,173 · +13.6%
Race, ethnicity, and origin ACS 2023
- Neighborhood character
- Predominantly White (98%)
- Race & ethnicity
- White 98% Two or more races 2%
- Common ancestry
- Iranian 6% Lithuanian 4% Slovak 3%
- Foreign-born
- 2% · Canada
- Languages at home
- 99% English-only · Spanish 1%
Political lean MEDSL · Johnson
- 2024 margin
- Solid R (+51.4) · D 23.3% · R 74.7% · Other 2.0%
- 2008→2024 swing
- -28.4pp toward R · 2008: -23.1pp · 2024: -51.4pp
- All cycles
- 2024: R+51.4 2020: R+49.0 2016: R+40.6 2012: R+28.0 2008: R+23.1
Not yet ingested
- Civics
- —
Market trends
- HPI YoY
- ▲ 6.75%
- Current HPI
- 152.1534
- Rent YoY
- —
- Metro
- —
- State GDP YoY
- ▲ 3.80%
- F500 in state
- 10
Industry mix (Fortune 500 HQ in AR)
| Industry | F500 HQs | Revenue |
|---|---|---|
| Retail | 1 | $681B |
|
||
| Food / Agriculture | 1 | $53B |
|
||
| Retail / Energy | 1 | $22B |
|
||
| Transportation / Logistics | 1 | $12B |
|
||
| Energy | 1 | $4B |
|
||
Price history
+19.6% since first listed7 events — show timeline
- 2026-05-18 Relisted — CARMLS
- 2026-04-02 Pending — CARMLS
- 2026-03-20 Price Changed $83,700 CARMLS
- 2026-03-02 Listed $90,000 CARMLS
- 2025-06-25 Price Changed $86,000 NWARMLS
- 2009-12-31 Sold (Public Records) $61,000 Public Records
- 2002-06-13 Sold (Public Records) $70,000 Public Records
Property tax history
-1.7%/yrLatest (2025): $380 · +1166.2% YoY. Source: county tax records.
Cash-flow waterfall
monthlySold comps — $/sqft
last 12 mo · ≤1 miLoading sold comps…