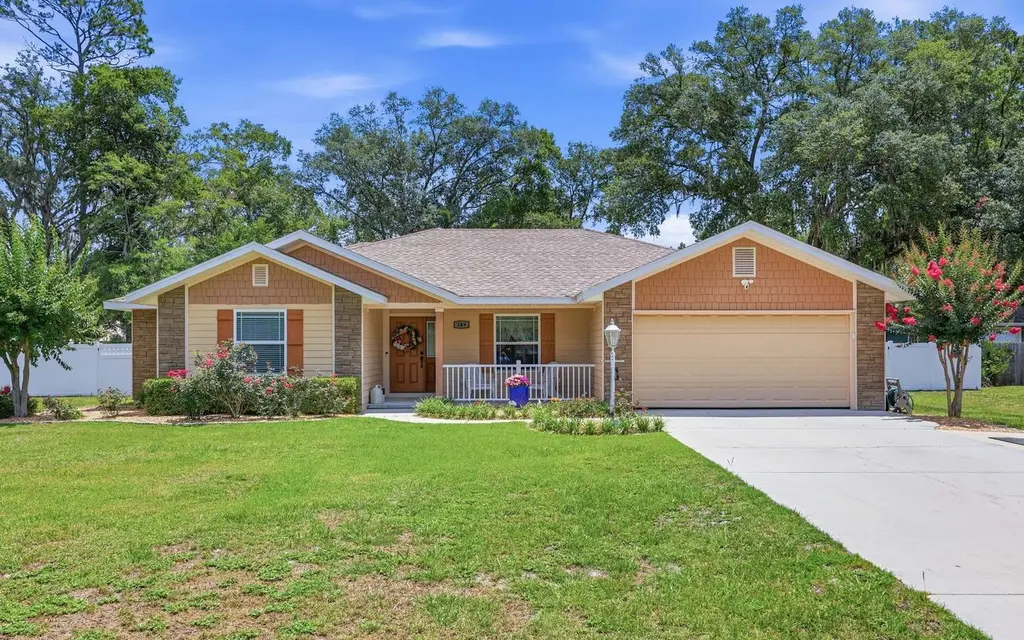
189 SW Vann Ct · Lake City, FL
Flood risk 1/10 · Minimal
- FEMA flood zone
- X (unshaded)
- Chance of flooding over 30 yrs
- 0.0%
- Est. flood insurance / yr
- $507 – $1,088
Fire risk 7/10 · Major
- Est. fire insurance / yr
- $947 – $1,759
Heat risk 8/10 · Major
- Hot days now (above 107°F)
- 7 days/yr
- Hot days in 30 yrs
- 20 days/yr
Wind risk 9/10 · Severe
- Chance of severe wind over 30 yrs
- 99.0%
Air-quality risk 5/10 · Moderate
- Unhealthy air days now
- 9 days/yr
- Unhealthy air days in 30 yrs
- 10 days/yr
Risk factors via First Street. Map © Google.
Why this score? — see what drove the F grade
The composite is a weighted blend of 9 inputs, each scored 0–100. Each bar is that input's sub-score; the figure is the points it added to the 100-point composite (weight × sub-score).
- Appreciation +10.0/10.0
- Cash flow +6.6/30.0
- Schools +4.5/10.0
- Livability +3.7/5.0
- Rent growth +2.5/5.0
- Condition / age +2.5/5.0
- ARV discount +1.7/15.0
- DSCR +0.8/10.0
- 1% rule +0.5/10.0
$339,900
🖨 Deal sheet 📄 Offer letter ✓ Due diligence
Listing remarks MLS
Wonderful like new home with split floor plan, 3 Bedroom 2 Bath home located in Mayfair Subdivision. Sizeable lot located near town and interstate. Home is a pleasure to show.
Key facts
- Quartz countertops
- Ample cabinetry
- Mayfair subdivision
Tags
Property features AI
Exterior
- Parking: 2-car garage with automatic opener
- Utilities: Private well water
- Home design: Single-story residential home
- Construction: Frame construction; Slab foundation; Built on one level
- Exterior features: Shingle roof; Shed(s); Workshop; Spa/Hot tub
Interior
- Kitchen: Dishwasher; Electric cooktop; Refrigerator; Microwave; Water softener
- Bathrooms: 2 full bathrooms
- Heating & cooling: Central heating (electric); Central air; Ceiling fans
- Interior features: Insulated windows; Screened patio/porch
Neighborhood map
What this means for you Summary
Snapshot
- This is a 3-bed/2.0-bath single-family listed at $340k.
Deal economics
- At list price, monthly cash flow is $-563 ($-7k/yr) — negative.
- To cash-flow at today's rent, offer at most $240k (29.3% below list).
- To meet the 1% rule (rent ≥ 1% of price), the offer needs to be $188k (44.8% below list).
- Recommended offer: $188k (44.8% below list) — sets the bar for 1% rule.
Location & tenants
- Location reads 73/100 on livability (#304 in FL) — a middle-class / working-renter tenant base. Strengths: cost of living A+, housing A+, health & safety A+; Watch: amenities C-, commute F, employment F.
- Columbia (town): math 53% / reading 54% proficiency, ranked #25 of 73 in FL (top 34%) — acceptable for families but not a draw, mixed tenant base, ~2y average lease.
- Market conditions: 206 active listings in the ZIP; 178 units permitted in Columbia County in 2024 (0 in 5+ unit buildings).
Forward outlook
- In year one you build about $36k of equity ($2k loan paydown + $34k appreciation (10.0% local appreciation)).
- Columbia County population projected to shrink 7% by 2050 — rents likely to lag national; underwrite the cash flow, not the appreciation.
- By year 2, paydown + projected appreciation supports a ~$58k cash-out refi (75% LTV) — recoverable capital for the next deal without selling this one.
Negotiation context
- Only 8 days on market — expect competitive offers; lowballing is unlikely to land.
- 2 sale attempts with the ask held roughly flat each time — persistent listings suggest the price (not the market) is what's stuck; bring a comps-based counter.
- Current owner paid $168k; list at $340k implies a 102% gain — meaningful room to come down on a strong offer.
Risks & watch-outs
- Climate carrying-cost: severe wind risk, 99% chance of damaging wind over 30y; major wildfire risk; extreme-heat days projected 7→20/yr by 2055 (HVAC capex compounding) — expect insurance premiums to compound above CPI over the hold.
Questions for the listing agent
- What do current leases actually rent for vs. the listed asking? Can we see a recent rent roll and the last 12 months of T-12 income?
- Is there a deadline driving the sale (1031 exchange, divorce, estate, relocation)? That informs how much negotiation room exists.
- Schools are B-rated — typically a magnet for longer-tenancy family renters. What's the average tenant stay here, and is there a school-zone premium baked into asking?
- The area grade is low — what's the realistic commute time and amenity access for the typical tenant pool here? Any planned neighborhood developments (good or bad) we should know about?
- What's the average days-on-market for RENTAL listings here right now (not sales)? A rising rental-DOM trend means longer vacancies and softer asking-rent achievability than the comps imply.
- What's the recent tenant-quality profile in this submarket — average credit score on applications, eviction rate, late-payment / NSF rate, and stable-employment percentage? A property-management company in the area should have these aggregated.
- How much new for-sale + rental construction is in the pipeline within 1–3 miles? Heavy new supply typically softens prices + rents 12–24 months out; constrained supply supports both.
Investment metrics
- 1% rule
- 0.55% ✗
- Cap rate
- 4.30%
- Cash-on-cash
- -7.10%
- DSCR
- 0.68
- GRM
- 15.1
CMA / ARV
- ARV (on-the-fly)
- $300,888
- Comps found
- 12
Show comp detail 12 sales within ~0.75 mi
| Address | Dist | Beds/Ba | Sqft | Sold | Price | $/sf | Match |
|---|---|---|---|---|---|---|---|
| 138 SW Pilots Way | 0.07mi | 3/2.0 | 1,483 (-2%) | 3mo | $283,000 | $191 | 91 |
| 116 SW Lucile Ct | 0.14mi | 3/2.0 | 1,592 (+5%) | 11mo | $325,000 | $204 | 76 |
| 275 SW Woodcrest Dr | 0.43mi | 3/2.0 | 1,425 (-6%) | 7mo | $285,000 | $200 | 64 |
| 313 SW Crest Gln | 0.69mi | 3/2.0 | 1,484 (-2%) | 2mo | $295,000 | $199 | 63 |
| 218 SW Woodview Way | 0.53mi | 3/2.0 | 1,600 (+6%) | 4mo | $155,000 | $97 | 62 |
| 1256 SW County Road 252b | 0.54mi | 3/2.0 | 1,400 (-7%) | 4mo | $265,000 | $189 | 59 |
| 253 SW Edna Ct | 0.71mi | 3/2.0 | 1,460 (-3%) | 4mo | $289,900 | $199 | 58 |
| 268 SW Zierke Dr | 0.31mi | 3/2.0 | 1,311 (-13%) | 6mo | $280,000 | $214 | 58 |
| 425 SW Woodcrest Dr | 0.55mi | 3/2.0 | 1,546 (+2%) | 16mo | $352,500 | $228 | 57 |
| 384 SW Woodcrest Dr | 0.56mi | 3/2.0 | 1,425 (-6%) | 11mo | $305,000 | $214 | 56 |
| 506 SW Kirby Ave | 0.68mi | 3/2.0 | 1,568 (+4%) | 11mo | $230,000 | $147 | 53 |
| 269 SW Edna Ct | 0.69mi | 3/2.0 | 1,645 (+9%) | 10mo | $299,900 | $182 | 45 |
Match score weights: distance 35% · size 25% · config 20% · recency 20%. Top-matched comps best support the ARV.
Projected returns pro-forma
10.0% appreciation · 3.0% rent growth · sell at horizon
- IRR
- 19.2%
- Equity multiple
- 2.57×
- Total profit
- $149,091
- Equity at exit
- $306,209
- IRR
- 17.7%
- Equity multiple
- 5.91×
- Total profit
- $466,940
- Equity at exit
- $660,351
Cash invested: $95,172 (down + closing). Projections, not guarantees.
Landlord ↔ Tenant lean methodology
- Overall (STATE)
- 87 Strongly Landlord-Friendly
- State Florida
- 87 Strongly Landlord-Friendly · R+3
- County
- — inherits STATE
- City
- — inherits STATE
ZIP-level market 32024
- Home prices YoY
- 7.6%
- Active inventory
- 206
- Price-to-rent
- 15.1×
Monthly cashflow live
- Estimated rent
- $1,876 medium interval (Pro) →
- Mortgage (P&I)
- −$1,782
- Tax from tax record
- −$121 /mo · $1,454/yr
- Insurance
- −$142
- HOA
- −$0
- Vacancy / Maint / Mgmt
- −$394
- Net cashflow
- $-563
Break-even live
UW: 25.0% down · 7.5% · 30yr · 1.5% tax · 5.0% vac · 8.0% maint · 8.0% mgmt
Financing live
Cash to close
- Down payment
- $84,975
- Closing costs
- $10,197
- Reserves months
- —
- Total cash needed
- —
Loan-product check · same deal, 3 products live
Conventional
25% down · 7.5% · 30yr
- Down + closing
- —
- Monthly P&I
- —
- Monthly cashflow
- —
- DSCR
- —
- Eligible?
- —
Personal DTI + credit; lowest rate.
DSCR
20% down · 8.5% · 30yr
- Down + closing
- —
- Monthly P&I
- —
- Monthly cashflow
- —
- DSCR
- —
- Eligible?
- —
No personal income docs; deal must DSCR.
Hard money
10% down · 12.0% · 12mo
- Down + closing
- —
- Monthly P&I
- —
- Monthly cashflow
- —
- DSCR
- —
- Eligible?
- —
Short-term bridge; refi at stabilization.
Listing history 8 events
-
2026-06-19days on market $339,900 Active 8 DOM
-
2026-06-18days on market $339,900 Active 7 DOM
-
2026-06-17days on market $339,900 Active 6 DOM
-
2026-06-16days on market $339,900 Active 5 DOM
-
2026-06-15days on market $339,900 Active 4 DOM
-
2026-06-14days on market $339,900 Active 2 DOM
-
2026-06-12remarks 699-char remark
-
2026-06-12$339,900 Active 1 DOM
ⓘ Source: listings_history table (triggers on properties + properties_extension) + one-shot
backfill from property_details.listing_events for pre-trigger history.
Tax reassessment forecast FL · Resets to sale price
- Current annual tax
- $1,454 · $121/mo
- Projected year-2 tax
- $2,821 · $235/mo
- Expected delta
- +$1,368/yr (+$114/mo · 94.1%)
ⓘ Screening estimate from a state-policy table — verify with the county assessor before closing.
Climate risk First Street
- Flood 1/10 Low FEMA zone X (unshaded) · 0% chance over 30 yrs
- Wildfire 7/10 Severe
- Heat 8/10 Severe 7 d/yr ≥107°F today · 20 d/yr by 30 yrs out
- Wind 9/10 Extreme 99% chance of damaging wind over 30 yrs
- Air quality 5/10 Major 9 unhealthy d/yr today · 10 by 30 yrs out
Nearby sold comps map
Loading sold comps map…
Walkable amenities ~0.75 mi
Loading nearby amenities…
Taxation est. · year 1
- Rental income
- $22,512
- − Mortgage interest
- −$19,040
- − Property taxes
- −$1,454
- − Insurance
- −$1,700
- − Repairs & maintenance
- −$1,801
- − Management
- −$1,801
- − Depreciation
- −$9,888
- Taxable loss
- −$13,171
- Est. tax savings @ 24.0%
- +$3,161
- After-tax cash flow
- $-3,597/yr
For passive investors: Depreciation is non-cash, so a rental often shows a tax loss while cash-flowing — sheltering income. Rental losses are passive: they offset passive income freely, and up to $25,000/yr can offset ordinary (W-2) income if you actively participate and your MAGI is under $100k (phasing out to $0 by $150k); unused losses carry forward. On sale, claimed depreciation is recaptured at up to 25%, and gains may owe capital-gains tax (a 1031 exchange can defer both). Figures are a year-1 estimate at your 24.0% rate — not tax advice; consult a CPA.
Schools (NCES district)
- District
- Columbia
- NCES district ID
- 1200360
- Math proficiency
- 53% ▼ -10.00%
- Reading proficiency
- 54% ▼ -3.00%
- Median HH income
- $40,053
- Composite
- 44.74/100
- National rank
- #2750
- State rank
- #25 of 73 in FL
Livability — Lake City
- Score
- 73/100
- State rank
- #304
- US rank
- #5154
Category grades
Schools grade is shown separately in the Schools card above.
Census & demographics
- City population
- 40,507
- Population (ZIP)
- 20,644
Population outlook (Columbia County) Hauer SSP2
- Today (2025)
- 68,129 people
- By 2030
- 67,501 · -0.9%
- By 2040
- 65,465 · -3.9%
- By 2050
- 63,058 · -7.4%
- By 2075
- 56,291 · -17.4%
- By 2100
- 45,243 · -33.6%
Race, ethnicity, and origin ACS 2023
- Neighborhood character
- Predominantly White (78%)
- Race & ethnicity
- White 78% Hispanic / Latino 10% Two or more races 7% Black 6% Asian 2%
- Hispanic origin (detail)
- Mexican 2% Puerto Rican 3%
- Common ancestry
- Italian 2% Portuguese 1% Lithuanian 1%
- Foreign-born
- 5% · Canada, Jamaica
- Languages at home
- 91% English-only · Spanish 8% Vietnamese 1%
Political lean MEDSL · Columbia
- 2024 margin
- Solid R (+50.2) · D 24.6% · R 74.7%
- 2008→2024 swing
- -16.4pp toward R · 2008: -33.8pp · 2024: -50.2pp
- All cycles
- 2024: R+50.2 2020: R+45.2 2016: R+44.5 2012: R+36.7 2008: R+33.8
Not yet ingested
- Civics
- —
Market trends
- HPI YoY
- ▲ 19.05%
- Current HPI
- 269.4659
- Rent YoY
- —
- Metro
- —
- State GDP YoY
- ▲ 3.28%
- F500 in state
- 36
Industry mix (Fortune 500 HQ in FL)
| Industry | F500 HQs | Revenue |
|---|---|---|
| Industrial Technology | 2 | $29B |
|
||
| Insurance | 2 | $17B |
|
||
| Retail | 1 | $60B |
|
||
| Technology Distribution | 1 | $58B |
|
||
| Homebuilding | 1 | $35B |
|
||
| Technology Manufacturing | 1 | $35B |
|
||
Price history
+183.2% since first listed10 events — show timeline
- 2026-06-11 Listed $339,900 NFMLS
- 2026-05-01 Price Changed $339,500 NFMLS
- 2026-03-03 Price Changed $344,900 NFMLS
- 2025-10-24 Price Changed $349,900 NFMLS
- 2025-09-25 Listed $355,000 NFMLS
- 2018-05-07 Sold (Public Records) $168,000 Public Records
- 2018-03-29 Sold (MLS) $168,000 NFMLS
- 2014-03-05 Sold (Public Records) $158,900 Public Records
- 2013-03-05 Sold (Public Records) $14,900 Public Records
- 2006-06-06 Sold (Public Records) $120,000 Public Records
Property tax history
-4.7%/yrLatest (2025): $1,454 · -0.5% YoY. Source: county tax records.
Cash-flow waterfall
monthlySold comps — $/sqft
last 12 mo · ≤1 miLoading sold comps…