 Triplex
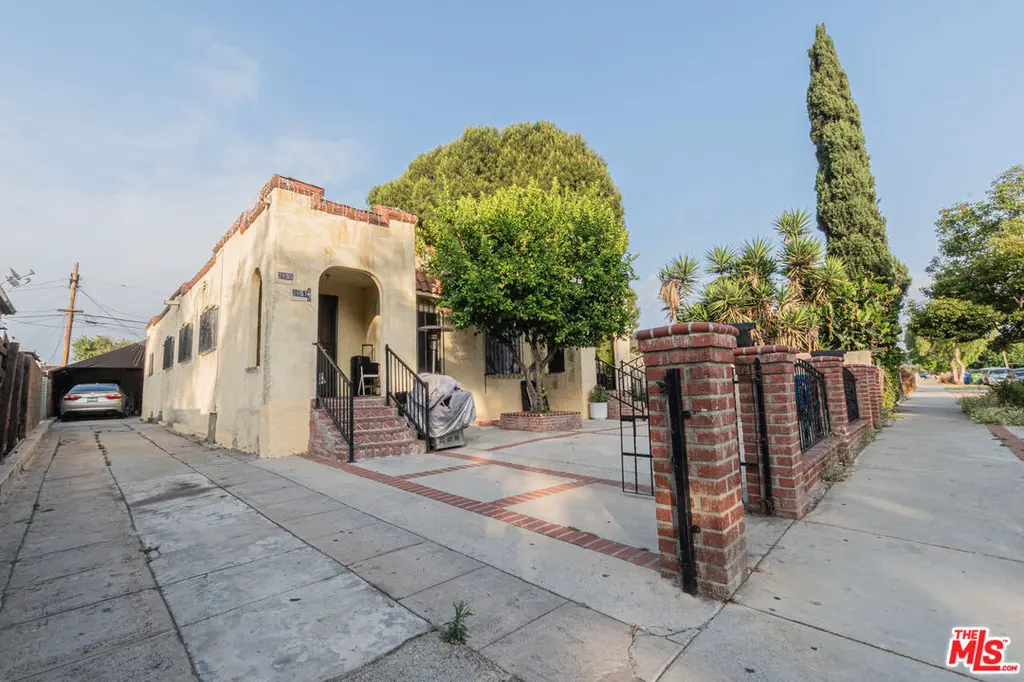
2855 W Avenue 34 · Los Angeles, CA
Flood risk 1/10 · Minimal
- FEMA flood zone
- X (unshaded)
- Chance of flooding over 30 yrs
- 0.0%
- Est. flood insurance / yr
- $507 – $1,088
Fire risk 1/10 · Minimal
- Est. fire insurance / yr
- $659 – $1,223
Heat risk 6/10 · Moderate
- Hot days now (above 97°F)
- 7 days/yr
- Hot days in 30 yrs
- 22 days/yr
Wind risk 1/10 · Minimal
- Chance of severe wind over 30 yrs
- —
Air-quality risk 6/10 · Moderate
- Unhealthy air days now
- 11 days/yr
- Unhealthy air days in 30 yrs
- 12 days/yr
Risk factors via First Street. Map © Google.
Why this score? — see what drove the C- grade
The composite is a weighted blend of 9 inputs, each scored 0–100. Each bar is that input's sub-score; the figure is the points it added to the 100-point composite (weight × sub-score).
- Cash flow +21.5/30.0
- ARV discount +7.5/15.0
- DSCR +6.9/10.0
- 1% rule +5.6/10.0
- Schools +3.6/10.0
- Livability +3.4/5.0
- Rent growth +2.6/5.0
- Condition / age +2.5/5.0
- Appreciation +0.0/10.0
$800,000
🖨 Deal sheet 📄 Offer letter ✓ Due diligence
Multi-family units
County records classify this as Multi-Family (2-4 Unit). Listing-text estimate: 3 units. confirmed
Listing remarks
Glassell Park triplex opportunity offered at $800,000. Located at 2855, 2857 and 2857 1/2 W Avenue 34, this tenant-occupied 3-unit income property consists of approximately 2,538 total building square feet across 2 buildings on an approximately 5,851 sq ft lot. Public/property records show LARD2 zoning and original construction dating to 1921. Property is subject to Los Angeles RSO and will be sold subject to tenants' rights. Excellent Northeast Los Angeles investment opportunity with long-term upside. Buyer to verify all square footage, lot size, permits, zoning, rents, expenses, and all other property information. Please do not disturb occupants. Showings by appointment only.
Key facts
- 5,851 sq ft lot
- Parking
- Built 1921
Property features AI
Finance
- Other: Two buildings on the parcel; Unit breakdown and rents: Unit type mix includes 1-bedroom units; unit rent examples — $1,169.70, $1,019.30, $1,147.40 (multiple like units reflected in data)
- Financial info: Actual annual gross rent: $40,037; Gross operating income: $40,037; Net operating income: $26,037; Total annual expenses: $14,000; Gross rent multiplier: 19.98; Rent control: Yes (indicated)
- HOA & community: Three units in the complex
Exterior
- Parking: Driveway parking
- Home design: Residential income property; Single-story
- Construction: No other structures on property
- Exterior features: Lot zoned LARD2
Interior
- Bedrooms: Three 1-bedroom units (individual unit-level details listed under units)
- Bathrooms: Each unit has 1 bathroom
- Heating & cooling: Natural gas heat; Other cooling
- Interior features: One-level layout; No additional detached structures
Neighborhood map
What this means for you Summary
Snapshot
- This is a 3 × 5-bed/2.0-bath units multifamily listed at $800k.
Deal economics
- At list price, monthly cash flow is $1k ($14k/yr) — positive. Per door: $399/mo.
- The deal already cash-flows at list — no discount required.
- Meets the 1% rule at list price ($9k rent vs $800k).
- Recommended offer: $788k (1.5% below list) — sets the bar for market timing.
- Cap rate 8.1% vs local median 2.1% in Los Angeles — top-decile yield for the area; either an underpriced asset or a hidden risk that comps aren't pricing in. Stress-test before assuming the spread holds.
Location & tenants
- Location reads 68/100 on livability (#273 in CA) — a middle-class / working-renter tenant base. Strengths: amenities A+, commute A+, employment B; Watch: health & safety C-, schools D+, crime F.
- Los Angeles Unified (urban): math 29% / reading 54% proficiency, ranked #223 of 517 in CA (top 43%) — families likely to look elsewhere, expect single-tenant / working-renter base with shorter leases; 67% free/reduced lunch — lower-income household profile, screen leases tightly.
- Market conditions: Rents flat; 239 active listings in the ZIP; 40 comparable units currently listed for rent nearby; rentals at typical pace (median 25d on market — plan ~3-4 weeks tenant-placement turnaround); 48% of comp listings sitting > 30 days — soft ceiling on asking rent; solid renter incomes; 19,697 units permitted in Los Angeles County in 2024 (9,426 in 5+ unit buildings).
- At $8,513/mo this rent would consume 108% of the median local household income ($95k/yr) (locally 2198% of renters already pay >50% of income on rent) — very limited rent-growth headroom before tenants either downsize or default.
Forward outlook
- Local home prices are declining (-3.0%/yr); year-one equity from $6k of loan paydown is wiped out by about $24k of value loss. Plan a longer hold.
- Los Angeles County population projected at +9% by 2050 — modest demand growth; plan on rents tracking national, not racing it.
Negotiation context
- It's been on market 29 days — a 2% lower offer ($788k) is reasonable based on typical stale-listing flexibility.
- 7 sale attempts since 20y ago with the ask held roughly flat each time — persistent listings suggest the price (not the market) is what's stuck; bring a comps-based counter.
- Current owner paid $32k; list at $800k implies a 2400% gain — meaningful room to come down on a strong offer.
Risks & watch-outs
- Watch-outs: built in 1921 — expect roof / HVAC / electrical / plumbing capex.
- Climate carrying-cost: extreme-heat days projected 7→22/yr by 2055 (HVAC capex compounding) — expect insurance premiums to compound above CPI over the hold.
Questions for the listing agent
- Can we see the unit-by-unit rent roll, current vacancy, and any below-market leases? What's the average tenancy length?
- What capital expenditures (roof, boiler, parking lot, exteriors) have been made in the last 5 years, and what's planned in the next 2?
- Built in 1921 — when were the roof, HVAC, electrical panel, plumbing, and water heater last replaced?
- Is there a deadline driving the sale (1031 exchange, divorce, estate, relocation)? That informs how much negotiation room exists.
- Schools are D-rated, which usually means shorter tenancies and higher turnover. Who's the typical renter profile here, and what's been the actual vacancy rate?
- Crime grade is F in this area — have there been break-ins, vandalism, or insurance claims at this property in the last 3 years? What carrier currently insures it and at what premium?
- What's the average days-on-market for RENTAL listings here right now (not sales)? A rising rental-DOM trend means longer vacancies and softer asking-rent achievability than the comps imply.
- What's the recent tenant-quality profile in this submarket — average credit score on applications, eviction rate, late-payment / NSF rate, and stable-employment percentage? A property-management company in the area should have these aggregated.
- How much new apartment / multifamily construction is in the pipeline within 1–3 miles? Heavy new supply (>2% of stock underway) typically softens rents 12–24 months out; light construction supports rent growth.
Investment metrics
- 1% rule
- 1.06% ✓
- Cap rate
- 8.09%
- Cash-on-cash
- 6.41%
- DSCR
- 1.29
- GRM
- 7.8
CMA / ARV
No comps found within radius.
Projected returns pro-forma
-3.0% appreciation · 0.21% rent growth · sell at horizon
- IRR
- -9.6%
- Equity multiple
- 0.66×
- Total profit
- $-76,541
- Equity at exit
- $119,283
- IRR
- -4.5%
- Equity multiple
- 0.74×
- Total profit
- $-58,214
- Equity at exit
- $69,169
Cash invested: $224,000 (down + closing). Projections, not guarantees.
Landlord ↔ Tenant lean methodology
- Overall (CITY)
- 0 Strongly Tenant-Friendly
- State California
- 18 Strongly Tenant-Friendly · D+13
- County
- — inherits STATE
- City Los Angeles
- 0 Strongly Tenant-Friendly · D+22
ZIP-level market 90065
- Rents YoY
- 0.2%
- Active inventory
- 239
- Price-to-rent
- 23.5×
Monthly cashflow live
- Estimated rent
- $8,513 medium interval (Pro) →
- Mortgage (P&I)
- −$4,195
- Tax est. 1.5%
- −$1,000 /mo · $12,000/yr
- Insurance
- −$333
- HOA
- −$0
- Vacancy / Maint / Mgmt
- −$1,788
- Net cashflow
- $1,197
Break-even live
3-unit breakdown (identical units grouped — click to expand)
| Units | Beds | Baths | Est. rent |
|---|---|---|---|
| 3× units | 5 | 2 | $8,514 |
| #1 | 5 | 2 | $2,838 |
| #2 | 5 | 2 | $2,838 |
| #3 | 5 | 2 | $2,838 |
| Total (3 units) | $8,513 | ||
UW: 25.0% down · 7.5% · 30yr · 1.5% tax · 5.0% vac · 8.0% maint · 8.0% mgmt
Financing live
Cash to close
- Down payment
- $200,000
- Closing costs
- $24,000
- Reserves months
- —
- Total cash needed
- —
Loan-product check · same deal, 3 products live
Conventional
25% down · 7.5% · 30yr
- Down + closing
- —
- Monthly P&I
- —
- Monthly cashflow
- —
- DSCR
- —
- Eligible?
- —
Personal DTI + credit; lowest rate.
DSCR
20% down · 8.5% · 30yr
- Down + closing
- —
- Monthly P&I
- —
- Monthly cashflow
- —
- DSCR
- —
- Eligible?
- —
No personal income docs; deal must DSCR.
Hard money
10% down · 12.0% · 12mo
- Down + closing
- —
- Monthly P&I
- —
- Monthly cashflow
- —
- DSCR
- —
- Eligible?
- —
Short-term bridge; refi at stabilization.
Rent comps 40 comps
| Address | Beds | Baths | Sqft | Rent | $/sqft | DOM | Units | Dist |
|---|---|---|---|---|---|---|---|---|
| 2814 W Avenue 34 Los Angeles, CA | 1.0 | 1.0 | 600 | $2,400 | $4.00 | 8d | 1 | 0.08mi |
| 3575 Fletcher Dr Apt 5 Los Angeles, CA | 2.0 | 1.0 | 1000 | $2,300 | $2.30 | 44d | 1 | 0.21mi |
| 2626 Crestmoore Pl Los Angeles, CA | 1.0 | 1.0 | 770 | $2,600 | $3.38 | 44d | 1 | 0.26mi |
| 3090 Weldon Ave Unit 1 Glassell Park, CA | 1.0 | 1.0 | 750 | $2,495 | $3.33 | 13d | 1 | 0.31mi |
| 3090 Weldon Ave Unit 4 Glassell Park, CA | 1.0 | 1.0 | 750 | $2,395 | $3.19 | 13d | 1 | 0.31mi |
| 2711 1/2 West Avenue 32 Los Angeles, CA | 2.0 | 1.0 | 958 | $3,695 | $3.86 | 11d | 1 | 0.32mi |
| 3250 Andrita St Unit 3 Glassell Park, CA | 1.0 | 1.0 | 644 | $2,125 | $3.30 | 11d | 1 | 0.36mi |
| 3367 Andrita St Los Angeles, CA | 2.0 | 2.0 | 790 | $2,495 | $3.16 | 21d | 2 | 0.36mi |
| 3325 Andrita St Apt J Los Angeles, CA | 2.0 | 1.0 | 850 | $2,300 | $2.71 | 44d | 1 | 0.37mi |
| 3325 Andrita St Apt D Los Angeles, CA | 1.0 | 1.0 | 600 | $1,900 | $3.17 | 44d | 1 | 0.37mi |
| 3174 Weldon Ave Los Angeles, CA | 2.0 | 1.0 | 704 | $7,300 | $10.37 | 44d | 1 | 0.41mi |
| 3221 1/2 Andrita St Los Angeles, CA | 2.0 | 1.0 | 760 | $2,300 | $3.03 | 44d | 1 | 0.41mi |
| 3334 Drew St Unit A Glassell Park, CA | 2.0 | 2.0 | 950 | $2,495 | $2.63 | 8d | 1 | 0.42mi |
| 2471 West Avenue 32 Unit 1-2 Glassell Park, CA | 2.0 | 1.0 | 958 | $3,695 | $3.86 | 19d | 1 | 0.44mi |
| 2471 W Avenue 32 Los Angeles, CA | 2.0 | 1.0 | 958 | $3,595 | $3.75 | 19d | 1 | 0.44mi |
| 3200 Weldon Ave Unit 3200 Los Angeles, CA | 2.0 | 1.0 | 600 | $2,500 | $4.17 | 24d | 1 | 0.46mi |
| 3245 Drew St Los Angeles, CA | 1.0 | 1.0 | 650 | $2,169 | $3.34 | 21d | 1 | 0.47mi |
| 3330 Chapman St Los Angeles, CA | 1.0 | 1.0 | 530 | $1,850 | $3.49 | 3d | 1 | 0.51mi |
| 3173 1/2 Verdugo Pl Los Angeles, CA | 1.0 | 1.0 | 640 | $2,800 | $4.38 | 22d | 1 | 0.51mi |
| 3173 1/2 Verdugo Pl Los Angeles, CA | 1.0 | 1.0 | 640 | $2,800 | $4.38 | 44d | 1 | 0.51mi |
| 2561 West Avenue 30 Unit G Glassell Park, CA | 2.0 | 1.0 | 820 | $2,695 | $3.29 | 44d | 1 | 0.52mi |
| 2561 W Avenue 30 Los Angeles, CA | 2.0 | 1.0 | 820 | $2,695 | $3.29 | 44d | 1 | 0.52mi |
| 2561 West Avenue 30 Apt 5 Glassell Park, CA | 2.0 | 1.0 | 820 | $2,695 | $3.29 | 44d | 1 | 0.52mi |
| 2561 West Avenue 30 Unit 7 Glassell Park, CA | 2.0 | 1.0 | 820 | $2,695 | $3.29 | 44d | 1 | 0.52mi |
| 2361 Moss Ave Unit 1/4 Glassell Park, CA | 1.0 | 1.0 | 750 | $2,395 | $3.19 | 24d | 1 | 0.53mi |
| 2910 N San Fernando Rd Los Angeles, CA | 1.0–3.0 | 1.0–2.5 | 1001 | $2,558 | $2.56 | 2d | 172 | 0.53mi |
| 3232 West Avenue 32 Unit 11 Los Angeles, CA | 2.0 | 2.0 | 875 | $2,430 | $2.78 | 44d | 1 | 0.55mi |
| 3030 Valle Vista Dr #13 Los Angeles, CA | 2.0 | 1.0 | 575 | $2,350 | $4.09 | 44d | 1 | 0.59mi |
| 3757 York Blvd Los Angeles, CA | 2.0 | 2.0 | 1106 | $4,400 | $3.98 | 8d | 1 | 0.64mi |
| 3125 Carlyle St Los Angeles, CA | 2.0–3.0 | 1.0–2.0 | 950 | $2,595 | $2.73 | 24d | 1 | 0.65mi |
| 2227 West Avenue 33 Unit 218 Los Angeles, CA | 1.0 | 1.0 | 600 | $1,650 | $2.75 | 44d | 1 | 0.69mi |
| 3116 Casitas Ave Los Angeles, CA | 2.0 | 1.0 | 700 | $2,600 | $3.71 | 44d | 1 | 0.71mi |
| 4124 Eagle Rock Blvd Los Angeles, CA | 1.0 | 1.0 | 640 | $2,195 | $3.43 | 5d | 1 | 0.72mi |
| 3047 Perlita Ave Los Angeles, CA | 1.0 | 1.0 | 700 | $2,995 | $4.28 | 5d | 1 | 0.77mi |
| 4140 Verdugo Rd Unit 6 Glassell Park, CA | 1.0 | 1.0 | 650 | $1,875 | $2.88 | 44d | 1 | 0.77mi |
| 2980 Allesandro St Unit 205 Los Angeles, CA | — | 1.0 | 680 | $2,500 | $3.68 | 44d | 1 | 0.83mi |
| 2980 Allesandro St Unit 206 Los Angeles, CA | — | 1.0 | 660 | $2,550 | $3.86 | 44d | 1 | 0.83mi |
| 2980 Allesandro St Unit 408 Los Angeles, CA | — | 1.0 | 649 | $2,795 | $4.31 | 44d | 1 | 0.84mi |
| 2980 Allesandro St Unit 402 Los Angeles, CA | — | 1.0 | 668 | $2,650 | $3.97 | 24d | 1 | 0.84mi |
| 4221 Verdugo Rd Los Angeles, CA | 1.0–2.0 | 1.0 | 725 | $2,250 | $3.10 | 2d | 4 | 0.85mi |
Listing history 24 events
-
2026-06-18days on market $800,000 Active 29 DOM
-
2026-06-17days on market $800,000 Active 28 DOM
-
2026-06-16days on market $800,000 Active 27 DOM
-
2026-06-15days on market $800,000 Active 26 DOM
-
2026-06-13days on market $800,000 Active 24 DOM
-
2026-06-09days on market $800,000 Active 20 DOM
-
2026-06-08days on market $800,000 Active 19 DOM
-
2026-06-07days on market $800,000 Active 18 DOM
-
2026-06-04days on market $800,000 Active 15 DOM
-
2026-06-03days on market $800,000 Active 14 DOM
-
2026-06-02days on market $800,000 Active 13 DOM
-
2026-06-01days on market $800,000 Active 12 DOM
-
2026-05-31days on market $800,000 Active 11 DOM
-
2026-05-19$800,000 Active
-
2024-06-28status Active
-
2024-05-30status Active
-
2023-09-15$850,000 Active
-
2022-10-05historical
-
2022-06-16status Active
-
2022-06-11historical Active Under Contract
-
2022-06-01$905,000 Active
-
2006-11-12historical
-
2006-06-05$645,000
-
1976-10-07soldstatus $32,000
ⓘ Source: listings_history table (triggers on properties + properties_extension) + one-shot
backfill from property_details.listing_events for pre-trigger history.
Climate risk First Street
- Flood 1/10 Low FEMA zone X (unshaded) · 0% chance over 30 yrs
- Wildfire 1/10 Low
- Heat 6/10 Major 7 d/yr ≥97°F today · 22 d/yr by 30 yrs out
- Wind 1/10 Low
- Air quality 6/10 Major 11 unhealthy d/yr today · 12 by 30 yrs out
Nearby sold comps map
Loading sold comps map…
Walkable amenities ~0.75 mi
Loading nearby amenities…
Taxation est. · year 1
- Rental income
- $102,156
- − Mortgage interest
- −$44,812
- − Property taxes
- −$12,000
- − Insurance
- −$4,000
- − Repairs & maintenance
- −$8,172
- − Management
- −$8,172
- − Depreciation
- −$23,273
- Taxable income
- $1,726
- Est. tax owed @ 24.0%
- −$414
- After-tax cash flow
- $13,946/yr
For passive investors: Depreciation is non-cash, so a rental often shows a tax loss while cash-flowing — sheltering income. Rental losses are passive: they offset passive income freely, and up to $25,000/yr can offset ordinary (W-2) income if you actively participate and your MAGI is under $100k (phasing out to $0 by $150k); unused losses carry forward. On sale, claimed depreciation is recaptured at up to 25%, and gains may owe capital-gains tax (a 1031 exchange can defer both). Figures are a year-1 estimate at your 24.0% rate — not tax advice; consult a CPA.
Schools (NCES district)
- District
- Los Angeles Unified
- NCES district ID
- 0622710
- Math proficiency
- 29% ▼ -4.00%
- Reading proficiency
- 54% ▲ 10.00%
- Median HH income
- $50,403
- Composite
- 35.67/100
- National rank
- #4875
- State rank
- #223 of 517 in CA
Livability — Los Angeles
- Score
- 68/100
- State rank
- #273
- US rank
- #9237
Category grades
Schools grade is shown separately in the Schools card above.
Census & demographics
- Census place
- Los Angeles, CA
- County
- Los Angeles County · 9,444,647 people
- City population
- 3,838,149
- Metro
- Los Angeles-Long Beach-Anaheim, CA
- Population (ZIP)
- 44,658
- Household income
- $94,784
- Rent vs Own
- Severe rent burden
- 2198.0
Population outlook (Los Angeles County) Hauer SSP2
- Today (2025)
- 10,940,515 people
- By 2030
- 11,256,481 · +2.9%
- By 2040
- 11,729,929 · +7.2%
- By 2050
- 11,948,407 · +9.2%
- By 2075
- 11,818,114 · +8.0%
- By 2100
- 10,842,928 · -0.9%
Race, ethnicity, and origin ACS 2023
- Neighborhood character
- Diverse neighborhood (Simpson 0.63)
- Race & ethnicity
- Hispanic / Latino 52% White 27% Two or more races 20% Asian 13% Native American 3% Black 2%
- Hispanic origin (detail)
- Mexican 37%
- Common ancestry
- Slovak 3% Scotch-Irish 1% Lithuanian 1%
- Foreign-born
- 36% · Canada, China, South Korea
- Languages at home
- 45% English-only · Spanish 41% Tagalog/Filipino 5% Other Indo-European 3%
Political lean MEDSL · Los Angeles
- 2024 margin
- Solid D (+32.9) · D 64.8% · R 31.9% · Other 3.3%
- 2008→2024 swing
- -7.4pp toward R · 2008: 40.4pp · 2024: 32.9pp
- All cycles
- 2024: D+32.9 2020: D+44.2 2016: D+48.0 2012: D+40.0 2008: D+40.4
Not yet ingested
- Civics
- —
Market trends
- HPI YoY
- ▼ -1578.12%
- Current HPI
- 536.5042
- Rent YoY
- ▲ 0.21%
- Metro
- Los Angeles-Long Beach-Anaheim, CA
- State GDP YoY
- ▲ 3.21%
- F500 in state
- 116
Industry mix (Fortune 500 HQ in CA)
| Industry | F500 HQs | Revenue |
|---|---|---|
| Technology | 27 | $1,492B |
|
||
| Financial Services | 3 | $174B |
|
||
| Retail | 3 | $44B |
|
||
| Insurance | 3 | $26B |
|
||
| Media / Entertainment | 2 | $115B |
|
||
| Pharmaceuticals / Biotech | 2 | $62B |
|
||
Price history
+2400.0% since first listed11 events — show timeline
- 2026-05-19 Listed $800,000 TheMLS
- 2024-06-28 Relisted — CRMLS
- 2024-05-30 Relisted — CRMLS
- 2023-09-15 Listed $850,000 CRMLS
- 2022-10-05 Listing Removed — CRMLS
- 2022-06-16 Relisted — CRMLS
- 2022-06-11 Contingent — CRMLS
- 2022-06-01 Listed $905,000 CRMLS
- 2006-11-12 Listing Removed — CRMLS
- 2006-06-05 Listed $645,000 CRMLS
- 1976-10-07 Sold (Public Records) $32,000 Public Records
Property tax history
+2.1%/yrLatest (2025): $1,348 · +3.0% YoY. Source: county tax records.
Cash-flow waterfall
monthlySold comps — $/sqft
last 12 mo · ≤1 miLoading sold comps…