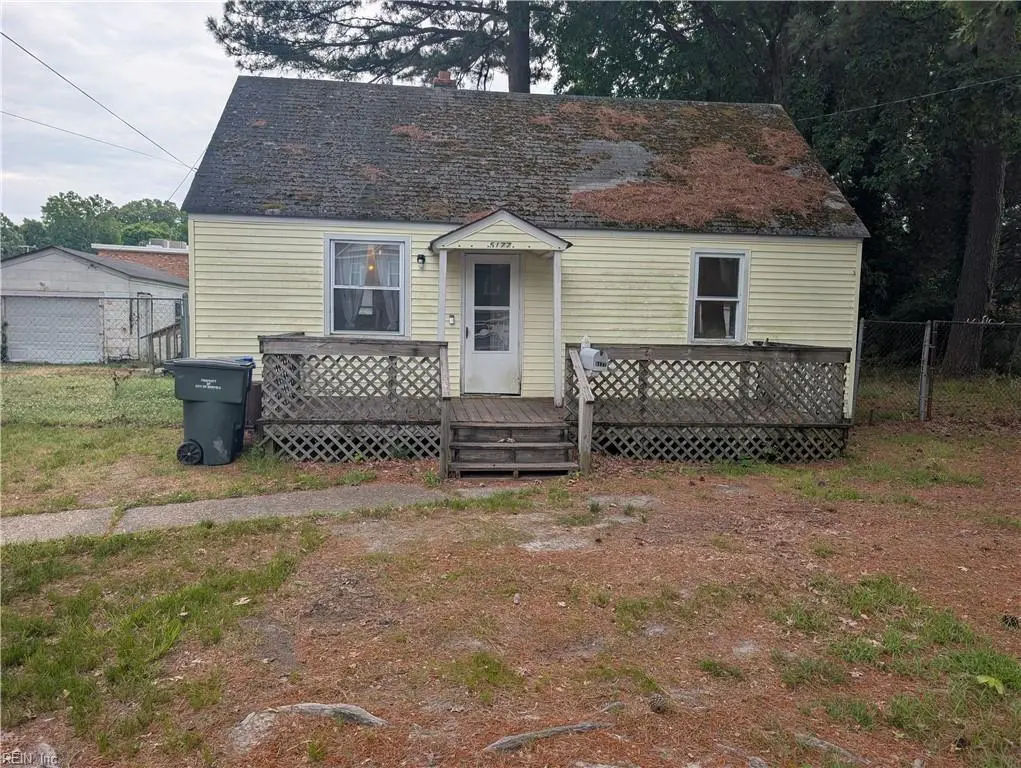
5177 Windermere Ave · Norfolk, VA
Flood risk 1/10 · Minimal
- FEMA flood zone
- X (unshaded)
- Chance of flooding over 30 yrs
- 0.0%
- Est. flood insurance / yr
- $507 – $1,088
Fire risk 1/10 · Minimal
- Est. fire insurance / yr
- $666 – $1,236
Heat risk 9/10 · Severe
- Hot days now (above 105°F)
- 7 days/yr
- Hot days in 30 yrs
- 16 days/yr
Wind risk 8/10 · Major
- Chance of severe wind over 30 yrs
- 80.0%
Air-quality risk 3/10 · Minor
- Unhealthy air days now
- 2 days/yr
- Unhealthy air days in 30 yrs
- 3 days/yr
Risk factors via First Street. Map © Google.
Why this score? — see what drove the D grade
The composite is a weighted blend of 9 inputs, each scored 0–100. Each bar is that input's sub-score; the figure is the points it added to the 100-point composite (weight × sub-score).
- ARV discount +15.0/15.0
- Cash flow +9.4/30.0
- Livability +4.2/5.0
- Schools +3.5/10.0
- Rent growth +3.4/5.0
- 1% rule +3.3/10.0
- DSCR +2.6/10.0
- Condition / age +2.5/5.0
- Appreciation +0.0/10.0
$170,000
🖨 Deal sheet (PDF) 📄 Offer letter ✓ Due diligence
Listing remarks
Investor Special/ Fixer Upper Opportunity to add value! Solid structure with potential. Good for renovation or take advantage of the lot size. Priced to sell. Property sold as-is. Cash or renovation loans.
Key facts
- Lot size
- Solid structure
- 0.27 acre lot
Tags
Property features AI
Finance
- HOA & community: No HOA fees
Exterior
- Parking: Detached 1-car garage; Driveway parking; Street parking
- Utilities: City/County water; City/County sewer; Electric water heater
- Home design: Detached ranch-style home; Single-story
- Construction: Crawl space foundation
- Exterior features: Vinyl siding; Back yard fenced with chain link fence; Asphalt shingle roof
Interior
- Kitchen: Electric range
- Bedrooms: At least one bedroom on the first floor
- Flooring: Wood
- Bathrooms: 1 full bathroom
- Heating & cooling: Baseboard heating
- Interior features: Wood flooring; Bedroom and full bathroom on the first floor; 5 total rooms
- Laundry & utility: Washer hookup; Dryer hookup
Neighborhood map
What this means for you Summary
Snapshot
- This is a 2-bed/1.0-bath single-family listed at $170k.
Deal economics
- At list price, monthly cash flow is $-121 ($-1k/yr) — negative.
- To cash-flow at today's rent, offer at most $149k (12.5% below list).
- To meet the 1% rule (rent ≥ 1% of price), the offer needs to be $141k (17.2% below list).
- Recommended offer: $141k (17.2% below list) — sets the bar for 1% rule.
- Cap rate 5.4% vs local median 4.0% in Norfolk — top-decile yield for the area; either an underpriced asset or a hidden risk that comps aren't pricing in. Stress-test before assuming the spread holds.
Location & tenants
- Location reads 83/100 on livability (#43 in VA, #1,026 nationally) — a professional / high-income tenant draw. Strengths: amenities A+, commute A+, health & safety A+; Watch: employment C-, crime F.
- Norfolk City Public School District (urban): math 27% / reading 56% proficiency, ranked #118 of 131 in VA (top 90%) — families likely to look elsewhere, expect single-tenant / working-renter base with shorter leases.
- Zoned schools: Sherwood Forest Elementary (math 27% / reading 52%, grade F, #900 of 1,108 statewide, top 83%, 480 students, 98% FRL); Norview Middle (math 19% / reading 54%, grade F, #320 of 342 statewide, top 95%, 1,259 students, 89% FRL); Booker T Washington High (math 26% / reading 70%, grade D, #303 of 319 statewide, top 95%, 947 students, 94% FRL) — zoned schools average 94% FRL vs 59% district-wide (35 pts higher); higher-poverty schools than district average — tighter screening recommended.
- Market conditions: Rents rising (+3.4%/yr); 135 active listings in the ZIP; 39 comparable units currently listed for rent nearby; rentals at typical pace (median 23d on market — plan ~3-4 weeks tenant-placement turnaround); 438 units permitted in Norfolk city in 2024 (273 in 5+ unit buildings).
Forward outlook
- Local home prices are declining (-3.0%/yr); year-one equity from $1k of loan paydown is wiped out by about $5k of value loss. Plan a longer hold.
Negotiation context
- Only 2 days on market — expect competitive offers; lowballing is unlikely to land.
- Current owner paid $109k; list at $170k implies a 56% gain — meaningful room to come down on a strong offer.
Risks & watch-outs
- Watch-outs: built in 1947 — expect roof / HVAC / electrical / plumbing capex.
- Climate carrying-cost: severe wind risk, 80% chance of damaging wind over 30y; extreme-heat days projected 7→16/yr by 2055 (HVAC capex compounding) — expect insurance premiums to compound above CPI over the hold.
Questions for the listing agent
- What do current leases actually rent for vs. the listed asking? Can we see a recent rent roll and the last 12 months of T-12 income?
- Built in 1947 — when were the roof, HVAC, electrical panel, plumbing, and water heater last replaced?
- Is there a deadline driving the sale (1031 exchange, divorce, estate, relocation)? That informs how much negotiation room exists.
- Schools are A-rated — typically a magnet for longer-tenancy family renters. What's the average tenant stay here, and is there a school-zone premium baked into asking?
- Crime grade is F in this area — have there been break-ins, vandalism, or insurance claims at this property in the last 3 years? What carrier currently insures it and at what premium?
- The area grade is low — what's the realistic commute time and amenity access for the typical tenant pool here? Any planned neighborhood developments (good or bad) we should know about?
- What's the average days-on-market for RENTAL listings here right now (not sales)? A rising rental-DOM trend means longer vacancies and softer asking-rent achievability than the comps imply.
- What's the recent tenant-quality profile in this submarket — average credit score on applications, eviction rate, late-payment / NSF rate, and stable-employment percentage? A property-management company in the area should have these aggregated.
- How much new for-sale + rental construction is in the pipeline within 1–3 miles? Heavy new supply typically softens prices + rents 12–24 months out; constrained supply supports both.
Investment metrics
- 1% rule
- 0.83% ✗
- Cap rate
- 5.44%
- Cash-on-cash
- -3.04%
- DSCR
- 0.86
- GRM
- 10.1
CMA / ARV
- ARV (median comp)
- $261,811
- List price
- $170,000
- Delta
- -35.07%
- Verdict
- UNDERPRICED
- Comps
- 20 within 1.0 mi
Show comp detail 12 sales within ~0.75 mi
| Address | Dist | Beds/Ba | Sqft | Sold | Price | $/sf | Match |
|---|---|---|---|---|---|---|---|
| 5230 Texas Ave | 0.28mi | 3/1.0 (+1) | 922 (-4%) | 8mo | $255,000 | $277 | 68 |
| 3513 Bertha St | 0.46mi | 3/1.0 (+1) | 1,000 (+4%) | 3mo | $297,000 | $297 | 65 |
| 4833 Kennebeck Ave | 0.37mi | 3/1.0 (+1) | 928 (-4%) | 9mo | $250,000 | $269 | 64 |
| 3308 Hyde Cir | 0.52mi | 2/1.0 | 919 (-5%) | 7mo | $210,000 | $229 | 62 |
| 3429 Johns St | 0.15mi | 3/2.0 (+1) | 1,065 (+10%) | 8mo | $320,000 | $300 | 60 |
| 5200 Texas Ave | 0.25mi | 3/1.5 (+1) | 1,100 (+14%) | 7mo | $234,000 | $213 | 52 |
| 1345 Strand St | 0.70mi | 2/2.0 | 1,000 (+4%) | 7mo | $250,000 | $250 | 51 |
| 3029 Dayton Ct | 0.45mi | 3/1.0 (+1) | 864 (-10%) | 7mo | $252,000 | $292 | 51 |
| 5756 Azalea Garden Rd | 0.69mi | 3/1.0 (+1) | 1,020 (+6%) | 6mo | $330,000 | $324 | 48 |
| 4832 Hampshire Ave | 0.55mi | 2/1.0 | 834 (-14%) | 6mo | $225,000 | $270 | 47 |
| 6131 Alexander St | 0.65mi | 3/2.0 (+1) | 1,032 (+7%) | 3mo | $231,610 | $224 | 46 |
| 4741 Krick St | 0.74mi | 3/1.5 (+1) | 1,050 (+9%) | 0mo | $185,000 | $176 | 44 |
Match score weights: distance 35% · size 25% · config 20% · recency 20%. Top-matched comps best support the ARV.
Projected returns pro-forma
-3.0% appreciation · 3.42% rent growth · sell at horizon
- IRR
- -20.8%
- Equity multiple
- 0.27×
- Total profit
- $-34,577
- Equity at exit
- $25,348
- IRR
- -13.1%
- Equity multiple
- 0.22×
- Total profit
- $-37,302
- Equity at exit
- $14,698
Cash invested: $47,600 (down + closing). Projections, not guarantees.
Landlord ↔ Tenant lean methodology
- Overall (STATE)
- 55 Moderately Landlord-Leaning
- State Virginia
- 55 Moderately Landlord-Leaning · D+2
- County
- — inherits STATE
- City
- — inherits STATE
ZIP-level market 23513
- Home prices YoY
- -9.3%
- Rents YoY
- 3.4%
- Active inventory
- 135
- Price-to-rent
- 10.1×
Monthly cashflow live
- Estimated rent
- $1,407 high interval (Pro) →
- Mortgage (P&I)
- −$891
- Tax from tax record
- −$270 /mo · $3,241/yr
- Insurance
- −$71
- HOA
- −$0
- Vacancy / Maint / Mgmt
- −$296
- Net cashflow
- $-121
Break-even live
Sensitivity live
| Price | -10% $-24 | -5% $-73 | +0% $-121 | +5% $-169 | +10% $-217 |
|---|---|---|---|---|---|
| Rent | -10% $-232 | -5% $-176 | +0% $-121 | +5% $-65 | +10% $-9 |
| Rate | -1.0pp $-35 | -0.5pp $-77 | base $-121 | +0.5pp $-165 | +1.0pp $-210 |
UW: 25.0% down · 7.5% · 30yr · 1.5% tax · 5.0% vac · 8.0% maint · 8.0% mgmt
Financing live
Cash to close
- Down payment
- $42,500
- Closing costs
- $5,100
- Reserves months
- —
- Total cash needed
- —
Loan-product check · same deal, 3 products live
Conventional
25% down · 7.5% · 30yr
- Down + closing
- —
- Monthly P&I
- —
- Monthly cashflow
- —
- DSCR
- —
- Eligible?
- —
Personal DTI + credit; lowest rate.
DSCR
20% down · 8.5% · 30yr
- Down + closing
- —
- Monthly P&I
- —
- Monthly cashflow
- —
- DSCR
- —
- Eligible?
- —
No personal income docs; deal must DSCR.
Hard money
10% down · 12.0% · 12mo
- Down + closing
- —
- Monthly P&I
- —
- Monthly cashflow
- —
- DSCR
- —
- Eligible?
- —
Short-term bridge; refi at stabilization.
Rent comps 39 comps
| Address | Beds | Baths | Sqft | Rent | $/sqft | DOM | Units | Dist |
|---|---|---|---|---|---|---|---|---|
| 2707 Azalea Garden Rd Apt B3 Norfolk, VA | 2.0 | 1.0 | 680 | $1,195 | $1.76 | 25d | 1 | 0.38mi |
| 3475 Azalea Garden Rd Norfolk, VA | 1.0 | 1.0 | 700 | $995 | $1.42 | 45d | 1 | 0.44mi |
| 3044 Sewells Point Rd Norfolk, VA | 2.0 | 1.0 | 830 | $1,134 | $1.37 | 3d | 1 | 0.48mi |
| 4802 Norvella Ave Unit 1 Norfolk, VA | 2.0 | 1.0 | 800 | $1,050 | $1.31 | 9d | 1 | 0.54mi |
| 2640 Azalea Garden Rd Norfolk, VA | 3.0 | 1.5 | 1100 | $2,150 | $1.95 | 5d | 1 | 0.61mi |
| 3326 Sandy St Norfolk, VA | 3.0 | 1.0 | 1040 | $1,695 | $1.63 | 4d | 1 | 0.61mi |
| 4745 Lind St Unit A Norfolk, VA | 2.0 | 1.0 | 1000 | $1,600 | $1.60 | 45d | 1 | 0.65mi |
| 4745 Lind St Unit B Norfolk, VA | 2.0 | 1.0 | 752 | $1,350 | $1.80 | 3d | 1 | 0.65mi |
| 1232 Norview Ave Unit NOR1232R-EA Norfolk, VA | 3.0 | 2.0 | 1106 | $1,600 | $1.45 | 45d | 1 | 0.66mi |
| 6225 Alexander St Norfolk, VA | 2.0 | 1.0 | 750 | $1,299 | $1.73 | 45d | 1 | 0.74mi |
| 6225 Alexander St Unit F Norfolk, VA | 2.0 | 1.0 | 750 | $1,499 | $2.00 | 22d | 1 | 0.75mi |
| 1721 Norview Ave Norfolk, VA | 1.0 | 1.0 | 800 | $1,150 | $1.44 | 45d | 1 | 0.76mi |
| 6241 Alexander St Unit F Norfolk, VA | 2.0 | 1.0 | 704 | $895 | $1.27 | 14d | 1 | 0.77mi |
| 6249 Alexander St Unit C Norfolk, VA | 2.0 | 1.0 | 817 | $1,195 | $1.46 | 19d | 1 | 0.78mi |
| 6249 Alexander St Unit F Norfolk, VA | 2.0 | 1.0 | 817 | $1,195 | $1.46 | 5d | 1 | 0.78mi |
| 6249 Alexander St Unit C Norfolk, VA | 2.0 | 1.0 | 817 | $1,195 | $1.46 | 25d | 1 | 0.78mi |
| 6228 Chesapeake Blvd Unit G Norfolk, VA | 2.0 | 1.0 | 885 | $925 | $1.05 | 45d | 1 | 0.80mi |
| 6234 Chesapeake Blvd Norfolk, VA | 2.0 | 1.0 | 986 | $925 | $0.94 | 19d | 1 | 0.82mi |
| 2412 Azalea Garden Rd Unit 212 Norfolk, VA | 1.0 | 1.0 | 800 | $1,025 | $1.28 | 45d | 1 | 0.88mi |
| 2412 Azalea Garden Rd Apt 210 Norfolk, VA | 2.0 | 1.0 | 950 | $1,325 | $1.39 | 45d | 1 | 0.88mi |
| 2412 Azalea Garden Rd Unit 105 Norfolk, VA | 2.0 | 1.0 | 950 | $1,325 | $1.39 | 25d | 1 | 0.88mi |
| 4566 Hampshire Ave Unit A Norfolk, VA | 2.0 | 1.0 | 870 | $1,350 | $1.55 | 45d | 1 | 0.89mi |
| 3820 Essex Cir Unit A Norfolk, VA | 2.0 | 1.0 | 1000 | $2,200 | $2.20 | 23d | 1 | 0.94mi |
| 3820 Essex Cir #1 Norfolk, VA | 2.0 | 1.0 | 1000 | $2,250 | $2.25 | 19d | 1 | 0.94mi |
| 3820 Essex Cir Unit B 1 Norfolk, VA | 2.0 | 1.0 | 900 | $1,700 | $1.89 | 23d | 1 | 0.94mi |
| 2403 Sewells Point Rd Unit 3 Norfolk, VA | 1.0 | 1.0 | 600 | $950 | $1.58 | 45d | 1 | 0.95mi |
| 6343 Chesapeake Blvd Apt communities Norfolk, VA | 2.0 | 1.0 | 750 | $1,099 | $1.47 | 23d | 1 | 0.98mi |
| 6450 Crescent Way Norfolk, VA | 1.0–3.0 | 1.0–2.0 | 1128 | $2,069 | $1.83 | 4d | 23 | 1.01mi |
| 6340 Sewells Point Rd Apt communities Norfolk, VA | 2.0 | 1.0 | 750 | $1,099 | $1.47 | 23d | 1 | 1.01mi |
| 4852 E Princess Anne Rd Norfolk, VA | 1.0 | 1.0 | 700 | $1,099 | $1.57 | 19d | 1 | 1.10mi |
| 4670 Kincaid Ave Apt E Norfolk, VA | 2.0 | 1.0 | 800 | $1,250 | $1.56 | 4d | 1 | 1.11mi |
| 1445 Norcova Ave Apt E Norfolk, VA | 2.0 | 1.0 | 750 | $1,125 | $1.50 | 45d | 1 | 1.12mi |
| 1524 Longdale Dr Norfolk, VA | 1.0 | 1.0 | 650 | $1,350 | $2.08 | 5d | 1 | 1.17mi |
| 3801 Chatham Cir Unit 2 Norfolk, VA | 2.0 | 1.0 | 1100 | $1,350 | $1.23 | 9d | 1 | 1.23mi |
| 4505 Cape Henry Ave Norfolk, VA | 2.0 | 1.0 | 720 | $1,000 | $1.39 | 45d | 1 | 1.23mi |
| 1371 E Norcova Dr Norfolk, VA | 2.0 | 1.0 | 967 | $1,750 | $1.81 | 9d | 1 | 1.29mi |
| 3872 Wake Cir Unit A Norfolk, VA | 2.0 | 1.0 | 750 | $1,395 | $1.86 | 4d | 1 | 1.35mi |
| 3872 Wake Cir Unit A Norfolk, VA | 2.0 | 1.0 | 750 | $1,395 | $1.86 | 45d | 1 | 1.35mi |
| 3400 Lafayette Blvd #2 Norfolk, VA | 2.0 | 1.0 | 800 | $1,350 | $1.69 | 4d | 1 | 1.45mi |
Listing history 3 events
-
2026-05-09status Under Contract 205-char remark
-
2026-05-07$170,000 Active 205-char remark
-
2005-07-07soldstatus $109,000
ⓘ Source: listings_history table (triggers on properties + properties_extension) + one-shot
backfill from property_details.listing_events for pre-trigger history.
Tax reassessment forecast VA · Resets to sale price
- Current annual tax
- $3,241 · $270/mo
- Projected year-2 tax
- $3,241 · $270/mo
- Expected delta
- $0/yr ($0/mo · -0.0%)
ⓘ Screening estimate from a state-policy table — verify with the county assessor before closing.
Climate risk First Street
- Flood 1/10 Low FEMA zone X (unshaded) · 0% chance over 30 yrs
- Wildfire 1/10 Low
- Heat 9/10 Extreme 7 d/yr ≥105°F today · 16 d/yr by 30 yrs out
- Wind 8/10 Severe 80% chance of damaging wind over 30 yrs
- Air quality 3/10 Moderate 2 unhealthy d/yr today · 3 by 30 yrs out
Nearby sold comps map
Loading sold comps map…
Walkable amenities ~0.75 mi
Loading nearby amenities…
Taxation est. · year 1
- Rental income
- $16,888
- − Mortgage interest
- −$9,523
- − Property taxes
- −$3,241
- − Insurance
- −$850
- − Repairs & maintenance
- −$1,351
- − Management
- −$1,351
- − Depreciation
- −$4,945
- Taxable loss
- −$4,373
- Est. tax savings @ 24.0%
- +$1,050
- After-tax cash flow
- $-398/yr
For passive investors: Depreciation is non-cash, so a rental often shows a tax loss while cash-flowing — sheltering income. Rental losses are passive: they offset passive income freely, and up to $25,000/yr can offset ordinary (W-2) income if you actively participate and your MAGI is under $100k (phasing out to $0 by $150k); unused losses carry forward. On sale, claimed depreciation is recaptured at up to 25%, and gains may owe capital-gains tax (a 1031 exchange can defer both). Figures are a year-1 estimate at your 24.0% rate — not tax advice; consult a CPA.
Schools (NCES district)
- District
- Norfolk City Public School District
- NCES district ID
- 5102670
- Math proficiency
- 27% ▼ -44.00%
- Reading proficiency
- 56% ▼ -10.00%
- Median HH income
- $44,358
- Composite
- 35.08/100
- National rank
- #5026
- State rank
- #118 of 131 in VA
Livability — Norfolk
- Score
- 83/100
- State rank
- #43
- US rank
- #1026
Category grades
Schools grade is shown separately in the Schools card above.
Census & demographics
- Census place
- Norfolk, VA
- County
- Norfolk City · 214,042 people
- City population
- 214,042
- Metro
- Virginia Beach-Norfolk-Newport News, VA-NC
- Population (ZIP)
- 28,628
- Household income
- $68,380
- Rent vs Own
- Severe rent burden
- 1342.0
Population outlook (Norfolk County) Hauer SSP2
- Today (2025)
- 249,032 people
- By 2030
- 252,347 · +1.3%
- By 2040
- 253,644 · +1.9%
- By 2050
- 251,913 · +1.2%
- By 2075
- 245,281 · -1.5%
- By 2100
- 219,548 · -11.8%
Race, ethnicity, and origin ACS 2023
- Neighborhood character
- Diverse neighborhood (Simpson 0.63)
- Race & ethnicity
- Black 55% White 23% Hispanic / Latino 11% Two or more races 7% Asian 5%
- Hispanic origin (detail)
- Mexican 4% Puerto Rican 3%
- Common ancestry
- Romanian 1% Slovak 1% Lithuanian 0%
- Foreign-born
- 10% · Canada
- Languages at home
- 87% English-only · Spanish 6% Tagalog/Filipino 4% French/Haitian/Cajun 1%
Political lean MEDSL · Norfolk
- 2024 margin
- Solid D (+41.5) · D 70.0% · R 28.5% · Other 1.6%
- 2008→2024 swing
- -1.4pp toward R · 2008: 43.0pp · 2024: 41.5pp
- All cycles
- 2024: D+41.5 2020: D+45.6 2016: D+42.0 2012: D+44.0 2008: D+43.0
Not yet ingested
- Civics
- —
Market trends
- HPI YoY
- ▼ -33.67%
- Current HPI
- 329.2241
- Rent YoY
- ▲ 3.42%
- Metro
- Virginia Beach-Norfolk-Newport News, VA-NC
- State GDP YoY
- ▲ 2.40%
- F500 in state
- 50
Industry mix (Fortune 500 HQ in VA)
| Industry | F500 HQs | Revenue |
|---|---|---|
| Aerospace / Defense | 4 | $236B |
|
||
| Technology / Defense | 3 | $32B |
|
||
| Financial Services | 2 | $176B |
|
||
| Utilities | 2 | $27B |
|
||
| Insurance | 2 | $25B |
|
||
| Technology | 2 | $15B |
|
||
Price history
+56.0% since first listed3 events — show timeline
- 2026-05-09 Pending — REINMLS
- 2026-05-07 Listed $170,000 REINMLS
- 2005-07-07 Sold (Public Records) $109,000 Public Records
Property tax history
+5.6%/yrLatest (2025): $3,241 · +0.9% YoY. Source: county tax records.
Cash-flow waterfall
monthlySold comps — $/sqft
last 12 mo · ≤1 miLoading sold comps…