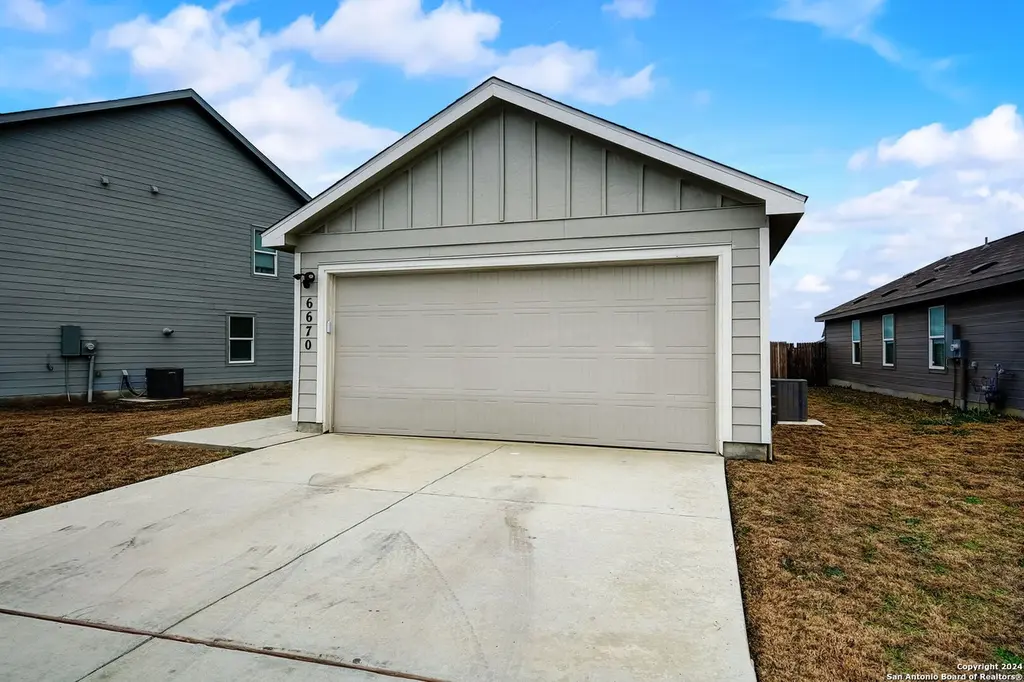
6670 Arid Way · San Antonio, TX
Flood risk 1/10 · Minimal
- FEMA flood zone
- X (unshaded)
- Chance of flooding over 30 yrs
- 0.0%
- Est. flood insurance / yr
- $507 – $1,088
Fire risk 5/10 · Moderate
- Est. fire insurance / yr
- $1,222 – $2,270
Heat risk 8/10 · Major
- Hot days now (above 109°F)
- 7 days/yr
- Hot days in 30 yrs
- 22 days/yr
Wind risk 8/10 · Major
- Chance of severe wind over 30 yrs
- 80.0%
Air-quality risk 2/10 · Minimal
- Unhealthy air days now
- 0 days/yr
- Unhealthy air days in 30 yrs
- 1 days/yr
Risk factors via First Street. Map © Google.
Why this score? — see what drove the D- grade
The composite is a weighted blend of 9 inputs, each scored 0–100. Each bar is that input's sub-score; the figure is the points it added to the 100-point composite (weight × sub-score).
- ARV discount +9.4/15.0
- Cash flow +6.8/30.0
- Appreciation +5.0/10.0
- Schools +4.4/10.0
- Livability +4.0/5.0
- Rent growth +2.5/5.0
- Condition / age +2.5/5.0
- 1% rule +1.3/10.0
- DSCR +1.0/10.0
$249,999
🖨 Deal sheet 📄 Offer letter ✓ Due diligence
Listing remarks MLS
Perched atop a hill overlooking San Antonio sits a 3-bedroom, 2-bath oasis. This gently lived-in home is ready for its new owner, boasting a stainless steel gas range, an open living dining space, an included fridge, a washer, a dryer, and an irrigation system. Neighborhood amenities include a clubhouse, pool, park, playground, and a 24-hour gym! Silos Elementary School is under construction and set to open in 2024!"
Key facts
- 24-hour gym
- 5,706 sq ft lot
- 2 garage spots
Tags
Neighborhood map
What this means for you Summary
Snapshot
- This is a 3-bed/2.0-bath single-family listed at $250k.
Deal economics
- At list price, monthly cash flow is $-387 ($-5k/yr) — negative.
- To cash-flow at today's rent, offer at most $182k (27.4% below list).
- To meet the 1% rule (rent ≥ 1% of price), the offer needs to be $157k (37.4% below list).
- Recommended offer: $157k (37.4% below list) — sets the bar for 1% rule.
Location & tenants
- Location reads 80/100 on livability (#31 in TX, #1,616 nationally) — a professional / high-income tenant draw. Strengths: amenities A+, commute A+, cost of living A+; Watch: schools C-, crime F.
- Medina Valley ISD (rural): math 48% / reading 53% proficiency, ranked #148 of 826 in TX (top 18%) — acceptable for families but not a draw, mixed tenant base, ~2y average lease.
- Market conditions: 1 active listings in the ZIP; 40 comparable units currently listed for rent nearby; rentals at typical pace (median 24d on market — plan ~3-4 weeks tenant-placement turnaround); 8,308 units permitted in Bexar County in 2024 (2,506 in 5+ unit buildings).
Forward outlook
- In year one you build about $9k of equity ($2k loan paydown + $8k appreciation (3.0% local appreciation)).
- Bexar County population projected at +50% by 2050 — long-run rental-demand tailwind backs the buy-and-hold thesis.
- By year 4, paydown + projected appreciation supports a ~$31k cash-out refi (75% LTV) — recoverable capital for the next deal without selling this one.
Negotiation context
- It's been on market 680 days — a 12% lower offer ($220k) is reasonable based on typical stale-listing flexibility.
- 2 sale attempts since 2y ago with the ask held roughly flat each time — persistent listings suggest the price (not the market) is what's stuck; bring a comps-based counter.
Risks & watch-outs
- Climate carrying-cost: severe wind risk, 80% chance of damaging wind over 30y; moderate wildfire risk; extreme-heat days projected 7→22/yr by 2055 (HVAC capex compounding) — expect insurance premiums to compound above CPI over the hold.
Questions for the listing agent
- What do current leases actually rent for vs. the listed asking? Can we see a recent rent roll and the last 12 months of T-12 income?
- It's been on market 680 days. Have you received any prior offers? Is the seller open to a 37% concession, seller financing, or rate buy-down credit?
- What does the HOA fee cover, when was the last increase, and are there any pending special assessments or reserve-fund shortfalls?
- Why hasn't it sold? Are there any deal-killer items the seller is aware of (foundation, flood, title, zoning, code violations)?
- Is there a deadline driving the sale (1031 exchange, divorce, estate, relocation)? That informs how much negotiation room exists.
- Crime grade is F in this area — have there been break-ins, vandalism, or insurance claims at this property in the last 3 years? What carrier currently insures it and at what premium?
- The area grade is low — what's the realistic commute time and amenity access for the typical tenant pool here? Any planned neighborhood developments (good or bad) we should know about?
- What's the average days-on-market for RENTAL listings here right now (not sales)? A rising rental-DOM trend means longer vacancies and softer asking-rent achievability than the comps imply.
- What's the recent tenant-quality profile in this submarket — average credit score on applications, eviction rate, late-payment / NSF rate, and stable-employment percentage? A property-management company in the area should have these aggregated.
- How much new for-sale + rental construction is in the pipeline within 1–3 miles? Heavy new supply typically softens prices + rents 12–24 months out; constrained supply supports both.
Investment metrics
- 1% rule
- 0.63% ✗
- Cap rate
- 4.43%
- Cash-on-cash
- -6.64%
- DSCR
- 0.70
- GRM
- 13.3
CMA / ARV
- ARV (median comp)
- $260,923
- List price
- $249,999
- Delta
- -4.19%
- Verdict
- FAIR
- Comps
- 20 within 1.0 mi
Show comp detail 12 sales within ~0.75 mi
| Address | Dist | Beds/Ba | Sqft | Sold | Price | $/sf | Match |
|---|---|---|---|---|---|---|---|
| 13947 Bull | 0.29mi | 3/2.0 | 1,276 (0%) | 2mo | $189,900 | $149 | 85 |
| 13903 Silos Mdws | 0.19mi | 3/2.0 | 1,276 (0%) | 10mo | $225,000 | $176 | 83 |
| 13819 Buffalo Vly | 0.22mi | 3/2.0 | 1,266 (-1%) | 21mo | $211,999 | $167 | 71 |
| 7258 Plow Run | 0.52mi | 3/2.0 | 1,300 (+2%) | 3mo | $245,000 | $188 | 70 |
| 13857 Llama Pl | 0.53mi | 3/2.0 | 1,300 (+2%) | 8mo | $230,000 | $177 | 66 |
| 14114 Silos Mdws | 0.31mi | 3/2.0 | 1,450 (+14%) | 7mo | $239,000 | $165 | 57 |
| 6619 Legato Curv | 0.53mi | 3/2.0 | 1,156 (-9%) | 3mo | $220,000 | $190 | 57 |
| 13608 Whisper Xing | 0.58mi | 3/2.0 | 1,156 (-9%) | 4mo | $224,900 | $195 | 54 |
| 14128 Feed Park | 0.27mi | 3/2.0 | 1,458 (+14%) | 15mo | $240,000 | $165 | 52 |
| 7227 Plow Run | 0.47mi | 3/2.0 | 1,462 (+15%) | 3mo | $160,440 | $110 | 51 |
| 7250 Plow Run | 0.51mi | 3/2.0 | 1,125 (-12%) | 9mo | $205,000 | $182 | 49 |
| 13927 Birch Vw | 0.74mi | 3/2.0 | 1,412 (+11%) | 15mo | $269,990 | $191 | 35 |
Match score weights: distance 35% · size 25% · config 20% · recency 20%. Top-matched comps best support the ARV.
Projected returns pro-forma
3.0% appreciation · 3.0% rent growth · sell at horizon
- IRR
- 1.3%
- Equity multiple
- 1.08×
- Total profit
- $5,404
- Equity at exit
- $112,410
- IRR
- 5.0%
- Equity multiple
- 1.77×
- Total profit
- $53,798
- Equity at exit
- $173,238
Cash invested: $70,000 (down + closing). Projections, not guarantees.
Landlord ↔ Tenant lean methodology
- Overall (STATE)
- 87 Strongly Landlord-Friendly
- State Texas
- 87 Strongly Landlord-Friendly · R+5
- County
- — inherits STATE
- City
- — inherits STATE
ZIP-level market 78252-4477
- Active inventory
- 1
- Price-to-rent
- 13.3×
Monthly cashflow live
- Estimated rent
- $1,566 high interval (Pro) →
- Mortgage (P&I)
- −$1,311
- Tax from tax record
- −$149 /mo · $1,790/yr
- Insurance
- −$104
- HOA
- −$60
- Vacancy / Maint / Mgmt
- −$329
- Net cashflow
- $-387
Break-even live
UW: 25.0% down · 7.5% · 30yr · 1.5% tax · 5.0% vac · 8.0% maint · 8.0% mgmt
Financing live
Cash to close
- Down payment
- $62,500
- Closing costs
- $7,500
- Reserves months
- —
- Total cash needed
- —
Loan-product check · same deal, 3 products live
Conventional
25% down · 7.5% · 30yr
- Down + closing
- —
- Monthly P&I
- —
- Monthly cashflow
- —
- DSCR
- —
- Eligible?
- —
Personal DTI + credit; lowest rate.
DSCR
20% down · 8.5% · 30yr
- Down + closing
- —
- Monthly P&I
- —
- Monthly cashflow
- —
- DSCR
- —
- Eligible?
- —
No personal income docs; deal must DSCR.
Hard money
10% down · 12.0% · 12mo
- Down + closing
- —
- Monthly P&I
- —
- Monthly cashflow
- —
- DSCR
- —
- Eligible?
- —
Short-term bridge; refi at stabilization.
Rent comps 40 comps
| Address | Beds | Baths | Sqft | Rent | $/sqft | DOM | Units | Dist |
|---|---|---|---|---|---|---|---|---|
| 6683 Arid Way San Antonio, TX | 3.0 | 2.0 | 1440 | $1,500 | $1.04 | 23d | 1 | 0.05mi |
| 6638 Arid Way San Antonio, TX | 4.0 | 2.0 | 1627 | $1,479 | $0.91 | 4d | 1 | 0.05mi |
| 6728 Beehive Dr San Antonio, TX | 3.0 | 2.0 | 1675 | $1,596 | $0.95 | 12d | 1 | 0.09mi |
| 6603 Arid Way San Antonio, TX | 3.0 | 2.0 | 1440 | $1,506 | $1.05 | 43d | 1 | 0.11mi |
| 6524 Arid Way San Antonio, TX | 4.0 | 2.0 | 1657 | $1,556 | $0.94 | 23d | 1 | 0.12mi |
| 6515 Scarecrow Way San Antonio, TX | 4.0 | 2.0 | 1627 | $1,565 | $0.96 | 23d | 1 | 0.13mi |
| 6512 Arid Way San Antonio, TX | 4.0 | 2.0 | 1687 | $1,671 | $0.99 | 23d | 1 | 0.15mi |
| 6511 Arid Way San Antonio, TX | 4.0 | 2.5 | 1687 | $1,700 | $1.01 | 12d | 1 | 0.16mi |
| 13930 Silos Mdws San Antonio, TX | 4.0 | 2.0 | 1616 | $1,650 | $1.02 | 12d | 1 | 0.22mi |
| 13922 Wool Park San Antonio, TX | 3.0 | 2.0 | 1416 | $1,450 | $1.02 | 23d | 1 | 0.25mi |
| 6741 Hatchery Way San Antonio, TX | 3.0 | 2.0 | 1675 | $1,811 | $1.08 | 43d | 1 | 0.28mi |
| 6738 Hatchery Way San Antonio, TX | 3.0 | 2.0 | 1459 | $1,585 | $1.09 | 43d | 1 | 0.28mi |
| 6734 Hatchery Way San Antonio, TX | 3.0 | 2.0 | 1675 | $1,741 | $1.04 | 43d | 1 | 0.29mi |
| 6432 Pickaxe Way San Antonio, TX | 3.0 | 2.0 | 1276 | $1,285 | $1.01 | 17d | 1 | 0.33mi |
| 6432 Pickaxe Way San Antonio, TX | 3.0 | 2.0 | 1266 | $1,351 | $1.07 | 23d | 1 | 0.33mi |
| 6711 Hatchery Way San Antonio, TX | 3.0 | 2.0 | 1459 | $1,606 | $1.10 | 12d | 1 | 0.33mi |
| 7214 Cultivator Way San Antonio, TX | 3.0 | 2.0 | 1125 | $1,395 | $1.24 | 43d | 1 | 0.37mi |
| 7226 Cultivator Way San Antonio, TX | 3.0 | 2.0 | 1300 | $1,497 | $1.15 | 23d | 1 | 0.39mi |
| 6522 Vivaldi Isle San Antonio, TX | 3.0 | 2.0 | 1325 | $1,500 | $1.13 | 43d | 1 | 0.40mi |
| 13727 Barn Door San Antonio, TX | 3.0 | 2.0 | 1474 | $1,800 | $1.22 | 23d | 1 | 0.41mi |
| 6835 Capriccio Spirit San Antonio, TX | 3.0 | 2.5 | 1512 | $1,700 | $1.12 | 21d | 1 | 0.45mi |
| 7410 Silos Rdg San Antonio, TX | 3.0 | 2.0 | 1026 | $1,195 | $1.16 | 23d | 1 | 0.47mi |
| 7218 Ox Pl San Antonio, TX | 4.0 | 2.0 | 1492 | $1,495 | $1.00 | 2d | 1 | 0.47mi |
| 7218 Ox Pl San Antonio, TX | 4.0 | 2.0 | 1492 | $1,495 | $1.00 | 21d | 1 | 0.47mi |
| 7427 Silos Trl San Antonio, TX | 3.0 | 2.0 | 1082 | $1,500 | $1.39 | 43d | 1 | 0.49mi |
| 7218 Duck Pond San Antonio, TX | 4.0 | 2.0 | 1492 | $1,575 | $1.06 | 21d | 1 | 0.49mi |
| 13802 Ostrich Run San Antonio, TX | 3.0 | 2.0 | 1300 | $1,600 | $1.23 | 17d | 1 | 0.50mi |
| 7216 Pasture Run San Antonio, TX | 4.0 | 2.0 | 1647 | $1,525 | $0.93 | 4d | 1 | 0.51mi |
| 7411 Donkey Vly San Antonio, TX | 3.0 | 2.0 | 1125 | $1,700 | $1.51 | 43d | 1 | 0.52mi |
| 7258 Plow Run San Antonio, TX | 3.0 | 2.0 | 1300 | $1,575 | $1.21 | 43d | 1 | 0.52mi |
| 7258 Plow Run San Antonio, TX | 3.0 | 2.0 | 1300 | $1,475 | $1.13 | 23d | 1 | 0.52mi |
| 7415 Donkey Vly San Antonio, TX | 3.0 | 2.0 | 1225 | $1,500 | $1.22 | 43d | 1 | 0.52mi |
| 6614 Dynamic Sound San Antonio, TX | 3.0 | 2.0 | 1192 | $1,500 | $1.26 | 3d | 1 | 0.53mi |
| 6614 Dynamic Sound San Antonio, TX | 3.0 | 2.0 | 1192 | $1,500 | $1.26 | 43d | 1 | 0.53mi |
| 7231 Duck Pond San Antonio, TX | 4.0 | 2.0 | 1492 | $1,750 | $1.17 | 4d | 1 | 0.53mi |
| 7247 Ox Pl San Antonio, TX | 3.0 | 2.0 | 1300 | $1,800 | $1.38 | 4d | 1 | 0.53mi |
| 6304 Masterson Rd Unit 2294 San Antonio, TX | 2.0 | 2.0 | 1158 | $1,897 | $1.64 | 3d | 1 | 0.57mi |
| 6304 Masterson Rd Unit 3294 San Antonio, TX | 3.0 | 2.0 | 1463 | $2,209 | $1.51 | 3d | 1 | 0.57mi |
| 6548 Dynamic Sound San Antonio, TX | 3.0 | 2.0 | 1323 | $1,495 | $1.13 | 23d | 1 | 0.59mi |
| 14234 Llama Pl San Antonio, TX | 3.0 | 2.0 | 1244 | $1,500 | $1.21 | 43d | 1 | 0.61mi |
HOA detail
- Monthly dues
- $60 · $720/yr
- Likely covers
- gaspoolgym
Listing history 17 events
-
2026-06-18days on market $249,999 Active 680 DOM
-
2026-06-17days on market $249,999 Active 679 DOM
-
2026-06-16days on market $249,999 Active 678 DOM
-
2026-06-15days on market $249,999 Active 677 DOM
-
2026-06-13days on market $249,999 Active 675 DOM
-
2026-06-09days on market $249,999 Active 671 DOM
-
2026-06-08days on market $249,999 Active 670 DOM
-
2026-06-07days on market $249,999 Active 669 DOM
-
2026-06-04days on market $249,999 Active 666 DOM
-
2026-06-03days on market $249,999 Active 665 DOM
-
2026-06-02days on market $249,999 Active 664 DOM
-
2026-06-02days on market $249,999 Active 663 DOM
-
2026-05-31days on market $249,999 Active 662 DOM
-
2025-08-02price $249,999 425-char remark
Show marketing remark (425 chars)
Perched atop a hill overlooking San Antonio sits a 3-bedroom, 2-bath oasis. This gently lived-in home is ready for its new owner, boasting a stainless steel gas range, an open living dining space, an included fridge, a washer, a dryer, and an irrigation system. Neighborhood amenities include a clubhouse, pool, park, playground, and a 24-hour gym! Silos Elementary School is under construction and set to open in 2024!"
-
2024-08-07$259,999 New 425-char remark
Show marketing remark (425 chars)
Perched atop a hill overlooking San Antonio sits a 3-bedroom, 2-bath oasis. This gently lived-in home is ready for its new owner, boasting a stainless steel gas range, an open living dining space, an included fridge, a washer, a dryer, and an irrigation system. Neighborhood amenities include a clubhouse, pool, park, playground, and a 24-hour gym! Silos Elementary School is under construction and set to open in 2024!"
-
2024-08-07historical
Show marketing remark (425 chars)
Perched atop a hill overlooking San Antonio sits a 3-bedroom, 2-bath oasis. This gently lived-in home is ready for its new owner, boasting a stainless steel gas range, an open living dining space, an included fridge, a washer, a dryer, and an irrigation system. Neighborhood amenities include a clubhouse, pool, park, playground, and a 24-hour gym! Silos Elementary School is under construction and set to open in 2024!"
-
2024-02-02$259,999 New
ⓘ Source: listings_history table (triggers on properties + properties_extension) + one-shot
backfill from property_details.listing_events for pre-trigger history.
Tax reassessment forecast TX · Resets to sale price
- Current annual tax
- $1,790 · $149/mo
- Projected year-2 tax
- $4,575 · $381/mo
- Expected delta
- +$2,785/yr (+$232/mo · 155.6%)
ⓘ Screening estimate from a state-policy table — verify with the county assessor before closing.
Climate risk First Street
- Flood 1/10 Low FEMA zone X (unshaded) · 0% chance over 30 yrs
- Wildfire 5/10 Major
- Heat 8/10 Severe 7 d/yr ≥109°F today · 22 d/yr by 30 yrs out
- Wind 8/10 Severe 80% chance of damaging wind over 30 yrs
- Air quality 2/10 Low 0 unhealthy d/yr today · 1 by 30 yrs out
Nearby sold comps map
Loading sold comps map…
Walkable amenities ~0.75 mi
Loading nearby amenities…
Taxation est. · year 1
- Rental income
- $18,790
- − Mortgage interest
- −$14,004
- − Property taxes
- −$1,790
- − Insurance
- −$1,250
- − Repairs & maintenance
- −$1,503
- − Management
- −$1,503
- − HOA
- −$720
- − Depreciation
- −$7,273
- Taxable loss
- −$9,253
- Est. tax savings @ 24.0%
- +$2,221
- After-tax cash flow
- $-2,428/yr
For passive investors: Depreciation is non-cash, so a rental often shows a tax loss while cash-flowing — sheltering income. Rental losses are passive: they offset passive income freely, and up to $25,000/yr can offset ordinary (W-2) income if you actively participate and your MAGI is under $100k (phasing out to $0 by $150k); unused losses carry forward. On sale, claimed depreciation is recaptured at up to 25%, and gains may owe capital-gains tax (a 1031 exchange can defer both). Figures are a year-1 estimate at your 24.0% rate — not tax advice; consult a CPA.
Schools (NCES district)
- District
- Medina Valley ISD
- NCES district ID
- 4830060
- Math proficiency
- 48% ▼ -9.00%
- Reading proficiency
- 53% ▼ -2.00%
- Median HH income
- $60,596
- Composite
- 44.2/100
- National rank
- #2851
- State rank
- #148 of 826 in TX
Livability — San Antonio
- Score
- 80/100
- State rank
- #31
- US rank
- #1616
Category grades
Schools grade is shown separately in the Schools card above.
Census & demographics
No demographic data for this ZIP.
Market trends
- HPI YoY
- —
- Current HPI
- —
- Rent YoY
- —
- Metro
- —
- State GDP YoY
- ▲ 3.95%
- F500 in state
- 110
Industry mix (Fortune 500 HQ in TX)
| Industry | F500 HQs | Revenue |
|---|---|---|
| Energy | 16 | $1,198B |
|
||
| Technology | 5 | $198B |
|
||
| Engineering / Construction | 4 | $72B |
|
||
| Energy Services | 3 | $60B |
|
||
| Utilities | 3 | $41B |
|
||
| Healthcare | 2 | $330B |
|
||
Price history
-3.8% since first listed4 events — show timeline
- 2025-08-02 Price Changed $249,999 LERA
- 2024-08-07 Listing Removed — LERA
- 2024-08-07 Listed $259,999 LERA
- 2024-02-02 Listed $259,999 LERA
Property tax history
-19.7%/yrLatest (2025): $1,790 · -60.1% YoY. Source: county tax records.
Cash-flow waterfall
monthlySold comps — $/sqft
last 12 mo · ≤1 miLoading sold comps…