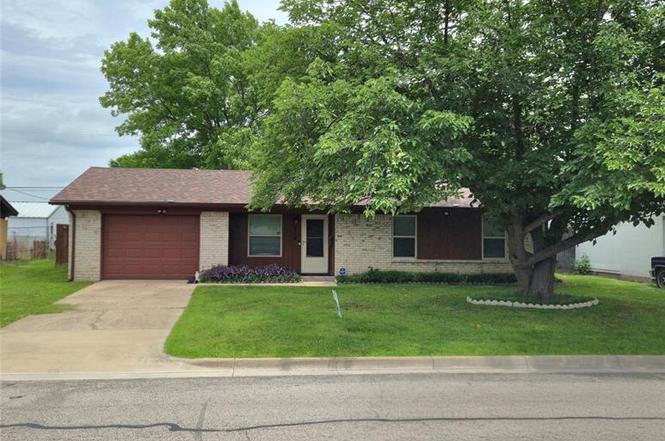
714 Catherine Ln · Seagoville, TX
Flood risk 1/10 · Minimal
- FEMA flood zone
- X (unshaded)
- Chance of flooding over 30 yrs
- 0.0%
- Est. flood insurance / yr
- $507 – $1,088
Fire risk 4/10 · Minor
- Est. fire insurance / yr
- $1,222 – $2,270
Heat risk 7/10 · Major
- Hot days now (above 110°F)
- 7 days/yr
- Hot days in 30 yrs
- 24 days/yr
Wind risk 6/10 · Moderate
- Chance of severe wind over 30 yrs
- 27.0%
Air-quality risk 2/10 · Minimal
- Unhealthy air days now
- 1 days/yr
- Unhealthy air days in 30 yrs
- 1 days/yr
Risk factors via First Street. Map © Google.
Why this score? — see what drove the D- grade
The composite is a weighted blend of 9 inputs, each scored 0–100. Each bar is that input's sub-score; the figure is the points it added to the 100-point composite (weight × sub-score).
- Cash flow +14.0/30.0
- 1% rule +4.5/10.0
- DSCR +4.3/10.0
- ARV discount +4.2/15.0
- Livability +3.6/5.0
- Schools +2.8/10.0
- Condition / age +2.5/5.0
- Rent growth +1.8/5.0
- Appreciation +0.0/10.0
$215,000
🖨 Deal sheet (PDF) 📄 Offer letter ✓ Due diligence
Listing remarks
New Roof, Electric & Sewer! Ultimate peace of mind in this meticulously maintained 3-bedroom, 1-bathroom home. Unlike other homes in this price range, this property has been stripped of future to-do lists thanks to a list of recent improvements. Brand new roof 2026, all new electrical system, including panel, outlets, and plugs, and a fully replaced sewer line with a city clean-out. New windows and doors throughout. The home comes equipped with a full security system, sensors on all doors and windows. The refrigerator, washer, and dryer are all included. Enjoy a extra large, private backyard perfect for entertaining, complete with motion-activated security lighting. Ideally situated j
Key facts
- New doors
- Full security system
- New roof
Tags
Property features AI
Finance
- Other: Municipal Utility District not present
- Financial info: Listing accepts Cash, Conventional, FHA, and VA financing; Listing is Active Under Contract
- HOA & community: No association
Exterior
- Parking: Driveway; Attached garage (1 covered space/1 garage space)
- Security: Audio and video surveillance present
- Utilities: City water; City sewer; Electricity available; Cable available
- Home design: Single-family residence; Residential property; One story; Preowned (built in 1972); Deed restrictions
- Construction: Brick construction; Composition roof; Slab foundation; Built in 1972
- Exterior features: Wood fencing; Lot smaller than 0.5 acre
Interior
- Kitchen: Built-in cabinets; Eat-in kitchen; Solid surface countertops (non-natural); Water line to refrigerator; Disposal; Electric range; Refrigerator
- Bedrooms: 3 bedrooms (all on the main level); Primary bedroom includes a walk-in closet
- Flooring: Carpet; Simulated wood flooring
- Bathrooms: 1 full bathroom
- Heating & cooling: Central heating (electric); Central air conditioning (electric)
- Interior features: Cable TV available; Eat-in kitchen; High-speed internet available; 5 total rooms; One living area; One dining area; One level
- Laundry & utility: Washer; Dryer; Electric water heater
Neighborhood map
What this means for you Summary
Snapshot
- This is a 3-bed/1.0-bath single-family listed at $215k.
Deal economics
- At list price, monthly cash flow is $29 ($347/yr) — positive.
- The deal already cash-flows at list — no discount required.
- To meet the 1% rule (rent ≥ 1% of price), the offer needs to be $204k (5.2% below list).
- Recommended offer: $204k (5.2% below list) — sets the bar for 1% rule.
- Cap rate 6.5% vs local median 5.1% in Seagoville — meaningfully above typical; check what's discounted (condition, days-on-market, listing class) to confirm the premium yield is real.
Location & tenants
- Location reads 71/100 on livability (#319 in TX) — a middle-class / working-renter tenant base. Strengths: cost of living A+, housing A+, crime A; Watch: amenities F, commute F, health & safety D-.
- Dallas ISD (urban): math 31% / reading 36% proficiency, ranked #559 of 826 in TX (top 68%) — families likely to look elsewhere, expect single-tenant / working-renter base with shorter leases; 83% free/reduced lunch — lower-income household profile, screen leases tightly.
- Zoned schools: Central El (math 58% / reading 52%, grade C, #602 of 4,322 statewide, top 14%, 516 students, 92% FRL); Seagoville Middle (math 18% / reading 23%, grade F, #1,407 of 1,662 statewide, top 86%, 1,419 students, 88% FRL); Seagoville H S (math 15% / reading 21%, grade F, #1,445 of 1,632 statewide, top 89%, 1,779 students, 87% FRL).
- Market conditions: Rents soft (-2.9%/yr); 282 active listings in the ZIP; 3 comparable units currently listed for rent nearby; rentals leasing fast (median 5d on market — plan ~1-2 weeks tenant-placement turnaround); 12,577 units permitted in Dallas County in 2024 (6,829 in 5+ unit buildings).
- This rent runs 34% of the median local income ($73k/yr) — at the standard rent-burdened threshold; future hikes will face affordability resistance.
Forward outlook
- Local home prices are declining (-3.0%/yr); year-one equity from $1k of loan paydown is wiped out by about $6k of value loss. Plan a longer hold.
- Dallas County population projected at +35% by 2050 — long-run rental-demand tailwind backs the buy-and-hold thesis.
Negotiation context
- It's been on market 33 days — a 3% lower offer ($209k) is reasonable based on typical stale-listing flexibility.
Risks & watch-outs
- Climate carrying-cost: major wind risk, 27% chance of damaging wind over 30y; extreme-heat days projected 7→24/yr by 2055 (HVAC capex compounding) — expect insurance premiums to compound above CPI over the hold.
Questions for the listing agent
- It's been on market 33 days. Have you received any prior offers? Is the seller open to a 5% concession, seller financing, or rate buy-down credit?
- Built in 1972 — when were the roof, HVAC, electrical panel, plumbing, and water heater last replaced?
- Is there a deadline driving the sale (1031 exchange, divorce, estate, relocation)? That informs how much negotiation room exists.
- Schools are D-rated, which usually means shorter tenancies and higher turnover. Who's the typical renter profile here, and what's been the actual vacancy rate?
- The area grade is low — what's the realistic commute time and amenity access for the typical tenant pool here? Any planned neighborhood developments (good or bad) we should know about?
- What's the average days-on-market for RENTAL listings here right now (not sales)? A rising rental-DOM trend means longer vacancies and softer asking-rent achievability than the comps imply.
- What's the recent tenant-quality profile in this submarket — average credit score on applications, eviction rate, late-payment / NSF rate, and stable-employment percentage? A property-management company in the area should have these aggregated.
- How much new for-sale + rental construction is in the pipeline within 1–3 miles? Heavy new supply typically softens prices + rents 12–24 months out; constrained supply supports both.
Investment metrics
- 1% rule
- 0.95% ✗
- Cap rate
- 6.45%
- Cash-on-cash
- 0.58%
- DSCR
- 1.03
- GRM
- 8.8
CMA / ARV
- ARV (on-the-fly)
- $200,304
- Comps found
- 6
Show comp detail 6 sales within ~0.75 mi
| Address | Dist | Beds/Ba | Sqft | Sold | Price | $/sf | Match |
|---|---|---|---|---|---|---|---|
| 824 Johnnie Row | 0.06mi | 3/1.5 | 1,022 (+9%) | 8mo | $199,900 | $196 | 73 |
| 730 High School Dr | 0.42mi | 3/1.0 | 1,033 (+10%) | 1mo | $165,000 | $160 | 62 |
| 736 Thedford Rd | 0.48mi | 3/1.5 | 1,027 (+10%) | 0mo | $150,000 | $146 | 59 |
| 1311 Crosscreek | 0.24mi | 3/1.0 | 1,065 (+14%) | 21mo | $230,000 | $216 | 49 |
| 815 Quinette Dr | 0.38mi | 3/2.0 | 1,016 (+8%) | 18mo | $250,000 | $246 | 48 |
| 728 Thedford Rd | 0.51mi | 3/1.5 | 1,062 (+14%) | 24mo | $227,500 | $214 | 32 |
Match score weights: distance 35% · size 25% · config 20% · recency 20%. Top-matched comps best support the ARV.
Projected returns pro-forma
-3.0% appreciation · 0.0% rent growth · sell at horizon
- IRR
- -19.0%
- Equity multiple
- 0.35×
- Total profit
- $-38,882
- Equity at exit
- $32,057
- IRR
- -19.9%
- Equity multiple
- 0.10×
- Total profit
- $-54,210
- Equity at exit
- $18,589
Cash invested: $60,200 (down + closing). Projections, not guarantees.
Landlord ↔ Tenant lean methodology
- Overall (STATE)
- 87 Strongly Landlord-Friendly
- State Texas
- 87 Strongly Landlord-Friendly · R+5
- County
- — inherits STATE
- City
- — inherits STATE
ZIP-level market 75159
- Home prices YoY
- -13.8%
- Rents YoY
- -2.9%
- Active inventory
- 282
- Price-to-rent
- 8.8×
Monthly cashflow live
- Estimated rent
- $2,039 medium interval (Pro) →
- Mortgage (P&I)
- −$1,127
- Tax from tax record
- −$365 /mo · $4,375/yr
- Insurance
- −$90
- HOA
- −$0
- Vacancy / Maint / Mgmt
- −$428
- Net cashflow
- $29
Break-even live
Sensitivity live
| Price | -10% $151 | -5% $90 | +0% $29 | +5% $-32 | +10% $-93 |
|---|---|---|---|---|---|
| Rent | -10% $-132 | -5% $-52 | +0% $29 | +5% $109 | +10% $190 |
| Rate | -1.0pp $137 | -0.5pp $84 | base $29 | +0.5pp $-27 | +1.0pp $-83 |
UW: 25.0% down · 7.5% · 30yr · 1.5% tax · 5.0% vac · 8.0% maint · 8.0% mgmt
Financing live
Cash to close
- Down payment
- $53,750
- Closing costs
- $6,450
- Reserves months
- —
- Total cash needed
- —
Loan-product check · same deal, 3 products live
Conventional
25% down · 7.5% · 30yr
- Down + closing
- —
- Monthly P&I
- —
- Monthly cashflow
- —
- DSCR
- —
- Eligible?
- —
Personal DTI + credit; lowest rate.
DSCR
20% down · 8.5% · 30yr
- Down + closing
- —
- Monthly P&I
- —
- Monthly cashflow
- —
- DSCR
- —
- Eligible?
- —
No personal income docs; deal must DSCR.
Hard money
10% down · 12.0% · 12mo
- Down + closing
- —
- Monthly P&I
- —
- Monthly cashflow
- —
- DSCR
- —
- Eligible?
- —
Short-term bridge; refi at stabilization.
Rent comps 3 comps
| Address | Beds | Baths | Sqft | Rent | $/sqft | DOM | Units | Dist |
|---|---|---|---|---|---|---|---|---|
| 702 Catherine Ln Seagoville, TX | 3.0 | 1.0 | 945 | $1,650 | $1.75 | 45d | 1 | 0.07mi |
| 521 Jean Dr Seagoville, TX | 3.0 | 2.0 | 1080 | $1,825 | $1.69 | 5d | 1 | 0.68mi |
| 108 US HWY Seagoville, TX | 1.0–3.0 | 1.0–2.5 | 1340 | $2,650 | $1.98 | 0d | 47 | 0.83mi |
Listing history 18 events
-
2026-06-18status $215,000 Pending 33 DOM
-
2026-06-18days on market $215,000 Active Contingent 33 DOM
-
2026-06-17days on market $215,000 Active Contingent 32 DOM
-
2026-06-16days on market $215,000 Active Contingent 31 DOM
-
2026-06-15days on market $215,000 Active Contingent 30 DOM
-
2026-06-13days on market $215,000 Active Contingent 28 DOM
-
2026-06-09days on market $215,000 Active Contingent 24 DOM
-
2026-06-08days on market $215,000 Active Contingent 23 DOM
-
2026-06-07days on market $215,000 Active Contingent 22 DOM
-
2026-06-04days on market $215,000 Active Contingent 19 DOM
-
2026-06-03days on market $215,000 Active Contingent 18 DOM
-
2026-06-02days on market $215,000 Active Contingent 17 DOM
-
2026-06-01days on market $215,000 Active Contingent 16 DOM
-
2026-05-31days on market $215,000 Active Contingent 15 DOM
-
2026-05-22historical Active Option Contract
-
2026-05-15$215,000 Active
-
2003-05-21soldstatus
-
1999-06-16soldstatus
ⓘ Source: listings_history table (triggers on properties + properties_extension) + one-shot
backfill from property_details.listing_events for pre-trigger history.
Tax reassessment forecast TX · Resets to sale price
- Current annual tax
- $4,375 · $365/mo
- Projected year-2 tax
- $4,375 · $365/mo
- Expected delta
- $0/yr ($0/mo · 0.0%)
ⓘ Screening estimate from a state-policy table — verify with the county assessor before closing.
Climate risk First Street
- Flood 1/10 Low FEMA zone X (unshaded) · 0% chance over 30 yrs
- Wildfire 4/10 Moderate
- Heat 7/10 Severe 7 d/yr ≥110°F today · 24 d/yr by 30 yrs out
- Wind 6/10 Major 27% chance of damaging wind over 30 yrs
- Air quality 2/10 Low 1 unhealthy d/yr today · 1 by 30 yrs out
Nearby sold comps map
Loading sold comps map…
Walkable amenities ~0.75 mi
Loading nearby amenities…
Taxation est. · year 1
- Rental income
- $24,464
- − Mortgage interest
- −$12,043
- − Property taxes
- −$4,375
- − Insurance
- −$1,075
- − Repairs & maintenance
- −$1,957
- − Management
- −$1,957
- − Depreciation
- −$6,255
- Taxable loss
- −$3,198
- Est. tax savings @ 24.0%
- +$767
- After-tax cash flow
- $1,115/yr
For passive investors: Depreciation is non-cash, so a rental often shows a tax loss while cash-flowing — sheltering income. Rental losses are passive: they offset passive income freely, and up to $25,000/yr can offset ordinary (W-2) income if you actively participate and your MAGI is under $100k (phasing out to $0 by $150k); unused losses carry forward. On sale, claimed depreciation is recaptured at up to 25%, and gains may owe capital-gains tax (a 1031 exchange can defer both). Figures are a year-1 estimate at your 24.0% rate — not tax advice; consult a CPA.
Schools (NCES district)
- District
- Dallas ISD
- NCES district ID
- 4816230
- Math proficiency
- 31% ▼ -16.00%
- Reading proficiency
- 36% ▼ -4.00%
- Median HH income
- $42,881
- Composite
- 28.41/100
- National rank
- #6763
- State rank
- #559 of 826 in TX
Livability — Seagoville
- Score
- 71/100
- State rank
- #319
- US rank
- #7103
Category grades
Schools grade is shown separately in the Schools card above.
Census & demographics
- Census place
- Seagoville, TX
- County
- Dallas County · 2,612,404 people
- City population
- 23,456
- Metro
- Dallas-Fort Worth-Arlington, TX
- Population (ZIP)
- 23,456
- Household income
- $72,897
- Rent vs Own
- Severe rent burden
- 422.0
Population outlook (Dallas County) Hauer SSP2
- Today (2025)
- 2,979,839 people
- By 2030
- 3,191,823 · +7.1%
- By 2040
- 3,619,611 · +21.5%
- By 2050
- 4,026,915 · +35.1%
- By 2075
- 4,957,073 · +66.4%
- By 2100
- 5,508,725 · +84.9%
Race, ethnicity, and origin ACS 2023
- Neighborhood character
- Diverse neighborhood (Simpson 0.66)
- Race & ethnicity
- Hispanic / Latino 46% White 32% Two or more races 20% Black 17%
- Hispanic origin (detail)
- Mexican 40%
- Common ancestry
- Romanian 1% Slovak 1% Italian 1%
- Foreign-born
- 17% · Canada, Jamaica
- Languages at home
- 63% English-only · Spanish 35%
Political lean MEDSL · Dallas
- 2024 margin
- Strong D (+22.2) · D 60.2% · R 38.0% · Other 1.8%
- 2008→2024 swing
- +6.9pp toward D · 2008: 15.3pp · 2024: 22.2pp
- All cycles
- 2024: D+22.2 2020: D+31.6 2016: D+26.2 2012: D+15.4 2008: D+15.3
Not yet ingested
- Civics
- —
Market trends
- HPI YoY
- ▼ -51.45%
- Current HPI
- 321.2065
- Rent YoY
- ▼ -2.86%
- Metro
- Dallas-Fort Worth-Arlington, TX
- State GDP YoY
- ▲ 3.95%
- F500 in state
- 110
Industry mix (Fortune 500 HQ in TX)
| Industry | F500 HQs | Revenue |
|---|---|---|
| Energy | 16 | $1,198B |
|
||
| Technology | 5 | $198B |
|
||
| Engineering / Construction | 4 | $72B |
|
||
| Energy Services | 3 | $60B |
|
||
| Utilities | 3 | $41B |
|
||
| Healthcare | 2 | $330B |
|
||
Price history
4 events — show timeline
- 2026-05-22 Contingent — NTREIS
- 2026-05-15 Listed $215,000 NTREIS
- 2003-05-21 Sold (Public Records) — Public Records
- 1999-06-16 Sold (Public Records) — Public Records
Property tax history
+6.2%/yrLatest (2025): $4,375 · +0.3% YoY. Source: county tax records.
Cash-flow waterfall
monthlySold comps — $/sqft
last 12 mo · ≤1 miLoading sold comps…