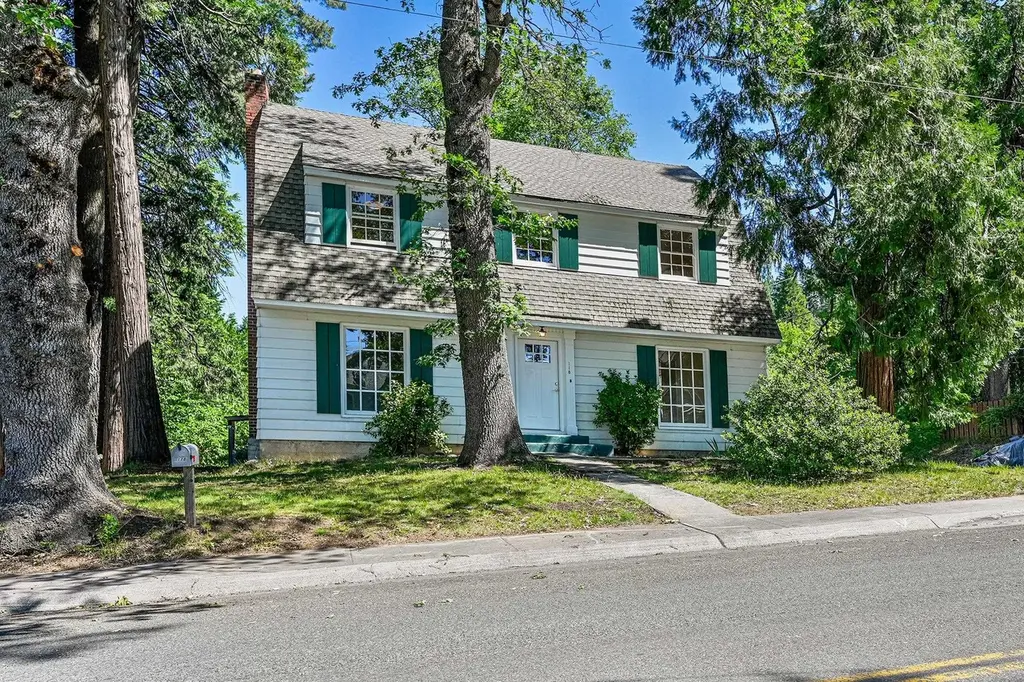
118 Ida St · Mount Shasta, CA
Flood risk 1/10 · Minimal
- FEMA flood zone
- X (unshaded)
- Chance of flooding over 30 yrs
- 0.0%
- Est. flood insurance / yr
- $507 – $1,088
Fire risk 5/10 · Moderate
- Est. fire insurance / yr
- $659 – $1,223
Heat risk 4/10 · Minor
- Hot days now (above 93°F)
- 8 days/yr
- Hot days in 30 yrs
- 18 days/yr
Wind risk 1/10 · Minimal
- Chance of severe wind over 30 yrs
- —
Air-quality risk 10/10 · Severe
- Unhealthy air days now
- 34 days/yr
- Unhealthy air days in 30 yrs
- 34 days/yr
Risk factors via First Street. Map © Google.
Why this score? — see what drove the C- grade
The composite is a weighted blend of 9 inputs, each scored 0–100. Each bar is that input's sub-score; the figure is the points it added to the 100-point composite (weight × sub-score).
- Cash flow +23.0/30.0
- ARV discount +7.5/15.0
- DSCR +7.4/10.0
- 1% rule +5.1/10.0
- Schools +3.6/10.0
- Livability +3.2/5.0
- Rent growth +2.5/5.0
- Condition / age +2.5/5.0
- Appreciation +0.0/10.0
$475,000
🖨 Deal sheet 📄 Offer letter ✓ Due diligence
Listing remarks MLS
This solidly built and perfectly charming Cap Cod is a fixer upper. Step inside, and immediately images of Black and white TV, dial phones, Father Knows Best and families who eat dinners together flood one's memories. The home evokes nostalgia. With 4 Bedrooms 2 baths, and a sewing room/office this home has plenty of space, and it is located in a great neighborhood. Kitchen has eating area. Full basement for game rooms? With good bones, the home requires some attention. Home inspection in Listing office.
Key facts
- Original oak floors
- Refreshed interior
- Modern heat pump
Tags
Property features AI
Finance
- Other: R1 zoning
Exterior
- Parking: 2-car garage; Gravel parking
- Utilities: Public water
- Home design: Single-family residence; 2-story
- Construction: Metal siding; Wood siding; Composition roof
- Exterior features: Garden; Shed(s)
Interior
- Kitchen: Dishwasher; Electric oven; Electric range; Refrigerator
- Bedrooms: Bedrooms located on various levels
- Flooring: Vinyl flooring; Wood flooring
- Interior features: Fireplace in the living room; Full basement
- Laundry & utility: Laundry in basement
Neighborhood map
What this means for you Summary
Snapshot
- This is a 4-bed/2.0-bath other listed at $475k.
Deal economics
- At list price, monthly cash flow is $843 ($10k/yr) — positive.
- The deal already cash-flows at list — no discount required.
- Meets the 1% rule at list price ($5k rent vs $475k).
- Cap rate 8.4% vs local median 4.8% in Mount Shasta — top-decile yield for the area; either an underpriced asset or a hidden risk that comps aren't pricing in. Stress-test before assuming the spread holds.
Location & tenants
- Location reads 64/100 on livability (#405 in CA) — a middle-class / working-renter tenant base. Strengths: health & safety A+; Watch: housing C-, employment D+, crime F.
- Siskiyou Union High (rural): math 25% / reading 55% proficiency, ranked #763 of 1,400 in CA (top 54%) — families likely to look elsewhere, expect single-tenant / working-renter base with shorter leases; only 12% free/reduced lunch — higher-income household profile.
- Market conditions: 116 active listings in the ZIP; 5 comparable units currently listed for rent nearby; rentals at typical pace (median 21d on market — plan ~3-4 weeks tenant-placement turnaround); 50 units permitted in Siskiyou County in 2024 (0 in 5+ unit buildings).
Forward outlook
- Local home prices are declining (-3.0%/yr); year-one equity from $3k of loan paydown is wiped out by about $14k of value loss. Plan a longer hold.
- Siskiyou County population projected at -26% by 2050 — secular population decline; favor cash flow + early exit over multi-decade hold.
Negotiation context
- Only 10 days on market — expect competitive offers; lowballing is unlikely to land.
- 2 sale attempts since 15y ago with the ask held roughly flat each time — persistent listings suggest the price (not the market) is what's stuck; bring a comps-based counter.
- Current owner paid $212k; list at $475k implies a 124% gain — meaningful room to come down on a strong offer.
Risks & watch-outs
- Watch-outs: built in 1940 — expect roof / HVAC / electrical / plumbing capex.
- Climate carrying-cost: moderate wildfire risk — expect insurance premiums to compound above CPI over the hold.
Questions for the listing agent
- Built in 1940 — when were the roof, HVAC, electrical panel, plumbing, and water heater last replaced?
- Is there a deadline driving the sale (1031 exchange, divorce, estate, relocation)? That informs how much negotiation room exists.
- Crime grade is F in this area — have there been break-ins, vandalism, or insurance claims at this property in the last 3 years? What carrier currently insures it and at what premium?
- What's the average days-on-market for RENTAL listings here right now (not sales)? A rising rental-DOM trend means longer vacancies and softer asking-rent achievability than the comps imply.
- What's the recent tenant-quality profile in this submarket — average credit score on applications, eviction rate, late-payment / NSF rate, and stable-employment percentage? A property-management company in the area should have these aggregated.
- How much new for-sale + rental construction is in the pipeline within 1–3 miles? Heavy new supply typically softens prices + rents 12–24 months out; constrained supply supports both.
Investment metrics
- 1% rule
- 1.01% ✓
- Cap rate
- 8.42%
- Cash-on-cash
- 7.60%
- DSCR
- 1.34
- GRM
- 8.3
CMA / ARV
No comps found within radius.
Projected returns pro-forma
-3.0% appreciation · 3.0% rent growth · sell at horizon
- IRR
- -4.7%
- Equity multiple
- 0.82×
- Total profit
- $-23,440
- Equity at exit
- $70,824
- IRR
- 4.9%
- Equity multiple
- 1.36×
- Total profit
- $48,118
- Equity at exit
- $41,069
Cash invested: $133,000 (down + closing). Projections, not guarantees.
Landlord ↔ Tenant lean methodology
- Overall (STATE)
- 18 Strongly Tenant-Friendly
- State California
- 18 Strongly Tenant-Friendly · D+13
- County
- — inherits STATE
- City
- — inherits STATE
ZIP-level market 96067
- Active inventory
- 116
- Price-to-rent
- 8.3×
Monthly cashflow live
- Estimated rent
- $4,776 high interval (Pro) →
- Mortgage (P&I)
- −$2,491
- Tax from tax record
- −$241 /mo · $2,897/yr
- Insurance
- −$198
- HOA
- −$0
- Vacancy / Maint / Mgmt
- −$1,003
- Net cashflow
- $843
Break-even live
UW: 25.0% down · 7.5% · 30yr · 1.5% tax · 5.0% vac · 8.0% maint · 8.0% mgmt
Financing live
Cash to close
- Down payment
- $118,750
- Closing costs
- $14,250
- Reserves months
- —
- Total cash needed
- —
Loan-product check · same deal, 3 products live
Conventional
25% down · 7.5% · 30yr
- Down + closing
- —
- Monthly P&I
- —
- Monthly cashflow
- —
- DSCR
- —
- Eligible?
- —
Personal DTI + credit; lowest rate.
DSCR
20% down · 8.5% · 30yr
- Down + closing
- —
- Monthly P&I
- —
- Monthly cashflow
- —
- DSCR
- —
- Eligible?
- —
No personal income docs; deal must DSCR.
Hard money
10% down · 12.0% · 12mo
- Down + closing
- —
- Monthly P&I
- —
- Monthly cashflow
- —
- DSCR
- —
- Eligible?
- —
Short-term bridge; refi at stabilization.
Rent comps 5 comps
| Address | Beds | Baths | Sqft | Rent | $/sqft | DOM | Units | Dist |
|---|---|---|---|---|---|---|---|---|
| 230 S Washington Dr Mount Shasta, CA | 3.0 | 3.0 | 1697 | $4,000 | $2.36 | 21d | 1 | 0.21mi |
| 1726 Cold Creek Cir Mount Shasta, CA | 3.0 | 3.0 | 2403 | $8,000 | $3.33 | 21d | 1 | 1.24mi |
| 940 Douglas Ln Mount Shasta, CA | 3.0 | 3.0 | 2526 | $6,000 | $2.38 | 21d | 1 | 1.31mi |
| Grant Rd Mt Shasta, CA | 3.0 | 2.5 | 1500 | $2,750 | $1.83 | 21d | 1 | 1.34mi |
| 700 N Old Stage Rd Mount Shasta, CA | 3.0 | 2.0 | 2527 | $6,750 | $2.67 | 13d | 1 | 1.50mi |
Listing history 8 events
-
2026-06-19days on market $475,000 Active 10 DOM
-
2026-06-18days on market $475,000 Active 9 DOM
-
2026-06-17days on market $475,000 Active 8 DOM
-
2026-06-16days on market $475,000 Active 7 DOM
-
2026-06-15days on market $475,000 Active 6 DOM
-
2026-06-14days on market $475,000 Active 4 DOM
-
2026-06-12remarks 669-char remark
-
2026-06-12$475,000 Active 3 DOM
ⓘ Source: listings_history table (triggers on properties + properties_extension) + one-shot
backfill from property_details.listing_events for pre-trigger history.
Tax reassessment forecast CA · Resets to sale price
- Current annual tax
- $2,897 · $241/mo
- Projected year-2 tax
- $3,610 · $301/mo
- Expected delta
- +$713/yr (+$59/mo · 24.6%)
ⓘ Screening estimate from a state-policy table — verify with the county assessor before closing.
Climate risk First Street
- Flood 1/10 Low FEMA zone X (unshaded) · 0% chance over 30 yrs
- Wildfire 5/10 Major
- Heat 4/10 Moderate 8 d/yr ≥93°F today · 18 d/yr by 30 yrs out
- Wind 1/10 Low
- Air quality 10/10 Extreme 34 unhealthy d/yr today · 34 by 30 yrs out
Nearby sold comps map
Loading sold comps map…
Walkable amenities ~0.75 mi
Loading nearby amenities…
Taxation est. · year 1
- Rental income
- $57,312
- − Mortgage interest
- −$26,607
- − Property taxes
- −$2,897
- − Insurance
- −$2,375
- − Repairs & maintenance
- −$4,585
- − Management
- −$4,585
- − Depreciation
- −$13,818
- Taxable income
- $2,444
- Est. tax owed @ 24.0%
- −$587
- After-tax cash flow
- $9,526/yr
For passive investors: Depreciation is non-cash, so a rental often shows a tax loss while cash-flowing — sheltering income. Rental losses are passive: they offset passive income freely, and up to $25,000/yr can offset ordinary (W-2) income if you actively participate and your MAGI is under $100k (phasing out to $0 by $150k); unused losses carry forward. On sale, claimed depreciation is recaptured at up to 25%, and gains may owe capital-gains tax (a 1031 exchange can defer both). Figures are a year-1 estimate at your 24.0% rate — not tax advice; consult a CPA.
Schools (NCES district)
- District
- Siskiyou Union High
- NCES district ID
- 0636940
- Math proficiency
- 25% ▲ 5.00%
- Reading proficiency
- 55% ▲ 5.00%
- Median HH income
- $39,293
- Composite
- 35.84/100
- National rank
- #9605
- State rank
- #763 of 1400 in CA
Livability — Mount Shasta
- Score
- 64/100
- State rank
- #405
- US rank
- #13833
Category grades
Schools grade is shown separately in the Schools card above.
Census & demographics
- Census place
- Mount Shasta, CA
- City population
- 7,800
- Population (ZIP)
- 7,800
Population outlook (Siskiyou County) Hauer SSP2
- Today (2025)
- 39,337 people
- By 2030
- 36,930 · -6.1%
- By 2040
- 32,367 · -17.7%
- By 2050
- 29,030 · -26.2%
- By 2075
- 23,534 · -40.2%
- By 2100
- 19,312 · -50.9%
Race, ethnicity, and origin ACS 2023
- Neighborhood character
- Predominantly White (82%)
- Race & ethnicity
- White 82% Hispanic / Latino 9% Two or more races 9% Pacific Islander 2% Asian 2%
- Hispanic origin (detail)
- Mexican 5%
- Common ancestry
- Lithuanian 4% Russian 2% Italian 2%
- Foreign-born
- 9% · Canada, China
- Languages at home
- 90% English-only · Spanish 6% Other Asian/Pacific 2% Chinese 1%
Political lean MEDSL · Siskiyou
- 2024 margin
- R (+19.2) · D 38.8% · R 58.0% · Other 3.2%
- 2008→2024 swing
- -8.8pp toward R · 2008: -10.4pp · 2024: -19.2pp
- All cycles
- 2024: R+19.2 2020: R+15.8 2016: R+20.7 2012: R+15.6 2008: R+10.4
Not yet ingested
- Civics
- —
Market trends
- HPI YoY
- ▼ -227.87%
- Current HPI
- 115.4662
- Rent YoY
- —
- Metro
- —
- State GDP YoY
- ▲ 3.21%
- F500 in state
- 116
Industry mix (Fortune 500 HQ in CA)
| Industry | F500 HQs | Revenue |
|---|---|---|
| Technology | 27 | $1,492B |
|
||
| Financial Services | 3 | $174B |
|
||
| Retail | 3 | $44B |
|
||
| Insurance | 3 | $26B |
|
||
| Media / Entertainment | 2 | $115B |
|
||
| Pharmaceuticals / Biotech | 2 | $62B |
|
||
Price history
+107.4% since first listed4 events — show timeline
- 2026-06-09 Listed $475,000 SMLS
- 2011-12-09 Sold (Public Records) $212,000 Public Records
- 2011-12-09 Sold (MLS) $212,000 SMLS
- 2011-09-28 Listed $229,000 SMLS
Property tax history
+1.5%/yrLatest (2025): $2,897 · +1.7% YoY. Source: county tax records.
Cash-flow waterfall
monthlySold comps — $/sqft
last 12 mo · ≤1 miLoading sold comps…