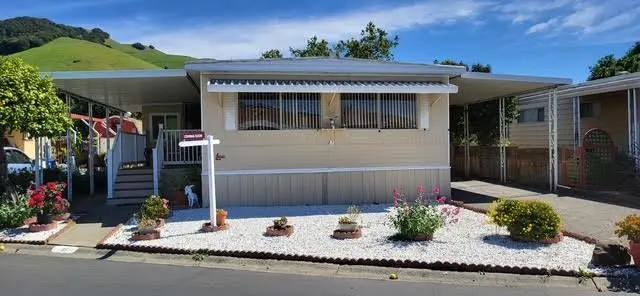
711 Old Canyon Rd #27 · Fremont, CA
Flood risk 1/10 · Minimal
- FEMA flood zone
- X (unshaded)
- Chance of flooding over 30 yrs
- 0.0%
- Est. flood insurance / yr
- $507 – $1,088
Fire risk 5/10 · Moderate
- Est. fire insurance / yr
- $659 – $1,223
Heat risk 4/10 · Minor
- Hot days now (above 92°F)
- 7 days/yr
- Hot days in 30 yrs
- 15 days/yr
Wind risk 1/10 · Minimal
- Chance of severe wind over 30 yrs
- —
Air-quality risk 8/10 · Major
- Unhealthy air days now
- 13 days/yr
- Unhealthy air days in 30 yrs
- 16 days/yr
Risk factors via First Street. Map © Google.
Why this score? — see what drove the A- grade
The composite is a weighted blend of 9 inputs, each scored 0–100. Each bar is that input's sub-score; the figure is the points it added to the 100-point composite (weight × sub-score).
- Cash flow +30.0/30.0
- ARV discount +15.0/15.0
- 1% rule +10.0/10.0
- DSCR +10.0/10.0
- Schools +7.3/10.0
- Livability +4.2/5.0
- Rent growth +3.5/5.0
- Condition / age +2.5/5.0
- Appreciation +0.0/10.0
$158,000
🖨 Deal sheet 📄 Offer letter ✓ Due diligence
Listing remarks MLS
Senior Mobile Home Park. Living Rm / Dining Rm combo w/Built-In China Cabinet. Interior Laundry, Washer & Dryer Stay. Large Covered Side Porch. Across from Pool, Hot Tub + Clubhouse! Do you love the outdoors? Large Back Yard with Amazing View of the Hills. Covered Parking. 2 Storage Sheds.
Key facts
- Clubhouse
- Sauna
- Pool
Tags
Neighborhood map
What this means for you Summary
Snapshot
- This is a 2-bed/1.0-bath manufactured listed at $158k.
Deal economics
- At list price, monthly cash flow is $1k ($14k/yr) — positive.
- The deal already cash-flows at list — no discount required.
- Meets the 1% rule at list price ($3k rent vs $158k).
- Recommended offer: $153k (3.0% below list) — sets the bar for market timing.
- Cap rate 15.1% vs local median 1.2% in Fremont — top-decile yield for the area; either an underpriced asset or a hidden risk that comps aren't pricing in. Stress-test before assuming the spread holds.
Location & tenants
- Location reads 85/100 on livability (#10 in CA, #561 nationally) — a professional / high-income tenant draw. Strengths: schools A+, amenities A+, commute A+; Watch: cost of living F.
- Fremont Unified (suburban): math 76% / reading 84% proficiency, ranked #23 of 517 in CA (top 4%) — strong family-tenant draw, lease renewals of 3-5y typical; only 15% free/reduced lunch — higher-income household profile.
- Market conditions: Rents rising (+3.8%/yr); 173 active listings in the ZIP; 13 comparable units currently listed for rent nearby; rentals leasing fast (median 10d on market — plan ~1-2 weeks tenant-placement turnaround); high-income renter base; 1,742 units permitted in Alameda County in 2024 (856 in 5+ unit buildings).
Forward outlook
- Local home prices are declining (-3.0%/yr); year-one equity from $1k of loan paydown is wiped out by about $5k of value loss. Plan a longer hold.
- Alameda County population projected at +34% by 2050 — long-run rental-demand tailwind backs the buy-and-hold thesis.
- At projected returns (-3.0% appreciation + 3.8% rent growth), your $44k cash investment doubles in ~4 years — after that, you're playing with house money.
Negotiation context
- It's been on market 59 days — a 3% lower offer ($153k) is reasonable based on typical stale-listing flexibility.
- Current owner paid $55k; list at $158k implies a 187% gain — meaningful room to come down on a strong offer.
Risks & watch-outs
- Climate carrying-cost: moderate wildfire risk — expect insurance premiums to compound above CPI over the hold.
Questions for the listing agent
- It's been on market 59 days. Have you received any prior offers? Is the seller open to a 3% concession, seller financing, or rate buy-down credit?
- Built in 1970 — when were the roof, HVAC, electrical panel, plumbing, and water heater last replaced?
- Is there a deadline driving the sale (1031 exchange, divorce, estate, relocation)? That informs how much negotiation room exists.
- Schools are A-rated — typically a magnet for longer-tenancy family renters. What's the average tenant stay here, and is there a school-zone premium baked into asking?
- What's the average days-on-market for RENTAL listings here right now (not sales)? A rising rental-DOM trend means longer vacancies and softer asking-rent achievability than the comps imply.
- What's the recent tenant-quality profile in this submarket — average credit score on applications, eviction rate, late-payment / NSF rate, and stable-employment percentage? A property-management company in the area should have these aggregated.
- How much new for-sale + rental construction is in the pipeline within 1–3 miles? Heavy new supply typically softens prices + rents 12–24 months out; constrained supply supports both.
Investment metrics
- 1% rule
- 1.81% ✓
- Cap rate
- 15.13%
- Cash-on-cash
- 31.54%
- DSCR
- 2.40
- GRM
- 4.6
CMA / ARV
- ARV (median comp)
- $205,095
- List price
- $158,000
- Delta
- -22.96%
- Verdict
- UNDERPRICED
- Comps
- 4 within 1.0 mi
Show comp detail 3 sales within ~0.75 mi
| Address | Dist | Beds/Ba | Sqft | Sold | Price | $/sf | Match |
|---|---|---|---|---|---|---|---|
| 711 Old Canyon Rd #56 | 0.00mi | 2/2.0 | 1,008 (+12%) | 1mo | $223,000 | $221 | 75 |
| 711 Old Canyon Rd #67 | 0.09mi | 2/1.0 | 960 (+7%) | 19mo | $110,000 | $115 | 69 |
| 711 Old Canyon Rd #113 | 0.00mi | 2/2.0 | 960 (+7%) | 23mo | $140,000 | $146 | 66 |
Match score weights: distance 35% · size 25% · config 20% · recency 20%. Top-matched comps best support the ARV.
Projected returns pro-forma
-3.0% appreciation · 3.83% rent growth · sell at horizon
- IRR
- 27.4%
- Equity multiple
- 2.15×
- Total profit
- $50,911
- Equity at exit
- $23,558
- IRR
- 35.4%
- Equity multiple
- 4.39×
- Total profit
- $149,911
- Equity at exit
- $13,661
Cash invested: $44,240 (down + closing). Projections, not guarantees.
Landlord ↔ Tenant lean methodology
- Overall (STATE)
- 18 Strongly Tenant-Friendly
- State California
- 18 Strongly Tenant-Friendly · D+13
- County
- — inherits STATE
- City
- — inherits STATE
ZIP-level market 94536
- Rents YoY
- 3.8%
- Active inventory
- 173
- Price-to-rent
- 4.6×
Monthly cashflow live
- Estimated rent
- $2,854 high interval (Pro) →
- Mortgage (P&I)
- −$829
- Tax est. 1.5%
- −$198 /mo · $2,370/yr
- Insurance
- −$66
- HOA
- −$0
- Vacancy / Maint / Mgmt
- −$599
- Net cashflow
- $1,163
Break-even live
UW: 25.0% down · 7.5% · 30yr · 1.5% tax · 5.0% vac · 8.0% maint · 8.0% mgmt
Financing live
Cash to close
- Down payment
- $39,500
- Closing costs
- $4,740
- Reserves months
- —
- Total cash needed
- —
Loan-product check · same deal, 3 products live
Conventional
25% down · 7.5% · 30yr
- Down + closing
- —
- Monthly P&I
- —
- Monthly cashflow
- —
- DSCR
- —
- Eligible?
- —
Personal DTI + credit; lowest rate.
DSCR
20% down · 8.5% · 30yr
- Down + closing
- —
- Monthly P&I
- —
- Monthly cashflow
- —
- DSCR
- —
- Eligible?
- —
No personal income docs; deal must DSCR.
Hard money
10% down · 12.0% · 12mo
- Down + closing
- —
- Monthly P&I
- —
- Monthly cashflow
- —
- DSCR
- —
- Eligible?
- —
Short-term bridge; refi at stabilization.
Rent comps 13 comps
| Address | Beds | Baths | Sqft | Rent | $/sqft | DOM | Units | Dist |
|---|---|---|---|---|---|---|---|---|
| 37987 Vallejo St Fremont, CA | 1.0 | 1.0 | 600 | $2,250 | $3.75 | 43d | 1 | 0.35mi |
| 38416 Mission Blvd Fremont, CA | 2.0 | 1.0 | 507 | $2,698 | $5.32 | 2d | 11 | 0.36mi |
| 37847 Niles Blvd Apt 10 Fremont, CA | 2.0 | 1.0 | 900 | $2,400 | $2.67 | 43d | 1 | 0.48mi |
| 38738 Aurora Ter Fremont, CA | 2.0 | 1.5 | 1123 | $3,296 | $2.93 | 10d | 1 | 0.65mi |
| 38627 Cherry Ln #36 Fremont, CA | 1.0 | 1.0 | 623 | $2,250 | $3.61 | 20d | 1 | 0.91mi |
| 37189 2nd St Fremont, CA | 2.0 | 1.0 | 645 | $3,000 | $4.65 | 5d | 1 | 0.92mi |
| 38680 Waterside Cir Fremont, CA | 1.0–2.0 | 1.0–2.0 | 990 | $3,442 | $3.48 | 1d | 5 | 1.30mi |
| 38561 Princeton Ter #16 Fremont, CA | 2.0 | 2.0 | 823 | $2,900 | $3.52 | 43d | 1 | 1.33mi |
| 1001 Beethoven Cmn Fremont, CA | 1.0–3.0 | 1.0–3.0 | 1059 | $3,126 | $2.95 | 1d | 9 | 1.36mi |
| 39206 Guardino Dr #208 Fremont, CA | 1.0 | 1.0 | 693 | $2,490 | $3.59 | 20d | 1 | 1.39mi |
| 39451 Gallaudet Dr Fremont, CA | 1.0–2.0 | 1.0–2.0 | 906 | $3,479 | $3.84 | 1d | 11 | 1.45mi |
| 2000 Walnut Ave Fremont, CA | 1.0–2.0 | 1.0–2.0 | 920 | $3,931 | $4.27 | 1d | 11 | 1.46mi |
| 39219 Guardino Dr Fremont, CA | 2.0 | 1.0 | 844 | $2,750 | $3.26 | 12d | 1 | 1.46mi |
Listing history 3 events
-
2015-10-02soldstatus $55,000 Sold 295-char remark
Show marketing remark (295 chars)
Senior Mobile Home Park. Living Rm / Dining Rm combo w/Built-In China Cabinet. Interior Laundry, Washer & Dryer Stay. Large Covered Side Porch. Across from Pool, Hot Tub + Clubhouse! Do you love the outdoors? Large Back Yard with Amazing View of the Hills. Covered Parking. 2 Storage Sheds.
-
2015-09-20status Pending 295-char remark
Show marketing remark (295 chars)
Senior Mobile Home Park. Living Rm / Dining Rm combo w/Built-In China Cabinet. Interior Laundry, Washer & Dryer Stay. Large Covered Side Porch. Across from Pool, Hot Tub + Clubhouse! Do you love the outdoors? Large Back Yard with Amazing View of the Hills. Covered Parking. 2 Storage Sheds.
-
2015-09-10$64,000 New 295-char remark
Show marketing remark (295 chars)
Senior Mobile Home Park. Living Rm / Dining Rm combo w/Built-In China Cabinet. Interior Laundry, Washer & Dryer Stay. Large Covered Side Porch. Across from Pool, Hot Tub + Clubhouse! Do you love the outdoors? Large Back Yard with Amazing View of the Hills. Covered Parking. 2 Storage Sheds.
ⓘ Source: listings_history table (triggers on properties + properties_extension) + one-shot
backfill from property_details.listing_events for pre-trigger history.
Climate risk First Street
- Flood 1/10 Low FEMA zone X (unshaded) · 0% chance over 30 yrs
- Wildfire 5/10 Major
- Heat 4/10 Moderate 7 d/yr ≥92°F today · 15 d/yr by 30 yrs out
- Wind 1/10 Low
- Air quality 8/10 Severe 13 unhealthy d/yr today · 16 by 30 yrs out
Nearby sold comps map
Loading sold comps map…
Walkable amenities ~0.75 mi
Loading nearby amenities…
Taxation est. · year 1
- Rental income
- $34,251
- − Mortgage interest
- −$8,850
- − Property taxes
- −$2,370
- − Insurance
- −$790
- − Repairs & maintenance
- −$2,740
- − Management
- −$2,740
- − Depreciation
- −$4,596
- Taxable income
- $12,164
- Est. tax owed @ 24.0%
- −$2,919
- After-tax cash flow
- $11,036/yr
For passive investors: Depreciation is non-cash, so a rental often shows a tax loss while cash-flowing — sheltering income. Rental losses are passive: they offset passive income freely, and up to $25,000/yr can offset ordinary (W-2) income if you actively participate and your MAGI is under $100k (phasing out to $0 by $150k); unused losses carry forward. On sale, claimed depreciation is recaptured at up to 25%, and gains may owe capital-gains tax (a 1031 exchange can defer both). Figures are a year-1 estimate at your 24.0% rate — not tax advice; consult a CPA.
Schools (NCES district)
- District
- Fremont Unified
- NCES district ID
- 0614400
- Math proficiency
- 76% ▲ 3.00%
- Reading proficiency
- 84% ▲ 6.00%
- Median HH income
- $105,489
- Composite
- 72.94/100
- National rank
- #191
- State rank
- #23 of 517 in CA
Livability — Fremont
- Score
- 85/100
- State rank
- #10
- US rank
- #561
Category grades
Schools grade is shown separately in the Schools card above.
Census & demographics
- Census place
- Fremont, CA
- County
- Alameda County · 1,614,355 people
- City population
- 228,297
- Metro
- San Francisco-Oakland-Berkeley, CA
- Population (ZIP)
- 70,619
- Household income
- $167,662
- Rent vs Own
- Severe rent burden
- 2414.0
Population outlook (Alameda County) Hauer SSP2
- Today (2025)
- 1,928,884 people
- By 2030
- 2,069,146 · +7.3%
- By 2040
- 2,338,405 · +21.2%
- By 2050
- 2,586,608 · +34.1%
- By 2075
- 3,061,911 · +58.7%
- By 2100
- 3,234,133 · +67.7%
Race, ethnicity, and origin ACS 2023
- Neighborhood character
- Diverse neighborhood (Simpson 0.66)
- Race & ethnicity
- Asian 51% White 24% Hispanic / Latino 16% Two or more races 9% Black 4%
- Hispanic origin (detail)
- Mexican 12%
- Common ancestry
- Russian 2% Lithuanian 1% Slovak 1%
- Foreign-born
- 44% · China, Canada, Vietnam
- Languages at home
- 45% English-only · Other Indo-European 17% Chinese 11% Spanish 10%
Political lean MEDSL · Alameda
- 2024 margin
- Solid D (+53.6) · D 74.6% · R 21.0% · Other 4.4%
- 2008→2024 swing
- -5.9pp toward R · 2008: 59.5pp · 2024: 53.6pp
- All cycles
- 2024: D+53.6 2020: D+62.5 2016: D+64.4 2012: D+59.8 2008: D+59.5
Not yet ingested
- Civics
- —
Market trends
- HPI YoY
- ▼ -1370.22%
- Current HPI
- 388.7956
- Rent YoY
- ▲ 3.83%
- Metro
- San Francisco-Oakland-Berkeley, CA
- State GDP YoY
- ▲ 3.21%
- F500 in state
- 116
Industry mix (Fortune 500 HQ in CA)
| Industry | F500 HQs | Revenue |
|---|---|---|
| Technology | 27 | $1,492B |
|
||
| Financial Services | 3 | $174B |
|
||
| Retail | 3 | $44B |
|
||
| Insurance | 3 | $26B |
|
||
| Media / Entertainment | 2 | $115B |
|
||
| Pharmaceuticals / Biotech | 2 | $62B |
|
||
Price history
-14.1% since first listed3 events — show timeline
- 2015-10-02 Sold (MLS) $55,000 bridgeMLS, Bay East AOR, or Contra Costa AOR
- 2015-09-20 Pending — bridgeMLS, Bay East AOR, or Contra Costa AOR
- 2015-09-10 Listed $64,000 bridgeMLS, Bay East AOR, or Contra Costa AOR
Cash-flow waterfall
monthlySold comps — $/sqft
last 12 mo · ≤1 miLoading sold comps…