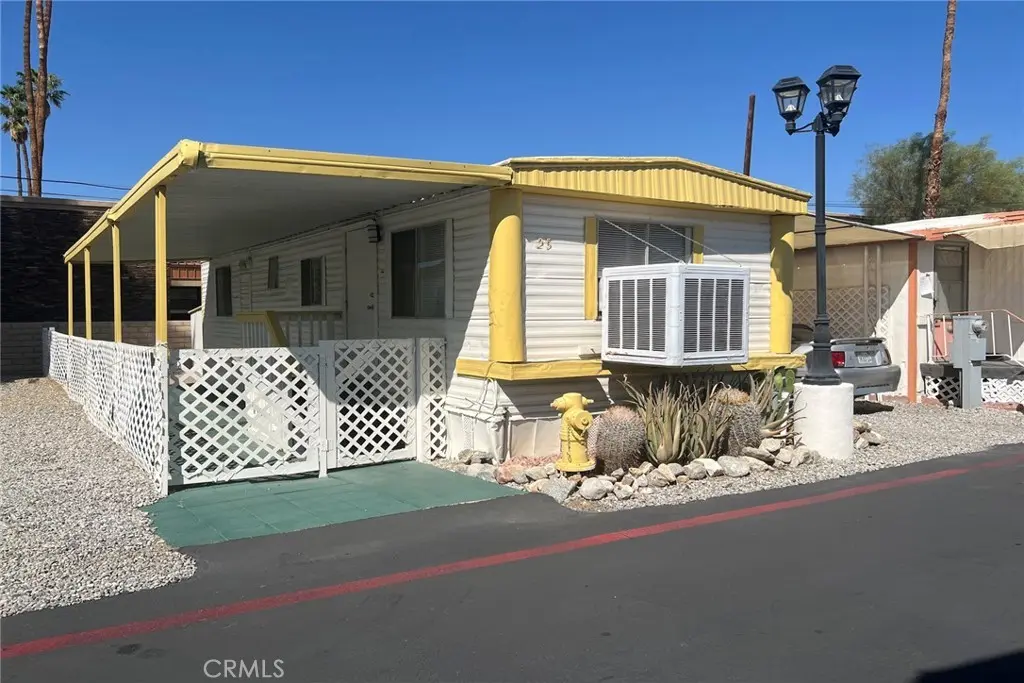
70210 HWY 111 #25 · Rancho Mirage, CA
Flood risk 1/10 · Minimal
- FEMA flood zone
- X (unshaded)
- Chance of flooding over 30 yrs
- 0.0%
- Est. flood insurance / yr
- $507 – $1,088
Fire risk 4/10 · Minor
- Est. fire insurance / yr
- $659 – $1,223
Heat risk 9/10 · Severe
- Hot days now (above 109°F)
- 8 days/yr
- Hot days in 30 yrs
- 24 days/yr
Wind risk 1/10 · Minimal
- Chance of severe wind over 30 yrs
- —
Air-quality risk 4/10 · Minor
- Unhealthy air days now
- 5 days/yr
- Unhealthy air days in 30 yrs
- 7 days/yr
Risk factors via First Street. Map © Google.
Why this score? — see what drove the D grade
The composite is a weighted blend of 9 inputs, each scored 0–100. Each bar is that input's sub-score; the figure is the points it added to the 100-point composite (weight × sub-score).
- Cash flow +15.0/30.0
- ARV discount +7.5/15.0
- 1% rule +5.0/10.0
- DSCR +5.0/10.0
- Rent growth +3.4/5.0
- Schools +2.7/10.0
- Livability +2.6/5.0
- Condition / age +2.5/5.0
- Appreciation +0.0/10.0
$13,950
🖨 Deal sheet 📄 Offer letter ✓ Due diligence
Listing remarks MLS
LOCATION! The community of Rancho Mirage RV & Mobile Village offers affordable living in the heart of Coachella Valley, This 1 Bed 1 Bath unit has been rehabbed and in move-in condition. Enjoy the Communiuty Pool and beautiful mountain views! Other untis available too!
Key facts
- Mountain views
- Community pool
- Built 1985
Tags
Neighborhood map
What this means for you Summary
Snapshot
- This is a 1-bed/1.0-bath manufactured listed at $14k.
Deal economics
- At list price, monthly cash flow is $2k ($22k/yr) — positive.
- The deal already cash-flows at list — no discount required.
- Meets the 1% rule at list price ($2k rent vs $14k).
- Recommended offer: $12k (12.0% below list) — sets the bar for market timing.
- Cap rate 164.4% vs local median 3.0% in Rancho Mirage — top-decile yield for the area; either an underpriced asset or a hidden risk that comps aren't pricing in. Stress-test before assuming the spread holds.
Location & tenants
- Location reads 51/100 on livability (#1,065 in CA) — a working-class tenant base; expect higher turnover. Strengths: employment A+; Watch: amenities F, commute F, cost of living F.
- Palm Springs Unified (suburban): math 21% / reading 42% proficiency, ranked #328 of 517 in CA (top 63%) — families likely to look elsewhere, expect single-tenant / working-renter base with shorter leases; 73% free/reduced lunch — lower-income household profile, screen leases tightly.
- Market conditions: Rents rising (+3.7%/yr); 529 active listings in the ZIP; solid renter incomes; 9,195 units permitted in Riverside County in 2024 (1,512 in 5+ unit buildings).
Forward outlook
- Local home prices are declining (-3.0%/yr); year-one equity from $96 of loan paydown is wiped out by about $418 of value loss. Plan a longer hold.
- Riverside County population projected at +22% by 2050 — long-run rental-demand tailwind backs the buy-and-hold thesis.
- At projected returns (-3.0% appreciation + 3.7% rent growth), your $4k cash investment doubles in ~1 year — after that, you're playing with house money.
Negotiation context
- It's been on market 278 days — a 12% lower offer ($12k) is reasonable based on typical stale-listing flexibility.
- 2 sale attempts since 2y ago; this cycle's ask has dropped $29k (68%) from the opening price — seller is motivated, your offer sets the floor, not the list.
Risks & watch-outs
- Climate carrying-cost: extreme-heat days projected 8→24/yr by 2055 (HVAC capex compounding) — expect insurance premiums to compound above CPI over the hold.
Questions for the listing agent
- It's been on market 278 days. Have you received any prior offers? Is the seller open to a 12% concession, seller financing, or rate buy-down credit?
- Why hasn't it sold? Are there any deal-killer items the seller is aware of (foundation, flood, title, zoning, code violations)?
- Is there a deadline driving the sale (1031 exchange, divorce, estate, relocation)? That informs how much negotiation room exists.
- The area grade is low — what's the realistic commute time and amenity access for the typical tenant pool here? Any planned neighborhood developments (good or bad) we should know about?
- What's the average days-on-market for RENTAL listings here right now (not sales)? A rising rental-DOM trend means longer vacancies and softer asking-rent achievability than the comps imply.
- What's the recent tenant-quality profile in this submarket — average credit score on applications, eviction rate, late-payment / NSF rate, and stable-employment percentage? A property-management company in the area should have these aggregated.
- How much new for-sale + rental construction is in the pipeline within 1–3 miles? Heavy new supply typically softens prices + rents 12–24 months out; constrained supply supports both.
Investment metrics
- 1% rule
- 17.55% ✓
- Cap rate
- 164.40%
- Cash-on-cash
- 564.65%
- DSCR
- 26.12
- GRM
- 0.5
CMA / ARV
- ARV (median comp)
- $62,561
- List price
- $13,950
- Delta
- -77.70%
- Verdict
- UNDERPRICED
- Comps
- 2 within 1.0 mi
Projected returns pro-forma
-3.0% appreciation · 3.72% rent growth · sell at horizon
- IRR
- —
- Equity multiple
- 30.86×
- Total profit
- $116,623
- Equity at exit
- $2,080
- IRR
- —
- Equity multiple
- 67.53×
- Total profit
- $259,876
- Equity at exit
- $1,206
Cash invested: $3,906 (down + closing). Projections, not guarantees.
Landlord ↔ Tenant lean methodology
- Overall (STATE)
- 18 Strongly Tenant-Friendly
- State California
- 18 Strongly Tenant-Friendly · D+13
- County
- — inherits STATE
- City
- — inherits STATE
ZIP-level market 92270
- Rents YoY
- 3.7%
- Active inventory
- 529
- Price-to-rent
- 0.5×
Monthly cashflow live
- Estimated rent
- $2,449 medium interval (Pro) →
- Mortgage (P&I)
- −$73
- Tax est. 1.5%
- −$17 /mo · $209/yr
- Insurance
- −$6
- HOA
- −$0
- Vacancy / Maint / Mgmt
- −$514
- Net cashflow
- $1,838
Break-even live
UW: 25.0% down · 7.5% · 30yr · 1.5% tax · 5.0% vac · 8.0% maint · 8.0% mgmt
Financing live
Cash to close
- Down payment
- $3,488
- Closing costs
- $418
- Reserves months
- —
- Total cash needed
- —
Loan-product check · same deal, 3 products live
Conventional
25% down · 7.5% · 30yr
- Down + closing
- —
- Monthly P&I
- —
- Monthly cashflow
- —
- DSCR
- —
- Eligible?
- —
Personal DTI + credit; lowest rate.
DSCR
20% down · 8.5% · 30yr
- Down + closing
- —
- Monthly P&I
- —
- Monthly cashflow
- —
- DSCR
- —
- Eligible?
- —
No personal income docs; deal must DSCR.
Hard money
10% down · 12.0% · 12mo
- Down + closing
- —
- Monthly P&I
- —
- Monthly cashflow
- —
- DSCR
- —
- Eligible?
- —
Short-term bridge; refi at stabilization.
Listing history 21 events
-
2026-06-18days on market $13,950 Active 278 DOM
-
2026-06-17days on market $13,950 Active 277 DOM
-
2026-06-16days on market $13,950 Active 276 DOM
-
2026-06-15days on market $13,950 Active 275 DOM
-
2026-06-13days on market $13,950 Active 273 DOM
-
2026-06-13days on market $13,950 Active 272 DOM
-
2026-06-09days on market $13,950 Active 269 DOM
-
2026-06-08days on market $13,950 Active 268 DOM
-
2026-06-07days on market $13,950 Active 267 DOM
-
2026-06-04days on market $13,950 Active 264 DOM
-
2026-06-03days on market $13,950 Active 263 DOM
-
2026-06-02days on market $13,950 Active 262 DOM
-
2026-06-01days on market $13,950 Active 261 DOM
-
2026-05-31days on market $13,950 Active 260 DOM
-
2026-02-13price $13,950 275-char remark
Show marketing remark (275 chars)
LOCATION! The community of Rancho Mirage RV & Mobile Village offers affordable living in the heart of Coachella Valley, This 1 Bed 1 Bath unit has been rehabbed and in move-in condition. Enjoy the Communiuty Pool and beautiful mountain views! Other untis available too!
-
2026-01-29price $6,500 275-char remark
Show marketing remark (275 chars)
LOCATION! The community of Rancho Mirage RV & Mobile Village offers affordable living in the heart of Coachella Valley, This 1 Bed 1 Bath unit has been rehabbed and in move-in condition. Enjoy the Communiuty Pool and beautiful mountain views! Other untis available too!
-
2025-12-16price $19,900 275-char remark
Show marketing remark (275 chars)
LOCATION! The community of Rancho Mirage RV & Mobile Village offers affordable living in the heart of Coachella Valley, This 1 Bed 1 Bath unit has been rehabbed and in move-in condition. Enjoy the Communiuty Pool and beautiful mountain views! Other untis available too!
-
2025-09-13$42,950 Active 275-char remark
Show marketing remark (275 chars)
LOCATION! The community of Rancho Mirage RV & Mobile Village offers affordable living in the heart of Coachella Valley, This 1 Bed 1 Bath unit has been rehabbed and in move-in condition. Enjoy the Communiuty Pool and beautiful mountain views! Other untis available too!
-
2025-01-22historical
-
2024-12-07price $39,000
-
2024-10-17$45,950 Active
ⓘ Source: listings_history table (triggers on properties + properties_extension) + one-shot
backfill from property_details.listing_events for pre-trigger history.
Climate risk First Street
- Flood 1/10 Low FEMA zone X (unshaded) · 0% chance over 30 yrs
- Wildfire 4/10 Moderate
- Heat 9/10 Extreme 8 d/yr ≥109°F today · 24 d/yr by 30 yrs out
- Wind 1/10 Low
- Air quality 4/10 Moderate 5 unhealthy d/yr today · 7 by 30 yrs out
Nearby sold comps map
Loading sold comps map…
Walkable amenities ~0.75 mi
Loading nearby amenities…
Taxation est. · year 1
- Rental income
- $29,383
- − Mortgage interest
- −$781
- − Property taxes
- −$209
- − Insurance
- −$70
- − Repairs & maintenance
- −$2,351
- − Management
- −$2,351
- − Depreciation
- −$406
- Taxable income
- $23,215
- Est. tax owed @ 24.0%
- −$5,572
- After-tax cash flow
- $16,484/yr
For passive investors: Depreciation is non-cash, so a rental often shows a tax loss while cash-flowing — sheltering income. Rental losses are passive: they offset passive income freely, and up to $25,000/yr can offset ordinary (W-2) income if you actively participate and your MAGI is under $100k (phasing out to $0 by $150k); unused losses carry forward. On sale, claimed depreciation is recaptured at up to 25%, and gains may owe capital-gains tax (a 1031 exchange can defer both). Figures are a year-1 estimate at your 24.0% rate — not tax advice; consult a CPA.
Schools (NCES district)
- District
- Palm Springs Unified
- NCES district ID
- 0629550
- Math proficiency
- 21% ▼ -7.00%
- Reading proficiency
- 42% ▬ 0.00%
- Median HH income
- $43,638
- Composite
- 26.76/100
- National rank
- #7131
- State rank
- #328 of 517 in CA
Livability — Rancho Mirage
- Score
- 51/100
- State rank
- #1065
- US rank
- #25255
Category grades
Schools grade is shown separately in the Schools card above.
Census & demographics
- Census place
- Rancho Mirage, CA
- County
- Riverside County · 2,287,001 people
- City population
- 17,563
- Metro
- Riverside-San Bernardino-Ontario, CA
- Population (ZIP)
- 17,563
- Household income
- $107,364
- Rent vs Own
- Severe rent burden
- 498.0
Population outlook (Riverside County) Hauer SSP2
- Today (2025)
- 2,664,475 people
- By 2030
- 2,802,692 · +5.2%
- By 2040
- 3,050,904 · +14.5%
- By 2050
- 3,256,783 · +22.2%
- By 2075
- 3,655,058 · +37.2%
- By 2100
- 3,766,594 · +41.4%
Race, ethnicity, and origin ACS 2023
- Neighborhood character
- Predominantly White (77%)
- Race & ethnicity
- White 77% Hispanic / Latino 15% Two or more races 6% Asian 4% Black 2%
- Hispanic origin (detail)
- Mexican 12%
- Common ancestry
- Slovak 4% Romanian 3% Lithuanian 3%
- Foreign-born
- 17% · Canada, South Korea, China
- Languages at home
- 81% English-only · Spanish 11% Other Indo-European 3% French/Haitian/Cajun 1%
Political lean MEDSL · Riverside
- 2024 margin
- Toss-up / Even · D 48.0% · R 49.3% · Other 2.6%
- 2008→2024 swing
- -3.6pp toward R · 2008: 2.3pp · 2024: -1.3pp
- All cycles
- 2024: R+1.3 2020: D+8.0 2016: D+4.3 2012: R+0.4 2008: D+2.3
Not yet ingested
- Civics
- —
Market trends
- HPI YoY
- ▼ -210.99%
- Current HPI
- 282.2957
- Rent YoY
- ▲ 3.72%
- Metro
- Riverside-San Bernardino-Ontario, CA
- State GDP YoY
- ▲ 3.21%
- F500 in state
- 116
Industry mix (Fortune 500 HQ in CA)
| Industry | F500 HQs | Revenue |
|---|---|---|
| Technology | 27 | $1,492B |
|
||
| Financial Services | 3 | $174B |
|
||
| Retail | 3 | $44B |
|
||
| Insurance | 3 | $26B |
|
||
| Media / Entertainment | 2 | $115B |
|
||
| Pharmaceuticals / Biotech | 2 | $62B |
|
||
Price history
-69.6% since first listed7 events — show timeline
- 2026-02-13 Price Changed $13,950 CRMLS
- 2026-01-29 Price Changed $6,500 CRMLS
- 2025-12-16 Price Changed $19,900 CRMLS
- 2025-09-13 Listed $42,950 CRMLS
- 2025-01-22 Listing Removed — GPSMLS
- 2024-12-07 Price Changed $39,000 GPSMLS
- 2024-10-17 Listed $45,950 GPSMLS
Cash-flow waterfall
monthlySold comps — $/sqft
last 12 mo · ≤1 miLoading sold comps…