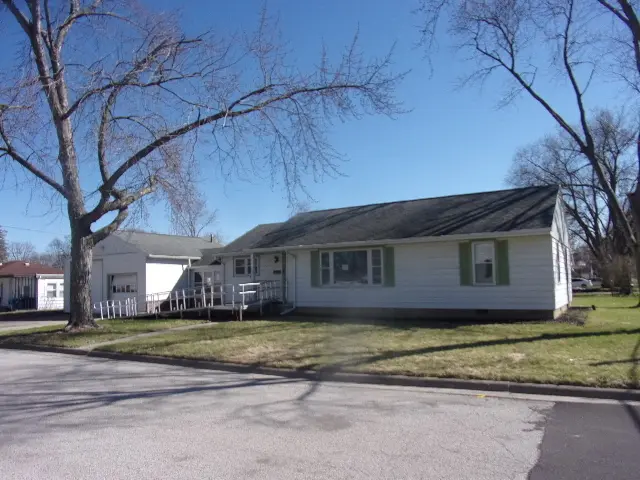
130 W Murphy St · Pontiac, IL
Flood risk 1/10 · Minimal
- FEMA flood zone
- X (unshaded)
- Chance of flooding over 30 yrs
- 0.0%
- Est. flood insurance / yr
- $507 – $1,088
Fire risk 1/10 · Minimal
- Est. fire insurance / yr
- $804 – $1,492
Heat risk 4/10 · Minor
- Hot days now (above 104°F)
- 7 days/yr
- Hot days in 30 yrs
- 17 days/yr
Wind risk 2/10 · Minimal
- Chance of severe wind over 30 yrs
- 1.0%
Air-quality risk 2/10 · Minimal
- Unhealthy air days now
- 1 days/yr
- Unhealthy air days in 30 yrs
- 1 days/yr
Risk factors via First Street. Map © Google.
Why this score? — see what drove the B- grade
The composite is a weighted blend of 9 inputs, each scored 0–100. Each bar is that input's sub-score; the figure is the points it added to the 100-point composite (weight × sub-score).
- Cash flow +30.0/30.0
- 1% rule +10.0/10.0
- DSCR +10.0/10.0
- ARV discount +7.5/15.0
- Livability +3.4/5.0
- Rent growth +2.5/5.0
- Schools +2.5/10.0
- Condition / age +2.5/5.0
- Appreciation +0.0/10.0
$69,000
🖨 Deal sheet 📄 Offer letter ✓ Due diligence
Listing remarks MLS
REDUCED!! Great south side Location! Lovely, well maintained home sitting on 2 lots. This home offers 3 bedrooms with double closets, 1 bath, an eat-in kitchen, LR, partial basement, sunroom and a 2 1/2 car attached garage with a loft for storage. One 10 foot and one 7 foot overhead door. Original hardwood floors. Roof, gutters, facia and some storm windows new in 2012. New entrance door to garage in 2013. Nice family home!
Key facts
- 2 garage spots
- Built 1951
- Listed 7 days
Neighborhood map
What this means for you Summary
Snapshot
- This is a 3-bed/1.0-bath single-family listed at $69k.
Deal economics
- At list price, monthly cash flow is $380 ($5k/yr) — positive.
- The deal already cash-flows at list — no discount required.
- Meets the 1% rule at list price ($1k rent vs $69k).
- Cap rate 12.9% vs local median 4.1% in Pontiac — top-decile yield for the area; either an underpriced asset or a hidden risk that comps aren't pricing in. Stress-test before assuming the spread holds.
Location & tenants
- Location reads 67/100 on livability (#495 in IL) — a middle-class / working-renter tenant base. Strengths: cost of living A+, housing A+, crime B; Watch: employment D+, amenities F, commute F.
- Pontiac Twp Hsd 90 (town): math 25% / reading 25% proficiency, ranked #611 of 919 in IL (top 66%) — low school quality limits family demand, transient renter base, plan for 1-2y turnover.
- Zoned schools: Pontiac High School (math 27% / reading 27%, grade F, #218 of 693 statewide, top 35%, 693 students, 0% FRL).
- Market conditions: 39 active listings in the ZIP; 35 units permitted in Livingston County in 2024 (0 in 5+ unit buildings).
Forward outlook
- Local home prices are declining (-3.0%/yr); year-one equity from $477 of loan paydown is wiped out by about $2k of value loss. Plan a longer hold.
- Livingston County population projected at -27% by 2050 — secular population decline; favor cash flow + early exit over multi-decade hold.
- At projected returns (-3.0% appreciation + 3.0% rent growth), your $19k cash investment doubles in ~6 years — after that, you're playing with house money.
Negotiation context
- Only 7 days on market — expect competitive offers; lowballing is unlikely to land.
- 2 sale attempts since 13y ago with the ask held roughly flat each time — persistent listings suggest the price (not the market) is what's stuck; bring a comps-based counter.
Risks & watch-outs
- Watch-outs: property tax is 3.4% of price; built in 1951 — expect roof / HVAC / electrical / plumbing capex.
Questions for the listing agent
- Built in 1951 — when were the roof, HVAC, electrical panel, plumbing, and water heater last replaced?
- Property tax is high relative to price — has the assessment been appealed recently, and will the sale trigger a re-assessment?
- Is there a deadline driving the sale (1031 exchange, divorce, estate, relocation)? That informs how much negotiation room exists.
- Schools are F-rated, which usually means shorter tenancies and higher turnover. Who's the typical renter profile here, and what's been the actual vacancy rate?
- What's the average days-on-market for RENTAL listings here right now (not sales)? A rising rental-DOM trend means longer vacancies and softer asking-rent achievability than the comps imply.
- What's the recent tenant-quality profile in this submarket — average credit score on applications, eviction rate, late-payment / NSF rate, and stable-employment percentage? A property-management company in the area should have these aggregated.
- How much new for-sale + rental construction is in the pipeline within 1–3 miles? Heavy new supply typically softens prices + rents 12–24 months out; constrained supply supports both.
Investment metrics
- 1% rule
- 1.77% ✓
- Cap rate
- 12.89%
- Cash-on-cash
- 23.57%
- DSCR
- 2.05
- GRM
- 4.7
CMA / ARV
- ARV (on-the-fly)
- $171,570
- Comps found
- 12
Show comp detail 12 sales within ~0.75 mi
| Address | Dist | Beds/Ba | Sqft | Sold | Price | $/sf | Match |
|---|---|---|---|---|---|---|---|
| 922 S Mill St | 0.15mi | 3/2.0 | 1,907 (+6%) | 5mo | $140,000 | $73 | 76 |
| 217 W Moulton St | 0.33mi | 3/2.0 | 1,810 (+0%) | 10mo | $145,000 | $80 | 71 |
| 126 W Lowell Ave | 0.06mi | 4/1.0 (+1) | 1,562 (-14%) | 2mo | $142,000 | $91 | 68 |
| 772 S Locust St | 0.20mi | 4/2.0 (+1) | 1,674 (-7%) | 8mo | $180,000 | $108 | 63 |
| 316 W Henry St | 0.50mi | 3/1.5 | 1,706 (-6%) | 4mo | $173,000 | $101 | 62 |
| 117 W Humiston St | 0.14mi | 4/2.0 (+1) | 1,685 (-7%) | 19mo | $113,000 | $67 | 58 |
| 5 S Dixie Ln | 0.24mi | 3/2.0 | 2,005 (+11%) | 19mo | $190,000 | $95 | 51 |
| 319 W Lincoln St | 0.29mi | 3/1.5 | 1,612 (-11%) | 23mo | $80,000 | $50 | 48 |
| 514 S Vermillion St | 0.53mi | 3/1.5 | 1,581 (-12%) | 13mo | $167,500 | $106 | 42 |
| 735 W Henry St | 0.68mi | 4/2.0 (+1) | 1,976 (+9%) | 10mo | $189,900 | $96 | 35 |
| 219 W Reynolds St | 0.40mi | 4/1.0 (+1) | 2,070 (+15%) | 21mo | $142,500 | $69 | 34 |
| 409 W Water St | 0.75mi | 4/2.0 (+1) | 1,998 (+11%) | 5mo | $189,900 | $95 | 34 |
Match score weights: distance 35% · size 25% · config 20% · recency 20%. Top-matched comps best support the ARV.
Projected returns pro-forma
-3.0% appreciation · 3.0% rent growth · sell at horizon
- IRR
- 16.8%
- Equity multiple
- 1.68×
- Total profit
- $13,078
- Equity at exit
- $10,288
- IRR
- 25.4%
- Equity multiple
- 3.22×
- Total profit
- $42,861
- Equity at exit
- $5,966
Cash invested: $19,320 (down + closing). Projections, not guarantees.
Landlord ↔ Tenant lean methodology
- Overall (STATE)
- 43 Moderately Tenant-Leaning
- State Illinois
- 43 Moderately Tenant-Leaning · D+7
- County
- — inherits STATE
- City
- — inherits STATE
ZIP-level market 61764
- Home prices YoY
- -15.4%
- Active inventory
- 39
- Price-to-rent
- 4.7×
Monthly cashflow live
- Estimated rent
- $1,221 medium interval (Pro) →
- Mortgage (P&I)
- −$362
- Tax from tax record
- −$194 /mo · $2,332/yr
- Insurance
- −$29
- HOA
- −$0
- Vacancy / Maint / Mgmt
- −$256
- Net cashflow
- $380
Break-even live
UW: 25.0% down · 7.5% · 30yr · 1.5% tax · 5.0% vac · 8.0% maint · 8.0% mgmt
Financing live
Cash to close
- Down payment
- $17,250
- Closing costs
- $2,070
- Reserves months
- —
- Total cash needed
- —
Loan-product check · same deal, 3 products live
Conventional
25% down · 7.5% · 30yr
- Down + closing
- —
- Monthly P&I
- —
- Monthly cashflow
- —
- DSCR
- —
- Eligible?
- —
Personal DTI + credit; lowest rate.
DSCR
20% down · 8.5% · 30yr
- Down + closing
- —
- Monthly P&I
- —
- Monthly cashflow
- —
- DSCR
- —
- Eligible?
- —
No personal income docs; deal must DSCR.
Hard money
10% down · 12.0% · 12mo
- Down + closing
- —
- Monthly P&I
- —
- Monthly cashflow
- —
- DSCR
- —
- Eligible?
- —
Short-term bridge; refi at stabilization.
Listing history 5 events
-
2026-04-20status Pending
-
2026-04-12$69,000 Active
-
2014-06-06soldstatus $92,000 427-char remark
Show marketing remark (427 chars)
REDUCED!! Great south side Location! Lovely, well maintained home sitting on 2 lots. This home offers 3 bedrooms with double closets, 1 bath, an eat-in kitchen, LR, partial basement, sunroom and a 2 1/2 car attached garage with a loft for storage. One 10 foot and one 7 foot overhead door. Original hardwood floors. Roof, gutters, facia and some storm windows new in 2012. New entrance door to garage in 2013. Nice family home!
-
2014-06-06soldstatus $92,000
Show marketing remark (427 chars)
REDUCED!! Great south side Location! Lovely, well maintained home sitting on 2 lots. This home offers 3 bedrooms with double closets, 1 bath, an eat-in kitchen, LR, partial basement, sunroom and a 2 1/2 car attached garage with a loft for storage. One 10 foot and one 7 foot overhead door. Original hardwood floors. Roof, gutters, facia and some storm windows new in 2012. New entrance door to garage in 2013. Nice family home!
-
2013-12-08$99,900 427-char remark
Show marketing remark (427 chars)
REDUCED!! Great south side Location! Lovely, well maintained home sitting on 2 lots. This home offers 3 bedrooms with double closets, 1 bath, an eat-in kitchen, LR, partial basement, sunroom and a 2 1/2 car attached garage with a loft for storage. One 10 foot and one 7 foot overhead door. Original hardwood floors. Roof, gutters, facia and some storm windows new in 2012. New entrance door to garage in 2013. Nice family home!
ⓘ Source: listings_history table (triggers on properties + properties_extension) + one-shot
backfill from property_details.listing_events for pre-trigger history.
Tax reassessment forecast IL · Partial reset (capped growth)
- Current annual tax
- $2,332 · $194/mo
- Projected year-2 tax
- $2,332 · $194/mo
- Expected delta
- $0/yr ($0/mo · 0.0%)
ⓘ Screening estimate from a state-policy table — verify with the county assessor before closing.
Climate risk First Street
- Flood 1/10 Low FEMA zone X (unshaded) · 0% chance over 30 yrs
- Wildfire 1/10 Low
- Heat 4/10 Moderate 7 d/yr ≥104°F today · 17 d/yr by 30 yrs out
- Wind 2/10 Low 100% chance of damaging wind over 30 yrs
- Air quality 2/10 Low 1 unhealthy d/yr today · 1 by 30 yrs out
Nearby sold comps map
Loading sold comps map…
Walkable amenities ~0.75 mi
Loading nearby amenities…
Taxation est. · year 1
- Rental income
- $14,650
- − Mortgage interest
- −$3,865
- − Property taxes
- −$2,332
- − Insurance
- −$345
- − Repairs & maintenance
- −$1,172
- − Management
- −$1,172
- − Depreciation
- −$2,007
- Taxable income
- $3,757
- Est. tax owed @ 24.0%
- −$902
- After-tax cash flow
- $3,653/yr
For passive investors: Depreciation is non-cash, so a rental often shows a tax loss while cash-flowing — sheltering income. Rental losses are passive: they offset passive income freely, and up to $25,000/yr can offset ordinary (W-2) income if you actively participate and your MAGI is under $100k (phasing out to $0 by $150k); unused losses carry forward. On sale, claimed depreciation is recaptured at up to 25%, and gains may owe capital-gains tax (a 1031 exchange can defer both). Figures are a year-1 estimate at your 24.0% rate — not tax advice; consult a CPA.
Schools (NCES district)
- District
- Pontiac Twp Hsd 90
- NCES district ID
- 1732220
- Math proficiency
- 25% ▼ -5.00%
- Reading proficiency
- 25% ▼ -5.00%
- Median HH income
- $47,682
- Composite
- 24.88/100
- National rank
- #12999
- State rank
- #611 of 919 in IL
Livability — Pontiac
- Score
- 67/100
- State rank
- #495
- US rank
- #10258
Category grades
Schools grade is shown separately in the Schools card above.
Census & demographics
- Census place
- Pontiac, IL
- City population
- 13,718
- Population (ZIP)
- 13,718
Population outlook (Livingston County) Hauer SSP2
- Today (2025)
- 32,749 people
- By 2030
- 30,848 · -5.8%
- By 2040
- 27,357 · -16.5%
- By 2050
- 24,048 · -26.6%
- By 2075
- 17,574 · -46.3%
- By 2100
- 12,096 · -63.1%
Race, ethnicity, and origin ACS 2023
- Neighborhood character
- Predominantly White (84%)
- Race & ethnicity
- White 84% Black 8% Hispanic / Latino 5% Two or more races 4%
- Hispanic origin (detail)
- Mexican 3% Puerto Rican 1%
- Common ancestry
- Romanian 4% Lithuanian 3% Portuguese 2%
- Foreign-born
- 3% · Canada
- Languages at home
- 96% English-only · Spanish 3%
Political lean MEDSL · Livingston
- 2024 margin
- Solid R (+46.3) · D 26.1% · R 72.4% · Other 1.6%
- 2008→2024 swing
- -27.1pp toward R · 2008: -19.2pp · 2024: -46.3pp
- All cycles
- 2024: R+46.3 2020: R+44.2 2016: R+41.0 2012: R+31.5 2008: R+19.2
Not yet ingested
- Civics
- —
Market trends
- HPI YoY
- ▼ -39.21%
- Current HPI
- 215.3534
- Rent YoY
- —
- Metro
- —
- State GDP YoY
- ▲ 1.59%
- F500 in state
- 60
Industry mix (Fortune 500 HQ in IL)
| Industry | F500 HQs | Revenue |
|---|---|---|
| Insurance | 4 | $201B |
|
||
| Consumer Goods | 4 | $87B |
|
||
| Industrial Machinery | 3 | $64B |
|
||
| Healthcare | 2 | $55B |
|
||
| Retail / Pharmacy | 1 | $148B |
|
||
| Agriculture / Food | 1 | $86B |
|
||
Price history
-30.9% since first listed5 events — show timeline
- 2026-04-20 Pending — MRED as Distributed by MLS Grid
- 2026-04-12 Listed $69,000 MRED as Distributed by MLS Grid
- 2014-06-06 Sold (MLS) $92,000 MRED as Distributed by MLS Grid
- 2014-06-06 Sold (Public Records) $92,000 Public Records
- 2013-12-08 Listed $99,900 MRED as Distributed by MLS Grid
Property tax history
+9.4%/yrLatest (2024): $2,332 · +18.9% YoY. Source: county tax records.
Cash-flow waterfall
monthlySold comps — $/sqft
last 12 mo · ≤1 miLoading sold comps…