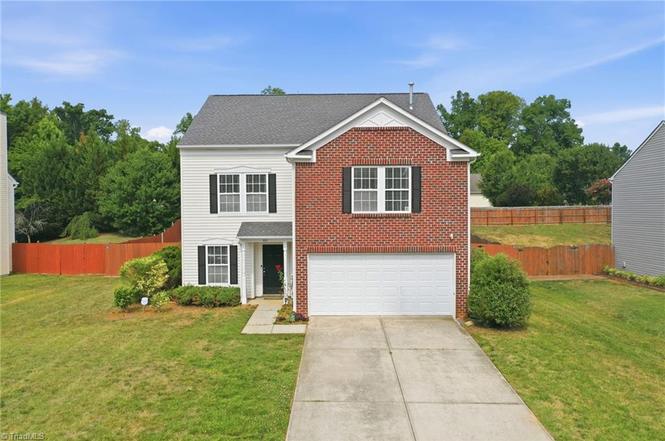
410 Walnut Crossing Dr · Gibsonville, NC
Flood risk 1/10 · Minimal
- FEMA flood zone
- X (unshaded)
- Chance of flooding over 30 yrs
- 0.0%
- Est. flood insurance / yr
- $473 – $860
Fire risk 3/10 · Minor
- Est. fire insurance / yr
- $906 – $1,684
Heat risk 6/10 · Moderate
- Hot days now (above 104°F)
- 7 days/yr
- Hot days in 30 yrs
- 18 days/yr
Wind risk 4/10 · Minor
- Chance of severe wind over 30 yrs
- 18.0%
Air-quality risk 2/10 · Minimal
- Unhealthy air days now
- 2 days/yr
- Unhealthy air days in 30 yrs
- 2 days/yr
Risk factors via First Street. Map © Google.
Why this score? — see what drove the D+ grade
The composite is a weighted blend of 9 inputs, each scored 0–100. Each bar is that input's sub-score; the figure is the points it added to the 100-point composite (weight × sub-score).
- ARV discount +15.0/15.0
- Cash flow +8.5/30.0
- Appreciation +5.5/10.0
- Livability +3.7/5.0
- Schools +3.6/10.0
- Rent growth +3.5/5.0
- Condition / age +2.5/5.0
- DSCR +2.3/10.0
- 1% rule +2.1/10.0
$315,000
🖨 Deal sheet (PDF) 📄 Offer letter ✓ Due diligence
Listing remarks MLS
With over 2,400 square feet across three levels, this home offers a flexible floor plan designed for real life. The open main level brings everyone together, featuring a spacious kitchen with granite countertops, abundant cabinet space, a large pantry, and a comfortable living area with a cozy fireplace. Whether you're hosting friends, helping with homework at the kitchen table, or enjoying a quiet evening at home, this space was made to be lived in. Upstairs, the private primary suite is joined by two additional bedrooms and a large loft that's perfect for a home office, playroom, or second living area. The third-floor bonus room provides even more flexibility for a media room, home gym, guest retreat, or hobby space. Fresh interior paint and professionally cleaned carpets give the home a bright, welcoming feel, while the convenient location offers easy access to Burlington, Greensboro, shopping, dining, and major commuter routes.
Key facts
- Large loft
- Flexible floor plan
- Spacious kitchen
Tags
Property features AI
Finance
- HOA & community: Community association managed by Red Rock Management; Quarterly association fee; Association fee covers storm water maintenance
Exterior
- Parking: Attached garage (2 spaces)
- Utilities: Public water; Public sewer; Electricity connected; Natural gas connected; Sewer connected; Water connected
- Home design: Site-built property; Three or more levels; RE zoning
- Construction: Vinyl siding; Shingle roof; Slab foundation; Built on site
- Exterior features: Patio
Interior
- Kitchen: Dishwasher; Oven; Refrigerator
- Bedrooms: 3 bedrooms
- Flooring: Carpet; Vinyl
- Bathrooms: 2 full bathrooms; 1 half bathroom
- Heating & cooling: No heating system specified; Central air conditioning
- Interior features: Ceiling fans; Pantry; Smooth ceilings; Walk-in closet(s); Bathtub/shower combination; Soaking tub; Living room fireplace
- Laundry & utility: Main-level laundry room
Neighborhood map
What this means for you Summary
Snapshot
- This is a 3-bed/2.5-bath single-family listed at $315k.
Deal economics
- At list price, monthly cash flow is $-277 ($-3k/yr) — negative.
- To cash-flow at today's rent, offer at most $266k (15.5% below list).
- To meet the 1% rule (rent ≥ 1% of price), the offer needs to be $224k (28.9% below list).
- Recommended offer: $224k (28.9% below list) — sets the bar for 1% rule.
- Cap rate 5.2% vs local median 4.2% in Gibsonville — meaningfully above typical; check what's discounted (condition, days-on-market, listing class) to confirm the premium yield is real.
Location & tenants
- Location reads 73/100 on livability (#79 in NC) — a middle-class / working-renter tenant base. Strengths: employment A+, cost of living A+, housing A+; Watch: health & safety C-, schools D-, amenities F.
- Guilford County Schools (urban): math 39% / reading 45% proficiency, ranked #99 of 178 in NC (top 56%) — families likely to look elsewhere, expect single-tenant / working-renter base with shorter leases.
- Market conditions: Rents rising fast (+4.0%/yr); 102 active listings in the ZIP; 4 comparable units currently listed for rent nearby; rentals at typical pace (median 25d on market — plan ~3-4 weeks tenant-placement turnaround); solid renter incomes; 3,843 units permitted in Guilford County in 2024 (2,397 in 5+ unit buildings).
Forward outlook
- In year one you build about $5k of equity ($2k loan paydown + $3k appreciation (1.0% local appreciation)).
- Guilford County population projected at +26% by 2050 — long-run rental-demand tailwind backs the buy-and-hold thesis.
- By year 6, paydown + projected appreciation supports a ~$31k cash-out refi (75% LTV) — recoverable capital for the next deal without selling this one.
Negotiation context
- Only 7 days on market — expect competitive offers; lowballing is unlikely to land.
- 8 sale attempts since 10y ago with the ask held roughly flat each time — persistent listings suggest the price (not the market) is what's stuck; bring a comps-based counter.
- Current owner paid $174k; list at $315k implies a 81% gain — meaningful room to come down on a strong offer.
Risks & watch-outs
- Climate carrying-cost: extreme-heat days projected 7→18/yr by 2055 (HVAC capex compounding) — expect insurance premiums to compound above CPI over the hold.
Questions for the listing agent
- What do current leases actually rent for vs. the listed asking? Can we see a recent rent roll and the last 12 months of T-12 income?
- What does the HOA fee cover, when was the last increase, and are there any pending special assessments or reserve-fund shortfalls?
- Is there a deadline driving the sale (1031 exchange, divorce, estate, relocation)? That informs how much negotiation room exists.
- Schools are D-rated, which usually means shorter tenancies and higher turnover. Who's the typical renter profile here, and what's been the actual vacancy rate?
- The area grade is low — what's the realistic commute time and amenity access for the typical tenant pool here? Any planned neighborhood developments (good or bad) we should know about?
- What's the average days-on-market for RENTAL listings here right now (not sales)? A rising rental-DOM trend means longer vacancies and softer asking-rent achievability than the comps imply.
- What's the recent tenant-quality profile in this submarket — average credit score on applications, eviction rate, late-payment / NSF rate, and stable-employment percentage? A property-management company in the area should have these aggregated.
- How much new for-sale + rental construction is in the pipeline within 1–3 miles? Heavy new supply typically softens prices + rents 12–24 months out; constrained supply supports both.
Investment metrics
- 1% rule
- 0.71% ✗
- Cap rate
- 5.24%
- Cash-on-cash
- -3.76%
- DSCR
- 0.83
- GRM
- 11.7
CMA / ARV
- ARV (on-the-fly)
- $417,944
- Comps found
- 7
Show comp detail 7 sales within ~0.75 mi
| Address | Dist | Beds/Ba | Sqft | Sold | Price | $/sf | Match |
|---|---|---|---|---|---|---|---|
| 615 Walnut Crossing Dr | 0.25mi | 3/2.0 | 2,166 (-8%) | 10mo | $329,000 | $152 | 66 |
| 304 Walnut Crossing Dr | 0.17mi | 4/2.5 (+1) | 2,113 (-10%) | 11mo | $304,000 | $144 | 62 |
| 131 Verona Villa Dr | 0.56mi | 4/3.0 (+1) | 2,438 (+4%) | 8mo | $447,900 | $184 | 53 |
| 529 Hwy 61 | 0.65mi | 4/3.0 (+1) | 2,511 (+7%) | 14mo | $370,000 | $147 | 39 |
| 1048 Gibson House Dr | 0.72mi | 4/3.5 (+1) | 2,449 (+4%) | 15mo | $439,900 | $180 | 38 |
| 1019 Gibson House Dr | 0.70mi | 4/2.5 (+1) | 2,591 (+10%) | 13mo | $460,000 | $178 | 34 |
| 1051 Gibson House Dr | 0.74mi | 4/3.0 (+1) | 2,568 (+9%) | 20mo | $495,725 | $193 | 26 |
Match score weights: distance 35% · size 25% · config 20% · recency 20%. Top-matched comps best support the ARV.
Projected returns pro-forma
1.02% appreciation · 4.0% rent growth · sell at horizon
- IRR
- -2.1%
- Equity multiple
- 0.90×
- Total profit
- $-9,254
- Equity at exit
- $107,795
- IRR
- 3.5%
- Equity multiple
- 1.43×
- Total profit
- $38,048
- Equity at exit
- $143,451
Cash invested: $88,200 (down + closing). Projections, not guarantees.
Landlord ↔ Tenant lean methodology
- Overall (STATE)
- 85 Strongly Landlord-Friendly
- State North Carolina
- 85 Strongly Landlord-Friendly · R+3
- County
- — inherits STATE
- City
- — inherits STATE
ZIP-level market 27377
- Home prices YoY
- 0.4%
- Rents YoY
- 4.0%
- Active inventory
- 102
- Price-to-rent
- 11.7×
Monthly cashflow live
- Estimated rent
- $2,239 medium interval (Pro) →
- Mortgage (P&I)
- −$1,652
- Tax from tax record
- −$242 /mo · $2,908/yr
- Insurance
- −$131
- HOA
- −$20
- Vacancy / Maint / Mgmt
- −$470
- Net cashflow
- $-277
Break-even live
Sensitivity live
| Price | -10% $-98 | -5% $-187 | +0% $-277 | +5% $-366 | +10% $-455 |
|---|---|---|---|---|---|
| Rent | -10% $-453 | -5% $-365 | +0% $-277 | +5% $-188 | +10% $-100 |
| Rate | -1.0pp $-118 | -0.5pp $-196 | base $-277 | +0.5pp $-358 | +1.0pp $-441 |
UW: 25.0% down · 7.5% · 30yr · 1.5% tax · 5.0% vac · 8.0% maint · 8.0% mgmt
Financing live
Cash to close
- Down payment
- $78,750
- Closing costs
- $9,450
- Reserves months
- —
- Total cash needed
- —
Loan-product check · same deal, 3 products live
Conventional
25% down · 7.5% · 30yr
- Down + closing
- —
- Monthly P&I
- —
- Monthly cashflow
- —
- DSCR
- —
- Eligible?
- —
Personal DTI + credit; lowest rate.
DSCR
20% down · 8.5% · 30yr
- Down + closing
- —
- Monthly P&I
- —
- Monthly cashflow
- —
- DSCR
- —
- Eligible?
- —
No personal income docs; deal must DSCR.
Hard money
10% down · 12.0% · 12mo
- Down + closing
- —
- Monthly P&I
- —
- Monthly cashflow
- —
- DSCR
- —
- Eligible?
- —
Short-term bridge; refi at stabilization.
Rent comps 4 comps
| Address | Beds | Baths | Sqft | Rent | $/sqft | DOM | Units | Dist |
|---|---|---|---|---|---|---|---|---|
| 708 Hawthorn Ridge Dr Whitsett, NC | 3.0 | 2.0 | 2200 | $2,330 | $1.06 | 15d | 1 | 0.17mi |
| 1022 Poets Walk Rd Unit 1 Whitsett, NC | 3.0 | 2.5 | 1706 | $1,850 | $1.08 | 22d | 1 | 0.50mi |
| 941 Poets Walk Rd Whitsett, NC | 3.0 | 2.5 | 1598 | $1,850 | $1.16 | 24d | 1 | 0.55mi |
| 225 Brycewood Dr Burlington, NC | 4.0 | 2.5 | 1929 | $1,860 | $0.96 | 24d | 1 | 0.76mi |
HOA detail
- Monthly dues
- $20 · $240/yr
- Likely covers
- gym
Listing history 7 events
-
2026-06-18price $315,000 Active 7 DOM
-
2026-06-18days on market $325,000 Active 7 DOM
-
2026-06-17days on market $325,000 Active 6 DOM
-
2026-06-16days on market $325,000 Active 5 DOM
-
2026-06-15days on market $325,000 Active 4 DOM
-
2026-06-14remarks 699-char remark
-
2026-06-14$325,000 Active 2 DOM
ⓘ Source: listings_history table (triggers on properties + properties_extension) + one-shot
backfill from property_details.listing_events for pre-trigger history.
Tax reassessment forecast NC · Resets to sale price
- Current annual tax
- $2,908 · $242/mo
- Projected year-2 tax
- $2,908 · $242/mo
- Expected delta
- $0/yr ($0/mo · 0.0%)
ⓘ Screening estimate from a state-policy table — verify with the county assessor before closing.
Climate risk First Street
- Flood 1/10 Low FEMA zone X (unshaded) · 0% chance over 30 yrs
- Wildfire 3/10 Moderate
- Heat 6/10 Major 7 d/yr ≥104°F today · 18 d/yr by 30 yrs out
- Wind 4/10 Moderate 18% chance of damaging wind over 30 yrs
- Air quality 2/10 Low 2 unhealthy d/yr today · 2 by 30 yrs out
Nearby sold comps map
Loading sold comps map…
Walkable amenities ~0.75 mi
Loading nearby amenities…
Taxation est. · year 1
- Rental income
- $26,868
- − Mortgage interest
- −$17,645
- − Property taxes
- −$2,908
- − Insurance
- −$1,575
- − Repairs & maintenance
- −$2,149
- − Management
- −$2,149
- − HOA
- −$240
- − Depreciation
- −$9,164
- Taxable loss
- −$8,962
- Est. tax savings @ 24.0%
- +$2,151
- After-tax cash flow
- $-1,168/yr
For passive investors: Depreciation is non-cash, so a rental often shows a tax loss while cash-flowing — sheltering income. Rental losses are passive: they offset passive income freely, and up to $25,000/yr can offset ordinary (W-2) income if you actively participate and your MAGI is under $100k (phasing out to $0 by $150k); unused losses carry forward. On sale, claimed depreciation is recaptured at up to 25%, and gains may owe capital-gains tax (a 1031 exchange can defer both). Figures are a year-1 estimate at your 24.0% rate — not tax advice; consult a CPA.
Schools (NCES district)
- District
- Guilford County Schools
- NCES district ID
- 3701920
- Math proficiency
- 39% ▲ 1.00%
- Reading proficiency
- 45% ▲ 1.00%
- Median HH income
- $46,315
- Composite
- 35.78/100
- National rank
- #4842
- State rank
- #99 of 178 in NC
Livability — Gibsonville
- Score
- 73/100
- State rank
- #79
- US rank
- #5651
Category grades
Schools grade is shown separately in the Schools card above.
Census & demographics
- Census place
- Gibsonville, NC
- County
- Guilford County · 487,190 people
- City population
- 13,741
- Metro
- Greensboro-High Point, NC
- Population (ZIP)
- 10,885
- Household income
- $90,181
- Rent vs Own
- Severe rent burden
- 356.0
Population outlook (Guilford County) Hauer SSP2
- Today (2025)
- 584,596 people
- By 2030
- 616,851 · +5.5%
- By 2040
- 678,451 · +16.1%
- By 2050
- 734,788 · +25.7%
- By 2075
- 862,985 · +47.6%
- By 2100
- 948,704 · +62.3%
Race, ethnicity, and origin ACS 2023
- Neighborhood character
- Diverse neighborhood (Simpson 0.61)
- Race & ethnicity
- White 52% Black 34% Two or more races 8% Hispanic / Latino 5% Asian 2%
- Common ancestry
- Serbian 6% Italian 3% Lithuanian 1%
- Foreign-born
- 5% · Canada, China
- Languages at home
- 95% English-only · Spanish 2% Chinese 1% Other Indo-European 1%
Political lean MEDSL · Guilford
- 2024 margin
- Strong D (+21.8) · D 60.2% · R 38.4% · Other 1.4%
- 2008→2024 swing
- +3.5pp toward D · 2008: 18.4pp · 2024: 21.8pp
- All cycles
- 2024: D+21.8 2020: D+23.1 2016: D+20.0 2012: D+16.5 2008: D+18.4
Not yet ingested
- Civics
- —
Market trends
- HPI YoY
- ▲ 1.02%
- Current HPI
- 232.0638
- Rent YoY
- ▲ 4.00%
- Metro
- Greensboro-High Point, NC
- State GDP YoY
- ▲ 3.28%
- F500 in state
- 26
Industry mix (Fortune 500 HQ in NC)
| Industry | F500 HQs | Revenue |
|---|---|---|
| Financial Services | 2 | $213B |
|
||
| Retail | 2 | $95B |
|
||
| Industrial Conglomerate | 1 | $38B |
|
||
| Metals / Steel | 1 | $35B |
|
||
| Utilities | 1 | $30B |
|
||
| Industrial Machinery | 1 | $19B |
|
||
Price history
+148.2% since first listed17 events — show timeline
- 2026-06-11 Listed $325,000 Triad MLS
- 2026-06-11 Listed $325,000 TMLS
- 2017-03-27 Sold (Public Records) $174,000 Public Records
- 2017-03-27 Sold (MLS) $174,000 AMLSNC
- 2017-03-27 Sold (MLS) $174,000 TMLS
- 2017-03-27 Sold (MLS) $174,000 AMLSNC
- 2017-03-27 Sold (MLS) $174,000 Triad MLS
- 2017-03-27 Sold (MLS) $174,000 TMLS
- 2017-02-02 Pending — Triad MLS
- 2017-01-13 Listed $175,000 Triad MLS
- 2017-01-13 Listed $175,000 AMLSNC
- 2017-01-13 Listed $175,000 TMLS
- 2017-01-11 Listed $175,000 TMLS
- 2017-01-11 Listed $175,000 AMLSNC
- 2016-12-30 Sold (MLS) $132,000 Triad MLS
- 2016-10-25 Pending — Triad MLS
- 2016-10-07 Listed $130,950 Triad MLS
Property tax history
+9.4%/yrLatest (2025): $2,908 · +2.5% YoY. Source: county tax records.
Cash-flow waterfall
monthlySold comps — $/sqft
last 12 mo · ≤1 miLoading sold comps…