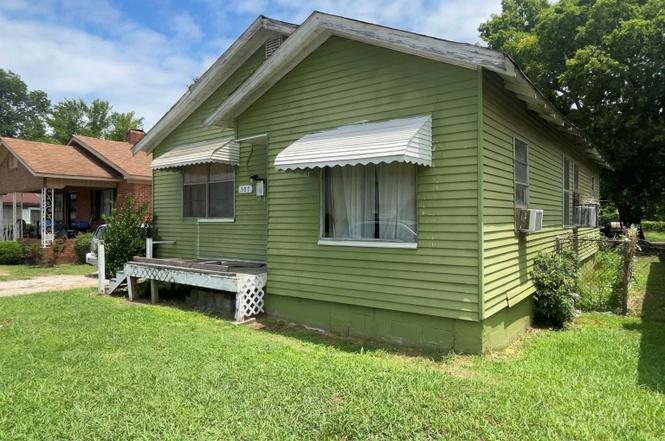
307 Goldwire St SW · Birmingham, AL
Flood risk 1/10 · Minimal
- FEMA flood zone
- X (unshaded)
- Chance of flooding over 30 yrs
- 0.0%
- Est. flood insurance / yr
- $507 – $1,088
Fire risk 1/10 · Minimal
- Est. fire insurance / yr
- $916 – $1,700
Heat risk 7/10 · Major
- Hot days now (above 106°F)
- 7 days/yr
- Hot days in 30 yrs
- 20 days/yr
Wind risk 6/10 · Moderate
- Chance of severe wind over 30 yrs
- 27.0%
Air-quality risk 4/10 · Minor
- Unhealthy air days now
- 6 days/yr
- Unhealthy air days in 30 yrs
- 8 days/yr
Risk factors via First Street. Map © Google.
Why this score? — see what drove the B- grade
The composite is a weighted blend of 9 inputs, each scored 0–100. Each bar is that input's sub-score; the figure is the points it added to the 100-point composite (weight × sub-score).
- Cash flow +30.0/30.0
- 1% rule +10.0/10.0
- DSCR +10.0/10.0
- ARV discount +7.5/15.0
- Livability +3.4/5.0
- Rent growth +2.5/5.0
- Condition / age +2.5/5.0
- Schools +0.9/10.0
- Appreciation +0.0/10.0
$47,500
🖨 Deal sheet (PDF) 📄 Offer letter ✓ Due diligence
Listing remarks
Home is located in the historic Titusville neighborhood. Located only 7 minutes from UAB Medical Center and UAB schools of higher education. There are major highways, shopping, restaurants and entertainment near by. The home is in need of much TLC. Bring your best offer!
Key facts
- Near major highways
- Close to uab schools
- 4,356 sq ft lot
Tags
Neighborhood map
What this means for you Summary
Snapshot
- This is a 3-bed/1.0-bath single-family listed at $48k.
Deal economics
- At list price, monthly cash flow is $606 ($7k/yr) — positive.
- The deal already cash-flows at list — no discount required.
- Meets the 1% rule at list price ($1k rent vs $48k).
- Cap rate 21.6% vs local median 6.2% in Birmingham — top-decile yield for the area; either an underpriced asset or a hidden risk that comps aren't pricing in. Stress-test before assuming the spread holds.
Location & tenants
- Location reads 67/100 on livability (#78 in AL) — a middle-class / working-renter tenant base. Strengths: commute A+, cost of living A+, housing A+; Watch: amenities C-, crime F, employment F.
- Birmingham City (urban): math 4% / reading 20% proficiency, ranked #116 of 129 in AL (top 90%) — low school quality limits family demand, transient renter base, plan for 1-2y turnover; 82% free/reduced lunch — lower-income household profile, screen leases tightly.
- Zoned schools: Washington K8 (math 5% / reading 18%, grade F, #556 of 627 statewide, top 89%, 567 students, 92% FRL); Parker High School (math 2% / reading 2%, grade F, #291 of 305 statewide, top 100%, 826 students, 90% FRL).
- Market conditions: Rents soft (-0.0%/yr); 152 active listings in the ZIP; 40 comparable units currently listed for rent nearby; rentals lingering (median 45d on market — plan ~5-8 weeks vacancy on turnover, expect pricing pressure); 52% of comp listings sitting > 30 days — soft ceiling on asking rent; lower-income renter base — watch delinquency; 2,114 units permitted in Jefferson County in 2024 (556 in 5+ unit buildings).
- This rent runs 42% of the median local income ($35k/yr) — at the standard rent-burdened threshold; future hikes will face affordability resistance.
Forward outlook
- Local home prices are declining (-3.0%/yr); year-one equity from $328 of loan paydown is wiped out by about $1k of value loss. Plan a longer hold.
- Jefferson County population projected to shrink 4% by 2050 — rents likely to lag national; underwrite the cash flow, not the appreciation.
- At projected returns (-3.0% appreciation + 0.0% rent growth), your $13k cash investment doubles in ~3 years — after that, you're playing with house money.
Negotiation context
- Only 14 days on market — expect competitive offers; lowballing is unlikely to land.
- 2 sale attempts since 2y ago with the ask held roughly flat each time — persistent listings suggest the price (not the market) is what's stuck; bring a comps-based counter.
- Current owner paid $27k; list at $48k implies a 77% gain — meaningful room to come down on a strong offer.
Risks & watch-outs
- Watch-outs: built in 1950 — expect roof / HVAC / electrical / plumbing capex.
- Climate carrying-cost: major wind risk, 27% chance of damaging wind over 30y; extreme-heat days projected 7→20/yr by 2055 (HVAC capex compounding) — expect insurance premiums to compound above CPI over the hold.
Questions for the listing agent
- Built in 1950 — when were the roof, HVAC, electrical panel, plumbing, and water heater last replaced?
- Is there a deadline driving the sale (1031 exchange, divorce, estate, relocation)? That informs how much negotiation room exists.
- Schools are F-rated, which usually means shorter tenancies and higher turnover. Who's the typical renter profile here, and what's been the actual vacancy rate?
- Crime grade is F in this area — have there been break-ins, vandalism, or insurance claims at this property in the last 3 years? What carrier currently insures it and at what premium?
- What's the average days-on-market for RENTAL listings here right now (not sales)? A rising rental-DOM trend means longer vacancies and softer asking-rent achievability than the comps imply.
- What's the recent tenant-quality profile in this submarket — average credit score on applications, eviction rate, late-payment / NSF rate, and stable-employment percentage? A property-management company in the area should have these aggregated.
- How much new for-sale + rental construction is in the pipeline within 1–3 miles? Heavy new supply typically softens prices + rents 12–24 months out; constrained supply supports both.
Investment metrics
- 1% rule
- 2.55% ✓
- Cap rate
- 21.59%
- Cash-on-cash
- 54.64%
- DSCR
- 3.43
- GRM
- 3.3
CMA / ARV
- ARV (on-the-fly)
- $105,780
- Comps found
- 12
Show comp detail 12 sales within ~0.75 mi
| Address | Dist | Beds/Ba | Sqft | Sold | Price | $/sf | Match |
|---|---|---|---|---|---|---|---|
| 417 Goldwire St SW | 0.09mi | 3/1.0 | 1,107 (-10%) | 2mo | $95,000 | $86 | 77 |
| 629 Center Pl SW | 0.29mi | 3/1.0 | 1,197 (-3%) | 7mo | $65,500 | $55 | 76 |
| 1724 Center St S | 0.36mi | 3/2.0 | 1,250 (+2%) | 4mo | $175,493 | $140 | 73 |
| 45 5th Ct | 0.31mi | 3/2.0 | 1,200 (-2%) | 6mo | $152,500 | $127 | 72 |
| 728 Center Pl SW | 0.34mi | 3/1.0 | 1,143 (-7%) | 1mo | $140,000 | $122 | 72 |
| 1724 1st Pl S | 0.61mi | 3/1.0 | 1,250 (+2%) | 1mo | $85,000 | $68 | 68 |
| 216 S 3rd Ave | 0.49mi | 3/1.0 | 1,143 (-7%) | 2mo | $75,000 | $66 | 64 |
| 741 Center Pl | 0.38mi | 3/1.0 | 1,101 (-10%) | 2mo | $141,000 | $128 | 63 |
| 345 Iota Ave S | 0.62mi | 2/1.0 (-1) | 1,279 (+4%) | 4mo | $20,000 | $16 | 56 |
| 816 7th St | 0.50mi | 3/1.0 | 1,358 (+10%) | 6mo | $15,000 | $11 | 54 |
| 50 1st Ave S | 0.34mi | 4/2.0 (+1) | 1,400 (+14%) | 4mo | $22,000 | $16 | 48 |
| 2019 Hollins Dr | 0.74mi | 3/2.0 | 1,120 (-9%) | 5mo | $165,000 | $147 | 43 |
Match score weights: distance 35% · size 25% · config 20% · recency 20%. Top-matched comps best support the ARV.
Projected returns pro-forma
-3.0% appreciation · 0.0% rent growth · sell at horizon
- IRR
- 49.3%
- Equity multiple
- 3.06×
- Total profit
- $27,353
- Equity at exit
- $7,082
- IRR
- 53.6%
- Equity multiple
- 5.50×
- Total profit
- $59,884
- Equity at exit
- $4,107
Cash invested: $13,300 (down + closing). Projections, not guarantees.
Landlord ↔ Tenant lean methodology
- Overall (STATE)
- 90 Strongly Landlord-Friendly
- State Alabama
- 90 Strongly Landlord-Friendly · R+15
- County
- — inherits STATE
- City
- — inherits STATE
ZIP-level market 35211
- Rents YoY
- -0.0%
- Active inventory
- 152
- Price-to-rent
- 3.3×
Monthly cashflow live
- Estimated rent
- $1,213 high interval (Pro) →
- Mortgage (P&I)
- −$249
- Tax from tax record
- −$84 /mo · $1,003/yr
- Insurance
- −$20
- HOA
- −$0
- Vacancy / Maint / Mgmt
- −$255
- Net cashflow
- $606
Break-even live
Sensitivity live
| Price | -10% $632 | -5% $619 | +0% $606 | +5% $592 | +10% $579 |
|---|---|---|---|---|---|
| Rent | -10% $510 | -5% $558 | +0% $606 | +5% $654 | +10% $701 |
| Rate | -1.0pp $630 | -0.5pp $618 | base $606 | +0.5pp $593 | +1.0pp $581 |
UW: 25.0% down · 7.5% · 30yr · 1.5% tax · 5.0% vac · 8.0% maint · 8.0% mgmt
Financing live
Cash to close
- Down payment
- $11,875
- Closing costs
- $1,425
- Reserves months
- —
- Total cash needed
- —
Loan-product check · same deal, 3 products live
Conventional
25% down · 7.5% · 30yr
- Down + closing
- —
- Monthly P&I
- —
- Monthly cashflow
- —
- DSCR
- —
- Eligible?
- —
Personal DTI + credit; lowest rate.
DSCR
20% down · 8.5% · 30yr
- Down + closing
- —
- Monthly P&I
- —
- Monthly cashflow
- —
- DSCR
- —
- Eligible?
- —
No personal income docs; deal must DSCR.
Hard money
10% down · 12.0% · 12mo
- Down + closing
- —
- Monthly P&I
- —
- Monthly cashflow
- —
- DSCR
- —
- Eligible?
- —
Short-term bridge; refi at stabilization.
Rent comps 40 comps
| Address | Beds | Baths | Sqft | Rent | $/sqft | DOM | Units | Dist |
|---|---|---|---|---|---|---|---|---|
| 12 4th Ave SW Unit 1 Birmingham, AL | 3.0 | 1.0 | 1336 | $1,100 | $0.82 | 44d | 1 | 0.12mi |
| 261 3rd Ave SW Birmingham, AL | 1.0–2.0 | 1.0 | 634 | $850 | $1.34 | 4d | 14 | 0.19mi |
| 741 Center Pl SW Birmingham, AL | 3.0 | 1.0 | 1101 | $1,250 | $1.14 | 16d | 1 | 0.38mi |
| 112 Kappa Ave S Birmingham, AL | 3.0 | 2.0 | 1034 | $1,100 | $1.06 | 44d | 1 | 0.47mi |
| 856 Center Way SW Birmingham, AL | 3.0 | 2.0 | 1142 | $1,200 | $1.05 | 44d | 1 | 0.52mi |
| 806 Gamma St S Birmingham, AL | 3.0 | 1.0 | 1252 | $1,200 | $0.96 | 44d | 1 | 0.64mi |
| 310 Gamma St S Birmingham, AL | 3.0 | 1.5 | 1001 | $1,200 | $1.20 | 16d | 1 | 0.68mi |
| 313 Beta St S Unit 317A Birmingham, AL | 2.0 | 1.0 | 850 | $799 | $0.94 | 2d | 1 | 0.75mi |
| 506 Alpha St S Birmingham, AL | 3.0 | 1.0 | 944 | $1,373 | $1.45 | 44d | 1 | 0.78mi |
| 1012 Cotton Ave SW Birmingham, AL | 3.0 | 1.0 | 1232 | $1,000 | $0.81 | 44d | 1 | 0.79mi |
| 413 Fulton Ave SW Birmingham, AL | 3.0 | 1.0 | 940 | $525 | $0.56 | 3d | 1 | 0.81mi |
| 608 Fulton Ave SW Birmingham, AL | 3.0 | 1.0 | 1271 | $1,300 | $1.02 | 44d | 1 | 0.82mi |
| 1100 Cotton Ave SW Unit b Birmingham, AL | 2.0 | 1.5 | 816 | $988 | $1.21 | 44d | 1 | 0.83mi |
| 719 Washington Ave SW Birmingham, AL | 3.0 | 1.0 | 1064 | $950 | $0.89 | 12d | 1 | 0.86mi |
| 644 Alabama Ave SW Birmingham, AL | 3.0 | 1.0 | 1274 | $1,125 | $0.88 | 24d | 1 | 0.90mi |
| 451 2nd Ave N Birmingham, AL | 4.0 | 3.0 | 1400 | $1,600 | $1.14 | 24d | 1 | 0.91mi |
| 405 11th St SW Unit B Birmingham, AL | 2.0 | 1.0 | 1065 | $800 | $0.75 | 44d | 1 | 1.05mi |
| 916 14th St SW Unit F Birmingham, AL | 2.0 | 1.0 | 800 | $800 | $1.00 | 12d | 1 | 1.09mi |
| 916 14th St SW Unit F Birmingham, AL | 2.0 | 1.0 | 870 | $800 | $0.92 | 44d | 1 | 1.09mi |
| 916 14th St SW Unit A Birmingham, AL | 2.0 | 1.0 | 870 | $800 | $0.92 | 24d | 1 | 1.09mi |
| 451 2nd St N Birmingham, AL | 4.0 | 3.0 | 1400 | $1,600 | $1.14 | 44d | 1 | 1.12mi |
| 1217 Fulton Ave SW Birmingham, AL | 4.0 | 2.0 | 1397 | $1,395 | $1.00 | 44d | 1 | 1.12mi |
| 407 Green Springs Ave S Birmingham, AL | 2.0 | 1.0 | 866 | $2,000 | $2.31 | 2d | 1 | 1.14mi |
| 1256 15th St SW Birmingham, AL | 3.0 | 1.0 | 1206 | $1,300 | $1.08 | 3d | 1 | 1.15mi |
| 609 Idlewild Cir Apt B Birmingham, AL | 2.0 | 1.0 | 705 | $875 | $1.24 | 4d | 1 | 1.16mi |
| 1228 Fulton Ave SW Birmingham, AL | 2.0 | 1.0 | 900 | $800 | $0.89 | 45d | 1 | 1.17mi |
| 624 4th Ct W Birmingham, AL | 3.0 | 1.5 | 992 | $1,250 | $1.26 | 44d | 1 | 1.18mi |
| 1136 15th St SW Birmingham, AL | 4.0 | 2.0 | 1296 | $1,395 | $1.08 | 24d | 1 | 1.18mi |
| 2217-2249 Green Springs Hwy Unit 2249-E Birmingham, AL | 2.0 | 1.0 | 900 | $910 | $1.01 | 44d | 1 | 1.19mi |
| 2217-2249 Green Springs Hwy Unit 2241-M Birmingham, AL | 3.0 | 2.0 | 1100 | $1,109 | $1.01 | 22d | 1 | 1.19mi |
| 1508 Dennison Ave SW Birmingham, AL | 2.0 | 1.0 | 924 | $890 | $0.96 | 44d | 1 | 1.20mi |
| 1220 Alabama Ave SW Birmingham, AL | 3.0 | 1.5 | 1175 | $1,350 | $1.15 | 44d | 1 | 1.21mi |
| 724 4th Ct W Birmingham, AL | 3.0 | 1.0 | 1300 | $930 | $0.72 | 44d | 1 | 1.22mi |
| 1332 15th Pl SW Birmingham, AL | 2.0 | 1.0 | 1115 | $950 | $0.85 | 4d | 1 | 1.22mi |
| 691 Idlewild Cir Birmingham, AL | 2.0 | 2.0 | 777 | $1,382 | $1.78 | 4d | 3 | 1.23mi |
| 1233 15th Way SW Birmingham, AL | 3.0 | 1.0 | 1119 | $1,050 | $0.94 | 44d | 1 | 1.27mi |
| 908 4th Ave W Birmingham, AL | 2.0 | 1.0 | 700 | $745 | $1.06 | 24d | 1 | 1.30mi |
| 401 Skyview Dr Birmingham, AL | 2.0 | 1.0 | 864 | $950 | $1.10 | 44d | 1 | 1.32mi |
| 1501 Princeton Ave SW Birmingham, AL | 3.0 | 2.0 | 1260 | $1,350 | $1.07 | 45d | 1 | 1.33mi |
| 1101 10th Pl S Birmingham, AL | 1.0–2.0 | 1.0–2.0 | 986 | $1,825 | $1.85 | 4d | 11 | 1.33mi |
Listing history 5 events
-
2024-08-19status Pending
-
2024-08-07status Active
-
2024-07-25status Pending
-
2024-07-23$47,500 Active
-
1995-04-13soldstatus $26,900
ⓘ Source: listings_history table (triggers on properties + properties_extension) + one-shot
backfill from property_details.listing_events for pre-trigger history.
Tax reassessment forecast AL · Resets to sale price
- Current annual tax
- $1,003 · $84/mo
- Projected year-2 tax
- $1,003 · $84/mo
- Expected delta
- $0/yr ($0/mo · 0.0%)
ⓘ Screening estimate from a state-policy table — verify with the county assessor before closing.
Climate risk First Street
- Flood 1/10 Low FEMA zone X (unshaded) · 0% chance over 30 yrs
- Wildfire 1/10 Low
- Heat 7/10 Severe 7 d/yr ≥106°F today · 20 d/yr by 30 yrs out
- Wind 6/10 Major 27% chance of damaging wind over 30 yrs
- Air quality 4/10 Moderate 6 unhealthy d/yr today · 8 by 30 yrs out
Nearby sold comps map
Loading sold comps map…
Walkable amenities ~0.75 mi
Loading nearby amenities…
Taxation est. · year 1
- Rental income
- $14,553
- − Mortgage interest
- −$2,661
- − Property taxes
- −$1,003
- − Insurance
- −$238
- − Repairs & maintenance
- −$1,164
- − Management
- −$1,164
- − Depreciation
- −$1,382
- Taxable income
- $6,941
- Est. tax owed @ 24.0%
- −$1,666
- After-tax cash flow
- $5,601/yr
For passive investors: Depreciation is non-cash, so a rental often shows a tax loss while cash-flowing — sheltering income. Rental losses are passive: they offset passive income freely, and up to $25,000/yr can offset ordinary (W-2) income if you actively participate and your MAGI is under $100k (phasing out to $0 by $150k); unused losses carry forward. On sale, claimed depreciation is recaptured at up to 25%, and gains may owe capital-gains tax (a 1031 exchange can defer both). Figures are a year-1 estimate at your 24.0% rate — not tax advice; consult a CPA.
Schools (NCES district)
- District
- Birmingham City
- NCES district ID
- 0100390
- Math proficiency
- 4% ▼ -17.00%
- Reading proficiency
- 20% ▼ -4.00%
- Median HH income
- $31,988
- Composite
- 9.49/100
- National rank
- #9850
- State rank
- #116 of 129 in AL
Livability — Birmingham
- Score
- 67/100
- State rank
- #78
- US rank
- #10412
Category grades
Schools grade is shown separately in the Schools card above.
Census & demographics
- Census place
- Birmingham, AL
- County
- Jefferson County · 527,445 people
- City population
- 210,422
- Metro
- Birmingham-Hoover, AL
- Population (ZIP)
- 24,924
- Household income
- $34,884
- Rent vs Own
- Severe rent burden
- 2161.0
Population outlook (Jefferson County) Hauer SSP2
- Today (2025)
- 669,185 people
- By 2030
- 669,694 · +0.1%
- By 2040
- 661,388 · -1.2%
- By 2050
- 643,086 · -3.9%
- By 2075
- 577,267 · -13.7%
- By 2100
- 474,758 · -29.1%
Race, ethnicity, and origin ACS 2023
- Neighborhood character
- Predominantly Black (77%)
- Race & ethnicity
- Black 77% White 10% Hispanic / Latino 10% Two or more races 4%
- Hispanic origin (detail)
- Mexican 7%
- Foreign-born
- 6% · Canada
- Languages at home
- 91% English-only · Spanish 8% French/Haitian/Cajun 1%
Political lean MEDSL · Jefferson
- 2024 margin
- D (+10.4) · D 54.6% · R 44.2% · Other 1.2%
- 2008→2024 swing
- +5.4pp toward D · 2008: 5.1pp · 2024: 10.4pp
- All cycles
- 2024: D+10.4 2020: D+13.2 2016: D+7.2 2012: D+6.0 2008: D+5.1
Not yet ingested
- Civics
- —
Market trends
- HPI YoY
- ▼ -49.29%
- Current HPI
- 91.2903
- Rent YoY
- ▬ -0.01%
- Metro
- Birmingham-Hoover, AL
- State GDP YoY
- ▲ 2.94%
- F500 in state
- 4
Industry mix (Fortune 500 HQ in AL)
| Industry | F500 HQs | Revenue |
|---|---|---|
| Financial Services | 1 | $8B |
|
||
| Healthcare | 1 | $5B |
|
||
Price history
+76.6% since first listed5 events — show timeline
- 2024-08-19 Pending — Greater Alabama MLS
- 2024-08-07 Relisted — Greater Alabama MLS
- 2024-07-25 Pending — Greater Alabama MLS
- 2024-07-23 Listed $47,500 Greater Alabama MLS
- 1995-04-13 Sold (Public Records) $26,900 Public Records
Property tax history
+9.7%/yrLatest (2025): $1,003 · +9.8% YoY. Source: county tax records.
Cash-flow waterfall
monthlySold comps — $/sqft
last 12 mo · ≤1 miLoading sold comps…