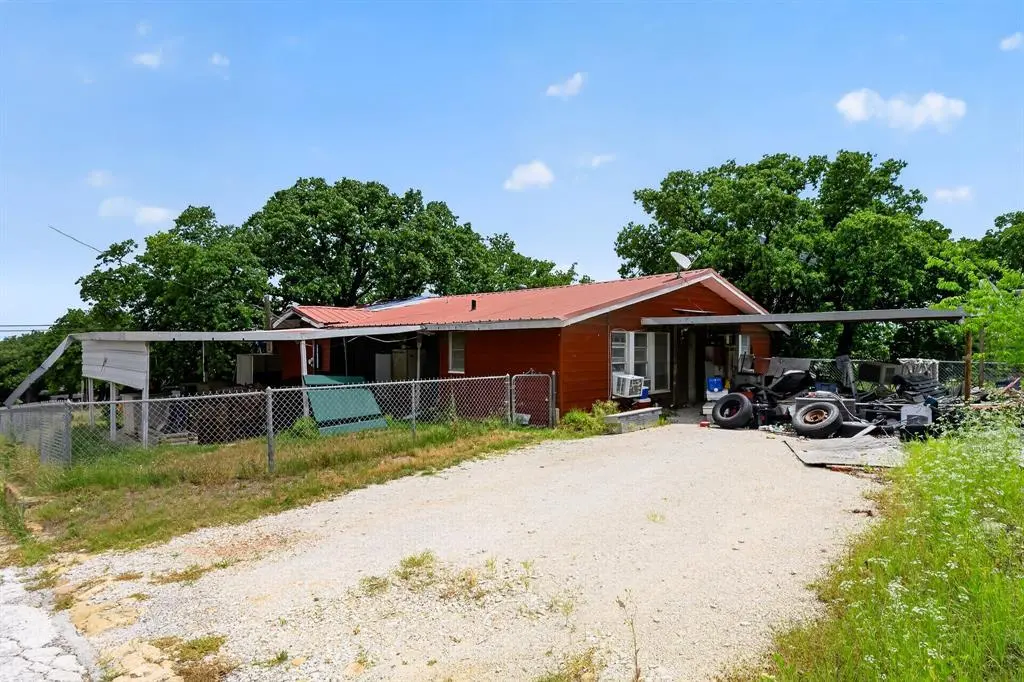
810 W Plummer St · Eastland, TX
Flood risk 1/10 · Minimal
- FEMA flood zone
- X
- Chance of flooding over 30 yrs
- 0.0%
- Est. flood insurance / yr
- $507 – $1,088
Fire risk 5/10 · Moderate
- Est. fire insurance / yr
- $1,222 – $2,270
Heat risk 7/10 · Major
- Hot days now (above 106°F)
- 7 days/yr
- Hot days in 30 yrs
- 23 days/yr
Wind risk 4/10 · Minor
- Chance of severe wind over 30 yrs
- 18.0%
Air-quality risk 1/10 · Minimal
- Unhealthy air days now
- 0 days/yr
- Unhealthy air days in 30 yrs
- 0 days/yr
Risk factors via First Street. Map © Google.
Why this score? — see what drove the B- grade
The composite is a weighted blend of 9 inputs, each scored 0–100. Each bar is that input's sub-score; the figure is the points it added to the 100-point composite (weight × sub-score).
- Cash flow +30.0/30.0
- 1% rule +10.0/10.0
- DSCR +10.0/10.0
- ARV discount +7.5/15.0
- Livability +3.8/5.0
- Schools +3.6/10.0
- Rent growth +2.5/5.0
- Condition / age +2.5/5.0
- Appreciation +0.0/10.0
$79,999
🖨 Deal sheet 📄 Offer letter ✓ Due diligence
Listing remarks
Opportunity awaits in Eastland with this single-story detached home located within close proximity to local schools. The interior layout features wood-paneled walls throughout, a central living area with exposed wood ceiling beams, a dedicated laundry space, and an integrated eat-in kitchen configuration. Additional interior square footage includes a bonus game room space complete with a built-in dry bar fixture. The home features one bedroom and two full bathrooms. This property is being sold as-is and requires extensive cosmic, structural, and mechanical renovations throughout. Cash or conventional construction financing required. Bring your tools and design ideas to maximize this propert
Key facts
- Wood-paneled walls
- Bonus game room
- 5,968 sq ft lot
Tags
Property features AI
Finance
- Financial info: Treat as clear loan type; No second mortgage
- HOA & community: No HOA / association
Exterior
- Parking: Carport (1 covered carport space)
- Utilities: City water; City sewer; Electricity connected; Cable available
- Home design: Single-family residence; Residential property; One-story
- Construction: Built in 1947
- Exterior features: Asphalt surfaces; Lot under 0.5 acre; Subdivision: Daugherty
Interior
- Kitchen: Dishwasher; Microwave; Double oven; Refrigerator; Eat-in kitchen
- Bedrooms: 3 bedrooms (all on the main level); Primary bedroom on main level
- Bathrooms: 2 full bathrooms (both on the main level)
- Interior features: Cable TV available; Dry bar; Eat-in kitchen; Natural woodwork; Paneling; One living area; One dining area; Total room count 8; One level
- Laundry & utility: Washer; Dryer
Neighborhood map
What this means for you Summary
Snapshot
- This is a 3-bed/1.0-bath single-family listed at $80k.
Deal economics
- At list price, monthly cash flow is $564 ($7k/yr) — positive.
- The deal already cash-flows at list — no discount required.
- Meets the 1% rule at list price ($1k rent vs $80k).
- Recommended offer: $79k (1.5% below list) — sets the bar for market timing.
- Cap rate 14.8% vs local median 3.1% in Eastland — top-decile yield for the area; either an underpriced asset or a hidden risk that comps aren't pricing in. Stress-test before assuming the spread holds.
Location & tenants
- Location reads 76/100 on livability (#104 in TX, #3,483 nationally) — a middle-class / working-renter tenant base. Strengths: cost of living A+, housing A+, health & safety A+; Watch: amenities F, commute F, employment F.
- Eastland ISD (town): math 45% / reading 41% proficiency, ranked #349 of 826 in TX (top 42%) — families likely to look elsewhere, expect single-tenant / working-renter base with shorter leases.
- Zoned schools: Siebert El (math 49% / reading 43%, grade D-, #1,097 of 4,322 statewide, top 26%, 491 students, 65% FRL) — zoned schools average 65% FRL vs 50% district-wide (16 pts higher); higher-poverty schools than district average — tighter screening recommended.
- Market conditions: 84 active listings in the ZIP; 10 units permitted in Eastland County in 2024 (0 in 5+ unit buildings).
Forward outlook
- Local home prices are declining (-3.0%/yr); year-one equity from $553 of loan paydown is wiped out by about $2k of value loss. Plan a longer hold.
- Eastland County population projected at -14% by 2050 — secular population decline; favor cash flow + early exit over multi-decade hold.
- At projected returns (-3.0% appreciation + 3.0% rent growth), your $22k cash investment doubles in ~4 years — after that, you're playing with house money.
Negotiation context
- It's been on market 30 days — a 2% lower offer ($79k) is reasonable based on typical stale-listing flexibility.
Risks & watch-outs
- Watch-outs: built in 1947 — expect roof / HVAC / electrical / plumbing capex.
- Climate carrying-cost: moderate wildfire risk; extreme-heat days projected 7→23/yr by 2055 (HVAC capex compounding) — expect insurance premiums to compound above CPI over the hold.
Questions for the listing agent
- Built in 1947 — when were the roof, HVAC, electrical panel, plumbing, and water heater last replaced?
- Is there a deadline driving the sale (1031 exchange, divorce, estate, relocation)? That informs how much negotiation room exists.
- Schools are D-rated, which usually means shorter tenancies and higher turnover. Who's the typical renter profile here, and what's been the actual vacancy rate?
- What's the average days-on-market for RENTAL listings here right now (not sales)? A rising rental-DOM trend means longer vacancies and softer asking-rent achievability than the comps imply.
- What's the recent tenant-quality profile in this submarket — average credit score on applications, eviction rate, late-payment / NSF rate, and stable-employment percentage? A property-management company in the area should have these aggregated.
- How much new for-sale + rental construction is in the pipeline within 1–3 miles? Heavy new supply typically softens prices + rents 12–24 months out; constrained supply supports both.
Investment metrics
- 1% rule
- 1.85% ✓
- Cap rate
- 14.76%
- Cash-on-cash
- 30.23%
- DSCR
- 2.35
- GRM
- 4.5
CMA / ARV
- ARV (on-the-fly)
- $205,956
- Comps found
- 12
Show comp detail 12 sales within ~0.75 mi
| Address | Dist | Beds/Ba | Sqft | Sold | Price | $/sf | Match |
|---|---|---|---|---|---|---|---|
| 606 S College Ave | 0.37mi | 3/2.0 | 1,942 (+2%) | 11mo | $175,000 | $90 | 66 |
| 320 N Lamar St | 0.54mi | 3/2.0 | 1,957 (+3%) | 1mo | $30,000 | $15 | 66 |
| 403 S Daugherty Ave | 0.27mi | 4/2.0 (+1) | 1,956 (+3%) | 11mo | $249,000 | $127 | 65 |
| 510 W Plummer St | 0.23mi | 4/2.0 (+1) | 1,849 (-3%) | 14mo | $195,000 | $105 | 64 |
| 600 S College Ave | 0.35mi | 3/2.0 | 1,694 (-11%) | 1mo | $175,000 | $103 | 60 |
| 604 S Seaman St | 0.56mi | 2/2.0 (-1) | 1,931 (+1%) | 6mo | $160,000 | $83 | 58 |
| 612 S Bassett St | 0.66mi | 3/2.0 | 1,894 (-1%) | 15mo | $205,000 | $108 | 51 |
| 516 S Halbryan St | 0.73mi | 3/2.0 | 1,890 (-1%) | 11mo | $215,000 | $114 | 51 |
| 501 S Daugherty Ave | 0.29mi | 3/3.0 | 2,152 (+13%) | 13mo | $232,000 | $108 | 46 |
| 714 S Ammerman Ave | 0.37mi | 3/2.0 | 1,627 (-15%) | 14mo | $240,000 | $148 | 42 |
| 601 S Bassett St | 0.61mi | 3/2.0 | 1,650 (-14%) | 15mo | $192,500 | $117 | 33 |
| 209 S Virginia Ave | 0.73mi | 4/3.0 (+1) | 2,025 (+6%) | 19mo | $182,000 | $90 | 27 |
Match score weights: distance 35% · size 25% · config 20% · recency 20%. Top-matched comps best support the ARV.
Projected returns pro-forma
-3.0% appreciation · 3.0% rent growth · sell at horizon
- IRR
- 24.9%
- Equity multiple
- 2.03×
- Total profit
- $23,031
- Equity at exit
- $11,928
- IRR
- 32.7%
- Equity multiple
- 3.97×
- Total profit
- $66,550
- Equity at exit
- $6,917
Cash invested: $22,400 (down + closing). Projections, not guarantees.
Landlord ↔ Tenant lean methodology
- Overall (STATE)
- 87 Strongly Landlord-Friendly
- State Texas
- 87 Strongly Landlord-Friendly · R+5
- County
- — inherits STATE
- City
- — inherits STATE
ZIP-level market 76448
- Home prices YoY
- -21.7%
- Active inventory
- 84
- Price-to-rent
- 4.5×
Monthly cashflow live
- Estimated rent
- $1,477 medium interval (Pro) →
- Mortgage (P&I)
- −$420
- Tax from tax record
- −$149 /mo · $1,793/yr
- Insurance
- −$33
- HOA
- −$0
- Vacancy / Maint / Mgmt
- −$310
- Net cashflow
- $564
Break-even live
UW: 25.0% down · 7.5% · 30yr · 1.5% tax · 5.0% vac · 8.0% maint · 8.0% mgmt
Financing live
Cash to close
- Down payment
- $20,000
- Closing costs
- $2,400
- Reserves months
- —
- Total cash needed
- —
Loan-product check · same deal, 3 products live
Conventional
25% down · 7.5% · 30yr
- Down + closing
- —
- Monthly P&I
- —
- Monthly cashflow
- —
- DSCR
- —
- Eligible?
- —
Personal DTI + credit; lowest rate.
DSCR
20% down · 8.5% · 30yr
- Down + closing
- —
- Monthly P&I
- —
- Monthly cashflow
- —
- DSCR
- —
- Eligible?
- —
No personal income docs; deal must DSCR.
Hard money
10% down · 12.0% · 12mo
- Down + closing
- —
- Monthly P&I
- —
- Monthly cashflow
- —
- DSCR
- —
- Eligible?
- —
Short-term bridge; refi at stabilization.
Listing history 17 events
-
2026-06-18days on market $79,999 Active 30 DOM
-
2026-06-17days on market $79,999 Active 29 DOM
-
2026-06-16days on market $79,999 Active 28 DOM
-
2026-06-15days on market $79,999 Active 27 DOM
-
2026-06-13days on market $79,999 Active 25 DOM
-
2026-06-12days on market $79,999 Active 24 DOM
-
2026-06-09days on market $79,999 Active 21 DOM
-
2026-06-09price $79,999 Active 20 DOM
-
2026-06-08days on market $82,500 Active 20 DOM
-
2026-06-08days on market $82,500 Active 19 DOM
-
2026-06-07pricedays on market $82,500 Active 18 DOM
-
2026-06-03days on market $89,999 Active 15 DOM
-
2026-06-02days on market $89,999 Active 14 DOM
-
2026-06-01days on market $89,999 Active 13 DOM
-
2026-05-31days on market $89,999 Active 12 DOM
-
2026-05-19$100,000 Active
-
2024-03-12soldstatus
ⓘ Source: listings_history table (triggers on properties + properties_extension) + one-shot
backfill from property_details.listing_events for pre-trigger history.
Tax reassessment forecast TX · Resets to sale price
- Current annual tax
- $1,793 · $149/mo
- Projected year-2 tax
- $1,793 · $149/mo
- Expected delta
- $0/yr ($0/mo · 0.0%)
ⓘ Screening estimate from a state-policy table — verify with the county assessor before closing.
Climate risk First Street
- Flood 1/10 Low FEMA zone X · 0% chance over 30 yrs
- Wildfire 5/10 Major
- Heat 7/10 Severe 7 d/yr ≥106°F today · 23 d/yr by 30 yrs out
- Wind 4/10 Moderate 18% chance of damaging wind over 30 yrs
- Air quality 1/10 Low 0 unhealthy d/yr today · 0 by 30 yrs out
Nearby sold comps map
Loading sold comps map…
Walkable amenities ~0.75 mi
Loading nearby amenities…
Taxation est. · year 1
- Rental income
- $17,721
- − Mortgage interest
- −$4,481
- − Property taxes
- −$1,793
- − Insurance
- −$400
- − Repairs & maintenance
- −$1,418
- − Management
- −$1,418
- − Depreciation
- −$2,327
- Taxable income
- $5,884
- Est. tax owed @ 24.0%
- −$1,412
- After-tax cash flow
- $5,360/yr
For passive investors: Depreciation is non-cash, so a rental often shows a tax loss while cash-flowing — sheltering income. Rental losses are passive: they offset passive income freely, and up to $25,000/yr can offset ordinary (W-2) income if you actively participate and your MAGI is under $100k (phasing out to $0 by $150k); unused losses carry forward. On sale, claimed depreciation is recaptured at up to 25%, and gains may owe capital-gains tax (a 1031 exchange can defer both). Figures are a year-1 estimate at your 24.0% rate — not tax advice; consult a CPA.
Schools (NCES district)
- District
- Eastland ISD
- NCES district ID
- 4817960
- Math proficiency
- 45% ▼ -5.00%
- Reading proficiency
- 41% ▼ -8.00%
- Median HH income
- $35,347
- Composite
- 35.61/100
- National rank
- #4894
- State rank
- #349 of 826 in TX
Livability — Eastland
- Score
- 76/100
- State rank
- #104
- US rank
- #3483
Category grades
Schools grade is shown separately in the Schools card above.
Census & demographics
- Census place
- Eastland, TX
- Population (ZIP)
- 4,920
Population outlook (Eastland County) Hauer SSP2
- Today (2025)
- 17,433 people
- By 2030
- 16,908 · -3.0%
- By 2040
- 15,855 · -9.1%
- By 2050
- 14,906 · -14.5%
- By 2075
- 12,843 · -26.3%
- By 2100
- 10,344 · -40.7%
Race, ethnicity, and origin ACS 2023
- Neighborhood character
- Predominantly White (85%)
- Race & ethnicity
- White 85% Two or more races 11% Hispanic / Latino 10% Black 3% Native American 1%
- Hispanic origin (detail)
- Mexican 8%
- Common ancestry
- Italian 21% Slovak 2% Serbian 1%
- Foreign-born
- 5% · Canada
- Languages at home
- 92% English-only · Spanish 8%
Political lean MEDSL · Eastland
- 2024 margin
- Solid R (+77.5) · D 11.0% · R 88.5%
- 2008→2024 swing
- -17.6pp toward R · 2008: -59.8pp · 2024: -77.5pp
- All cycles
- 2024: R+77.5 2020: R+75.4 2016: R+75.4 2012: R+68.9 2008: R+59.8
Not yet ingested
- Civics
- —
Market trends
- HPI YoY
- ▼ -52.60%
- Current HPI
- 190.0993
- Rent YoY
- —
- Metro
- —
- State GDP YoY
- ▲ 3.95%
- F500 in state
- 110
Industry mix (Fortune 500 HQ in TX)
| Industry | F500 HQs | Revenue |
|---|---|---|
| Energy | 16 | $1,198B |
|
||
| Technology | 5 | $198B |
|
||
| Engineering / Construction | 4 | $72B |
|
||
| Energy Services | 3 | $60B |
|
||
| Utilities | 3 | $41B |
|
||
| Healthcare | 2 | $330B |
|
||
Price history
2 events — show timeline
- 2026-05-19 Listed $100,000 NTREIS
- 2024-03-12 Sold (Public Records) — Public Records
Property tax history
+1.5%/yrLatest (2025): $1,793 · -2.5% YoY. Source: county tax records.
Cash-flow waterfall
monthlySold comps — $/sqft
last 12 mo · ≤1 miLoading sold comps…