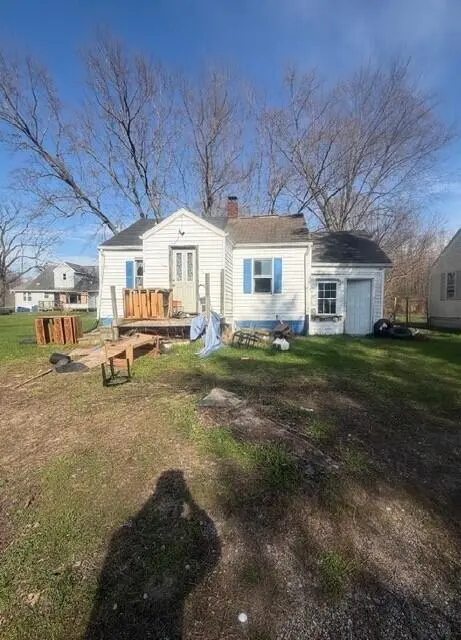
2742 Territorial Rd · Benton Heights, MI
Flood risk 1/10 · Minimal
- FEMA flood zone
- X (unshaded)
- Chance of flooding over 30 yrs
- 0.0%
- Est. flood insurance / yr
- $473 – $860
Fire risk 3/10 · Minor
- Est. fire insurance / yr
- $784 – $1,456
Heat risk 2/10 · Minimal
- Hot days now (above 101°F)
- 7 days/yr
- Hot days in 30 yrs
- 15 days/yr
Wind risk 2/10 · Minimal
- Chance of severe wind over 30 yrs
- —
Air-quality risk 3/10 · Minor
- Unhealthy air days now
- 2 days/yr
- Unhealthy air days in 30 yrs
- 3 days/yr
Risk factors via First Street. Map © Google.
Why this score? — see what drove the D grade
The composite is a weighted blend of 9 inputs, each scored 0–100. Each bar is that input's sub-score; the figure is the points it added to the 100-point composite (weight × sub-score).
- Cash flow +15.0/30.0
- ARV discount +7.5/15.0
- 1% rule +5.0/10.0
- DSCR +5.0/10.0
- Livability +3.2/5.0
- Rent growth +2.5/5.0
- Condition / age +2.5/5.0
- Schools +0.8/10.0
- Appreciation +0.0/10.0
$24,900
🖨 Deal sheet 📄 Offer letter ✓ Due diligence
Listing remarks MLS
Property currently consists of two dwellings on one parcel. Seller is in the process of splitting the property into two parcels (survey underway). 2728 is the residence that is for sale (this property is located behind main house 2742) and will be assigned its own parcel number upon township approval. Buyer to verify split status and timeline.
Key facts
- 0.75 acre lot
- Built 1940
- Listed 53 days
Neighborhood map
What this means for you Summary
Snapshot
- This is a 2-bed/1.0-bath single-family listed at $25k.
Deal economics
- At list price, monthly cash flow is $792 ($10k/yr) — positive.
- The deal already cash-flows at list — no discount required.
- Meets the 1% rule at list price ($1k rent vs $25k).
- Recommended offer: $24k (3.0% below list) — sets the bar for market timing.
Location & tenants
- Location reads 63/100 on livability (#506 in MI) — a middle-class / working-renter tenant base. Strengths: cost of living A+, housing A+, health & safety A+; Watch: crime C-, schools F, amenities F.
- Benton Harbor Area Schools (urban): math 4% / reading 7% proficiency, ranked #732 of 760 in MI (top 96%) — low school quality limits family demand, transient renter base, plan for 1-2y turnover; 89% free/reduced lunch — lower-income household profile, screen leases tightly.
- Market conditions: 179 active listings in the ZIP; 397 units permitted in Berrien County in 2024 (40 in 5+ unit buildings).
Forward outlook
- Local home prices are declining (-3.0%/yr); year-one equity from $172 of loan paydown is wiped out by about $747 of value loss. Plan a longer hold.
- Berrien County population projected at -16% by 2050 — secular population decline; favor cash flow + early exit over multi-decade hold.
- At projected returns (-3.0% appreciation + 3.0% rent growth), your $7k cash investment doubles in ~1 year — after that, you're playing with house money.
Negotiation context
- It's been on market 54 days — a 3% lower offer ($24k) is reasonable based on typical stale-listing flexibility.
- 7 sale attempts since 23y ago with the ask held roughly flat each time — persistent listings suggest the price (not the market) is what's stuck; bring a comps-based counter.
- Current owner paid $16k; list at $25k implies a 61% gain — meaningful room to come down on a strong offer.
Risks & watch-outs
- Watch-outs: built in 1940 — expect roof / HVAC / electrical / plumbing capex.
Questions for the listing agent
- It's been on market 54 days. Have you received any prior offers? Is the seller open to a 3% concession, seller financing, or rate buy-down credit?
- Built in 1940 — when were the roof, HVAC, electrical panel, plumbing, and water heater last replaced?
- Is there a deadline driving the sale (1031 exchange, divorce, estate, relocation)? That informs how much negotiation room exists.
- Schools are F-rated, which usually means shorter tenancies and higher turnover. Who's the typical renter profile here, and what's been the actual vacancy rate?
- The area grade is low — what's the realistic commute time and amenity access for the typical tenant pool here? Any planned neighborhood developments (good or bad) we should know about?
- What's the average days-on-market for RENTAL listings here right now (not sales)? A rising rental-DOM trend means longer vacancies and softer asking-rent achievability than the comps imply.
- What's the recent tenant-quality profile in this submarket — average credit score on applications, eviction rate, late-payment / NSF rate, and stable-employment percentage? A property-management company in the area should have these aggregated.
- How much new for-sale + rental construction is in the pipeline within 1–3 miles? Heavy new supply typically softens prices + rents 12–24 months out; constrained supply supports both.
Investment metrics
- 1% rule
- 5.00% ✓
- Cap rate
- 44.46%
- Cash-on-cash
- 136.30%
- DSCR
- 7.06
- GRM
- 1.7
CMA / ARV
- ARV (median comp)
- $126,213
- List price
- $24,900
- Delta
- -80.27%
- Verdict
- UNDERPRICED
- Comps
- 16 within 1.0 mi
Projected returns pro-forma
-3.0% appreciation · 3.0% rent growth · sell at horizon
- IRR
- —
- Equity multiple
- 7.66×
- Total profit
- $46,432
- Equity at exit
- $3,713
- IRR
- —
- Equity multiple
- 16.13×
- Total profit
- $105,501
- Equity at exit
- $2,153
Cash invested: $6,972 (down + closing). Projections, not guarantees.
Landlord ↔ Tenant lean methodology
- Overall (STATE)
- 62 Landlord-Friendly
- State Michigan
- 62 Landlord-Friendly · EVEN
- County
- — inherits STATE
- City
- — inherits STATE
ZIP-level market 49022
- Active inventory
- 179
- Price-to-rent
- 1.7×
Monthly cashflow live
- Estimated rent
- $1,244 medium interval (Pro) →
- Mortgage (P&I)
- −$131
- Tax from tax record
- −$50 /mo · $599/yr
- Insurance
- −$10
- HOA
- −$0
- Vacancy / Maint / Mgmt
- −$261
- Net cashflow
- $792
Break-even live
UW: 25.0% down · 7.5% · 30yr · 1.5% tax · 5.0% vac · 8.0% maint · 8.0% mgmt
Financing live
Cash to close
- Down payment
- $6,225
- Closing costs
- $747
- Reserves months
- —
- Total cash needed
- —
Loan-product check · same deal, 3 products live
Conventional
25% down · 7.5% · 30yr
- Down + closing
- —
- Monthly P&I
- —
- Monthly cashflow
- —
- DSCR
- —
- Eligible?
- —
Personal DTI + credit; lowest rate.
DSCR
20% down · 8.5% · 30yr
- Down + closing
- —
- Monthly P&I
- —
- Monthly cashflow
- —
- DSCR
- —
- Eligible?
- —
No personal income docs; deal must DSCR.
Hard money
10% down · 12.0% · 12mo
- Down + closing
- —
- Monthly P&I
- —
- Monthly cashflow
- —
- DSCR
- —
- Eligible?
- —
Short-term bridge; refi at stabilization.
Listing history 17 events
-
2026-06-03remarks 358-char remark
-
2026-06-03days on market $24,900 Active 54 DOM
-
2026-06-02days on market $24,900 Active 53 DOM
-
2026-06-01days on market $24,900 Active 52 DOM
-
2026-05-31days on market $24,900 Active 51 DOM
-
2026-05-30days on market $24,900 Active 50 DOM
-
2026-04-10$24,900 Active 345-char remark
Show marketing remark (348 chars)
Property currently consists of two dwellings on one parcel. Seller is in the process of splitting the property into two parcels (survey underway). 2728 is the residence that is for sale (this property is located behind main house 2742) and will be assigned its own parcel number upon township approval. Buyer to verify split status and timeline.
-
2026-04-10$24,900 Active 348-char remark
Show marketing remark (348 chars)
Property currently consists of two dwellings on one parcel. Seller is in the process of splitting the property into two parcels (survey underway). 2728 is the residence that is for sale (this property is located behind main house 2742) and will be assigned its own parcel number upon township approval. Buyer to verify split status and timeline.
-
2026-04-10$24,900 Active
Show marketing remark (348 chars)
Property currently consists of two dwellings on one parcel. Seller is in the process of splitting the property into two parcels (survey underway). 2728 is the residence that is for sale (this property is located behind main house 2742) and will be assigned its own parcel number upon township approval. Buyer to verify split status and timeline.
-
2014-09-15historical
-
2014-09-15historical
-
2014-09-15historical
-
2013-10-22soldstatus $15,500
-
2013-01-25$39,900
-
2004-04-07$89,900
-
2003-09-27$89,900
-
2003-09-27$89,900
ⓘ Source: listings_history table (triggers on properties + properties_extension) + one-shot
backfill from property_details.listing_events for pre-trigger history.
Tax reassessment forecast MI · Partial reset (capped growth)
- Current annual tax
- $599 · $50/mo
- Projected year-2 tax
- $599 · $50/mo
- Expected delta
- $0/yr ($0/mo · 0.0%)
ⓘ Screening estimate from a state-policy table — verify with the county assessor before closing.
Climate risk First Street
- Flood 1/10 Low FEMA zone X (unshaded) · 0% chance over 30 yrs
- Wildfire 3/10 Moderate
- Heat 2/10 Low 7 d/yr ≥101°F today · 15 d/yr by 30 yrs out
- Wind 2/10 Low
- Air quality 3/10 Moderate 2 unhealthy d/yr today · 3 by 30 yrs out
Nearby sold comps map
Loading sold comps map…
Walkable amenities ~0.75 mi
Loading nearby amenities…
Taxation est. · year 1
- Rental income
- $14,928
- − Mortgage interest
- −$1,395
- − Property taxes
- −$599
- − Insurance
- −$124
- − Repairs & maintenance
- −$1,194
- − Management
- −$1,194
- − Depreciation
- −$724
- Taxable income
- $9,697
- Est. tax owed @ 24.0%
- −$2,327
- After-tax cash flow
- $7,176/yr
For passive investors: Depreciation is non-cash, so a rental often shows a tax loss while cash-flowing — sheltering income. Rental losses are passive: they offset passive income freely, and up to $25,000/yr can offset ordinary (W-2) income if you actively participate and your MAGI is under $100k (phasing out to $0 by $150k); unused losses carry forward. On sale, claimed depreciation is recaptured at up to 25%, and gains may owe capital-gains tax (a 1031 exchange can defer both). Figures are a year-1 estimate at your 24.0% rate — not tax advice; consult a CPA.
Schools (NCES district)
- District
- Benton Harbor Area Schools
- NCES district ID
- 2604830
- Math proficiency
- 4% ▬ 0.00%
- Reading proficiency
- 7% ▬ 0.00%
- Median HH income
- $27,038
- Composite
- 7.53/100
- National rank
- #14787
- State rank
- #732 of 760 in MI
Livability — Benton Heights
- Score
- 63/100
- State rank
- #506
- US rank
- #15039
Category grades
Schools grade is shown separately in the Schools card above.
Census & demographics
- Census place
- Benton Heights, MI
- Population (ZIP)
- 29,796
Population outlook (Berrien County) Hauer SSP2
- Today (2025)
- 149,273 people
- By 2030
- 145,211 · -2.7%
- By 2040
- 135,435 · -9.3%
- By 2050
- 125,543 · -15.9%
- By 2075
- 103,986 · -30.3%
- By 2100
- 82,256 · -44.9%
Race, ethnicity, and origin ACS 2023
- Neighborhood character
- Diverse neighborhood (Simpson 0.61)
- Race & ethnicity
- Black 50% White 37% Hispanic / Latino 7% Two or more races 6% Native American 2%
- Hispanic origin (detail)
- Mexican 6%
- Common ancestry
- Romanian 1% Lithuanian 1% Slovak 1%
- Foreign-born
- 3% · Canada
- Languages at home
- 94% English-only · Spanish 5%
Political lean MEDSL · Berrien
- 2024 margin
- Lean R (+7.9) · D 45.4% · R 53.2% · Other 1.4%
- 2008→2024 swing
- -13.3pp toward R · 2008: 5.5pp · 2024: -7.9pp
- All cycles
- 2024: R+7.9 2020: R+7.4 2016: R+12.7 2012: R+6.6 2008: D+5.5
Not yet ingested
- Civics
- —
Market trends
- HPI YoY
- ▼ -309.81%
- Current HPI
- 209.9723
- Rent YoY
- —
- Metro
- —
- State GDP YoY
- ▲ 1.37%
- F500 in state
- 28
Industry mix (Fortune 500 HQ in MI)
| Industry | F500 HQs | Revenue |
|---|---|---|
| Automotive Parts | 3 | $48B |
|
||
| Automotive | 2 | $372B |
|
||
| Chemicals | 1 | $45B |
|
||
| Automotive Retail | 1 | $29B |
|
||
| Healthcare / Medical Devices | 1 | $23B |
|
||
| Automotive Technology | 1 | $20B |
|
||
Price history
-72.3% since first listed11 events — show timeline
- 2026-04-10 Listed $24,900 REALCOMP
- 2026-04-10 Listed $24,900 MiRealSource-MiMLS
- 2026-04-10 Listed $24,900 SW Michigan MLS
- 2014-09-15 Listing Removed — SW Michigan MLS
- 2014-09-15 Listing Removed — SW Michigan MLS
- 2014-09-15 Listing Removed — SW Michigan MLS
- 2013-10-22 Sold (MLS) $15,500 SW Michigan MLS
- 2013-01-25 Listed $39,900 SW Michigan MLS
- 2004-04-07 Listed $89,900 SW Michigan MLS
- 2003-09-27 Listed $89,900 SW Michigan MLS
- 2003-09-27 Listed $89,900 SW Michigan MLS
Property tax history
-6.6%/yrLatest (2024): $599 · +23.0% YoY. Source: county tax records.
Cash-flow waterfall
monthlySold comps — $/sqft
last 12 mo · ≤1 miLoading sold comps…