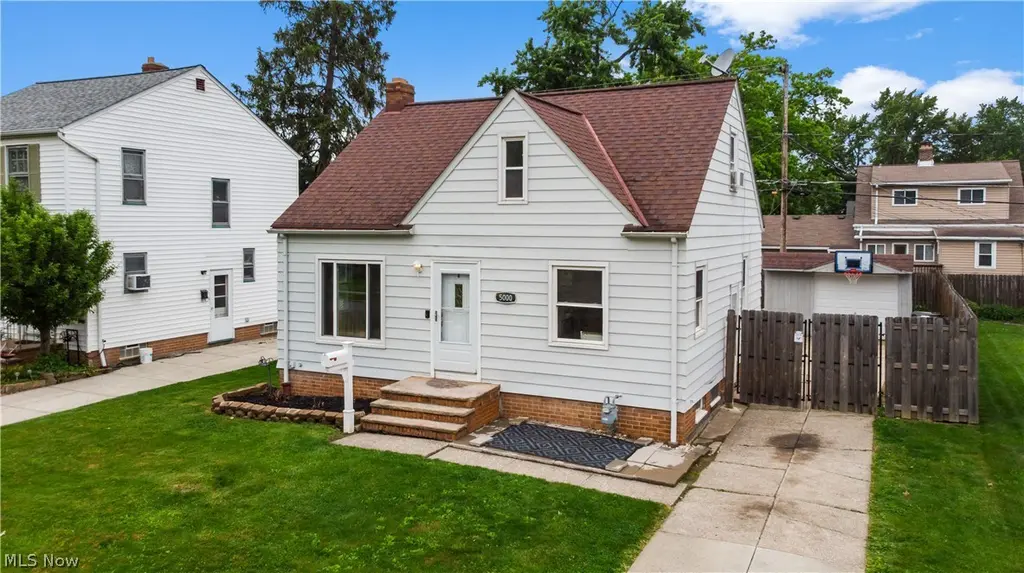
5000 Kenmore Ave · Parma, OH
Flood risk 1/10 · Minimal
- FEMA flood zone
- X (unshaded)
- Chance of flooding over 30 yrs
- 0.0%
- Est. flood insurance / yr
- $473 – $860
Fire risk 1/10 · Minimal
- Est. fire insurance / yr
- $713 – $1,323
Heat risk 3/10 · Minor
- Hot days now (above 95°F)
- 7 days/yr
- Hot days in 30 yrs
- 17 days/yr
Wind risk 1/10 · Minimal
- Chance of severe wind over 30 yrs
- —
Air-quality risk 3/10 · Minor
- Unhealthy air days now
- 2 days/yr
- Unhealthy air days in 30 yrs
- 4 days/yr
Risk factors via First Street. Map © Google.
Why this score? — see what drove the D grade
The composite is a weighted blend of 9 inputs, each scored 0–100. Each bar is that input's sub-score; the figure is the points it added to the 100-point composite (weight × sub-score).
- Cash flow +11.7/30.0
- ARV discount +6.6/15.0
- Rent growth +5.0/5.0
- Schools +4.1/10.0
- Livability +4.1/5.0
- 1% rule +3.5/10.0
- DSCR +3.4/10.0
- Condition / age +2.5/5.0
- Appreciation +0.0/10.0
$195,000
🖨 Deal sheet (PDF) 📄 Offer letter ✓ Due diligence
Listing remarks MLS
Great 3 bedroom bungalow with so much to offer. Nice sized living room. Kitchen with ample cabinets and counter space. Two bedrooms on the first floor and third bedroom located on the second floor. Basement awaits your finishing plans and ideas. Being sold as-is. Call today to schedule a private tour!
Key facts
- Brick patio
- Walk-in closet
- New bay window
Tags
Property features AI
Exterior
- Parking: Detached paved garage; 1 garage space
- Utilities: Public water; Public sewer
- Home design: 2-story home; Faces south; Block foundation
- Construction: Aluminum siding; Asphalt/fiberglass roof; Built according to public records; Home warranty included
- Exterior features: Front porch; Patio; Wood privacy fencing; Above-ground outdoor pool
Interior
- Kitchen: Dishwasher; Microwave; Range; Refrigerator; Eat-in kitchen layout
- Bedrooms: 2 main-level bedrooms
- Bathrooms: 1 full bathroom on the main level
- Heating & cooling: Central air; Forced air heating (gas)
- Interior features: Ceiling fan(s); Eat-in kitchen; Full, partially finished basement
- Laundry & utility: Washer hookup in basement; Electric dryer hookup; Gas dryer hookup; Washer and Dryer included
Neighborhood map
What this means for you Summary
Snapshot
- This is a 3-bed/1.0-bath single-family listed at $195k.
Deal economics
- At list price, monthly cash flow is $-58 ($-697/yr) — negative.
- To cash-flow at today's rent, offer at most $185k (5.3% below list).
- To meet the 1% rule (rent ≥ 1% of price), the offer needs to be $165k (15.1% below list).
- Recommended offer: $165k (15.1% below list) — sets the bar for 1% rule.
Location & tenants
- Location reads 82/100 on livability (#84 in OH, #1,232 nationally) — a professional / high-income tenant draw. Strengths: crime A+, amenities A+, cost of living A+; Watch: employment C-, commute F.
- Parma City (suburban): math 43% / reading 52% proficiency, ranked #469 of 656 in OH (top 72%) — families likely to look elsewhere, expect single-tenant / working-renter base with shorter leases.
- Zoned schools: Thoreau Park Elementary School (math 37% / reading 42%, grade F, #1,055 of 1,584 statewide, top 68%, 409 students, 60% FRL); Shiloh Middle School (math 27% / reading 46%, grade F, #539 of 654 statewide, top 83%, 511 students, 65% FRL); Parma High School (math 32% / reading 47%, grade F, #528 of 781 statewide, top 71%, 1,233 students, 55% FRL) — zoned schools average 60% FRL vs 41% district-wide (19 pts higher); higher-poverty schools than district average — tighter screening recommended.
- Market conditions: Rents rising fast (+10.6%/yr); 120 active listings in the ZIP; 21 comparable units currently listed for rent nearby; rentals leasing fast (median 10d on market — plan ~1-2 weeks tenant-placement turnaround); 1,441 units permitted in Cuyahoga County in 2024 (700 in 5+ unit buildings).
Forward outlook
- Local home prices are declining (-3.0%/yr); year-one equity from $1k of loan paydown is wiped out by about $6k of value loss. Plan a longer hold.
- Cuyahoga County population projected to shrink 8% by 2050 — rents likely to lag national; underwrite the cash flow, not the appreciation.
Negotiation context
- Only 5 days on market — expect competitive offers; lowballing is unlikely to land.
- 5 sale attempts since 24y ago with the ask held roughly flat each time — persistent listings suggest the price (not the market) is what's stuck; bring a comps-based counter.
- Current owner paid $52k; list at $195k implies a 275% gain — meaningful room to come down on a strong offer.
Risks & watch-outs
- Watch-outs: built in 1949 — expect roof / HVAC / electrical / plumbing capex.
Questions for the listing agent
- What do current leases actually rent for vs. the listed asking? Can we see a recent rent roll and the last 12 months of T-12 income?
- Built in 1949 — when were the roof, HVAC, electrical panel, plumbing, and water heater last replaced?
- Is there a deadline driving the sale (1031 exchange, divorce, estate, relocation)? That informs how much negotiation room exists.
- Schools are B-rated — typically a magnet for longer-tenancy family renters. What's the average tenant stay here, and is there a school-zone premium baked into asking?
- The area grade is low — what's the realistic commute time and amenity access for the typical tenant pool here? Any planned neighborhood developments (good or bad) we should know about?
- What's the average days-on-market for RENTAL listings here right now (not sales)? A rising rental-DOM trend means longer vacancies and softer asking-rent achievability than the comps imply.
- What's the recent tenant-quality profile in this submarket — average credit score on applications, eviction rate, late-payment / NSF rate, and stable-employment percentage? A property-management company in the area should have these aggregated.
- How much new for-sale + rental construction is in the pipeline within 1–3 miles? Heavy new supply typically softens prices + rents 12–24 months out; constrained supply supports both.
Investment metrics
- 1% rule
- 0.85% ✗
- Cap rate
- 5.94%
- Cash-on-cash
- -1.28%
- DSCR
- 0.94
- GRM
- 9.8
CMA / ARV
- ARV (on-the-fly)
- $191,100
- Comps found
- 12
Show comp detail 12 sales within ~0.75 mi
| Address | Dist | Beds/Ba | Sqft | Sold | Price | $/sf | Match |
|---|---|---|---|---|---|---|---|
| 4606 Lincoln Ave | 0.43mi | 3/2.0 | 1,070 (-2%) | 1mo | $184,700 | $173 | 71 |
| 5706 Virginia Ave | 0.27mi | 3/2.0 | 1,172 (+7%) | 0mo | $265,000 | $226 | 71 |
| 5910 Velma Ave | 0.70mi | 3/1.0 | 1,092 (0%) | 2mo | $147,900 | $135 | 66 |
| 3810 Russell Ave | 0.64mi | 3/2.0 | 1,088 (-0%) | 0mo | $189,900 | $175 | 65 |
| 5271 W 49th St | 0.60mi | 3/1.0 | 1,147 (+5%) | 1mo | $210,000 | $183 | 63 |
| 4413 Torrington Ave | 0.28mi | 3/2.0 | 968 (-11%) | 1mo | $210,000 | $217 | 63 |
| 5503 Westlake Ave | 0.23mi | 4/2.0 (+1) | 1,219 (+12%) | 0mo | $252,000 | $207 | 60 |
| 5803 Merkle Ave | 0.71mi | 3/1.5 | 1,057 (-3%) | 2mo | $158,000 | $149 | 58 |
| 3908 Kenmore Ave | 0.41mi | 3/1.5 | 1,242 (+14%) | 0mo | $151,000 | $122 | 56 |
| 4312 Kenmore Ave | 0.30mi | 2/1.0 (-1) | 1,255 (+15%) | 1mo | $130,000 | $104 | 56 |
| 6307 Kenneth Ave | 0.44mi | 4/1.0 (+1) | 1,219 (+12%) | 0mo | $243,000 | $199 | 55 |
| 3423 Russell Ave | 0.75mi | 3/2.0 | 1,232 (+13%) | 0mo | $205,000 | $166 | 40 |
Match score weights: distance 35% · size 25% · config 20% · recency 20%. Top-matched comps best support the ARV.
Projected returns pro-forma
-3.0% appreciation · 8.0% rent growth · sell at horizon
- IRR
- -12.9%
- Equity multiple
- 0.51×
- Total profit
- $-26,519
- Equity at exit
- $29,075
- IRR
- 2.5%
- Equity multiple
- 1.22×
- Total profit
- $12,090
- Equity at exit
- $16,860
Cash invested: $54,600 (down + closing). Projections, not guarantees.
Landlord ↔ Tenant lean methodology
- Overall (STATE)
- 73 Landlord-Friendly
- State Ohio
- 73 Landlord-Friendly · R+6
- County
- — inherits STATE
- City
- — inherits STATE
ZIP-level market 44134
- Rents YoY
- 10.6%
- Active inventory
- 120
- Price-to-rent
- 9.8×
Monthly cashflow live
- Estimated rent
- $1,655 high interval (Pro) →
- Mortgage (P&I)
- −$1,023
- Tax from tax record
- −$262 /mo · $3,138/yr
- Insurance
- −$81
- HOA
- −$0
- Vacancy / Maint / Mgmt
- −$347
- Net cashflow
- $-58
Break-even live
Sensitivity live
| Price | -10% $52 | -5% $-3 | +0% $-58 | +5% $-113 | +10% $-168 |
|---|---|---|---|---|---|
| Rent | -10% $-189 | -5% $-123 | +0% $-58 | +5% $7 | +10% $73 |
| Rate | -1.0pp $40 | -0.5pp $-9 | base $-58 | +0.5pp $-109 | +1.0pp $-160 |
UW: 25.0% down · 7.5% · 30yr · 1.5% tax · 5.0% vac · 8.0% maint · 8.0% mgmt
Financing live
Cash to close
- Down payment
- $48,750
- Closing costs
- $5,850
- Reserves months
- —
- Total cash needed
- —
Loan-product check · same deal, 3 products live
Conventional
25% down · 7.5% · 30yr
- Down + closing
- —
- Monthly P&I
- —
- Monthly cashflow
- —
- DSCR
- —
- Eligible?
- —
Personal DTI + credit; lowest rate.
DSCR
20% down · 8.5% · 30yr
- Down + closing
- —
- Monthly P&I
- —
- Monthly cashflow
- —
- DSCR
- —
- Eligible?
- —
No personal income docs; deal must DSCR.
Hard money
10% down · 12.0% · 12mo
- Down + closing
- —
- Monthly P&I
- —
- Monthly cashflow
- —
- DSCR
- —
- Eligible?
- —
Short-term bridge; refi at stabilization.
Rent comps 21 comps
| Address | Beds | Baths | Sqft | Rent | $/sqft | DOM | Units | Dist |
|---|---|---|---|---|---|---|---|---|
| 4520 Kenmore Ave Cleveland, OH | 2.0 | 1.0 | 726 | $1,520 | $2.09 | 0d | 1 | 0.17mi |
| 4606 Lincoln Ave Cleveland, OH | 3.0 | 2.0 | 1418 | $1,995 | $1.41 | 0d | 1 | 0.43mi |
| 6505 Snow Rd Unit REAR Parma, OH | 3.0 | 1.5 | 1312 | $1,599 | $1.22 | 9d | 1 | 0.54mi |
| 5252 W 45th St Unit 1496134P Parma, OH | 3.0 | 2.0 | 1065 | $3,258 | $3.06 | 0d | 1 | 0.67mi |
| 3330 Fortune Ave Cleveland, OH | 3.0 | 1.5 | 1258 | $1,775 | $1.41 | 45d | 1 | 0.68mi |
| 5406 Merkle Ave Cleveland, OH | 2.0 | 1.0 | 946 | $1,300 | $1.37 | 6d | 1 | 0.71mi |
| 5406 Merkle Ave Cleveland, OH | 2.0 | 1.0 | 958 | $1,300 | $1.36 | 9d | 1 | 0.71mi |
| 5220 W 44th St #2 Parma, OH | 2.0 | 1.0 | 1156 | $1,400 | $1.21 | 25d | 1 | 0.75mi |
| 6007 Merkle Ave Unit Down Parma, OH | 3.0 | 1.0 | 1250 | $1,399 | $1.12 | 0d | 1 | 0.75mi |
| 6007 Merkle Ave Unit Down Parma, OH | 3.0 | 1.0 | 1250 | $1,399 | $1.12 | 4d | 1 | 0.75mi |
| 3027 Fortune Ave Unit 1 Parma, OH | 2.0 | 1.0 | 880 | $1,175 | $1.34 | 45d | 1 | 0.79mi |
| 3027 Fortune Ave Unit 2 Parma, OH | 2.0 | 1.0 | 726 | $1,075 | $1.48 | 0d | 1 | 0.79mi |
| 2907 Snow Rd Unit up Parma, OH | 3.0 | 1.0 | 1026 | $1,700 | $1.66 | 45d | 1 | 0.87mi |
| 2910 Fortune Ave Cleveland, OH | 2.0 | 1.0 | 744 | $1,775 | $2.39 | 25d | 1 | 0.88mi |
| 2611 Brookdale Ave Cleveland, OH | 3.0 | 1.0 | 1092 | $1,825 | $1.67 | 45d | 1 | 1.02mi |
| 2716 Lincoln Ave Unit 1288912P Parma, OH | 4.0 | 2.0 | 1205 | $4,050 | $3.36 | 0d | 1 | 1.02mi |
| 6099 Ridge Rd Cleveland, OH | 2.0 | 1.0 | 1020 | $1,200 | $1.18 | 23d | 1 | 1.05mi |
| 8326 Fernhill Ave Cleveland, OH | 3.0 | 1.0 | 1350 | $1,700 | $1.26 | 45d | 1 | 1.23mi |
| 7906 Lanyard Dr Unit 1496071P Parma, OH | 4.0 | 1.5 | 1227 | $5,834 | $4.75 | 9d | 1 | 1.27mi |
| 6403 Ridge Rd Cleveland, OH | 2.0 | 2.0 | 1110 | $1,450 | $1.31 | 18d | 1 | 1.46mi |
| 7903 Ackley Rd Unit 7903 Parma, OH | 3.0 | 1.0 | 1100 | $1,600 | $1.45 | 45d | 1 | 1.48mi |
Listing history 17 events
-
2026-05-22$195,000 Active
-
2016-03-10soldstatus $52,000 Sold 302-char remark
Show marketing remark (302 chars)
Great 3 bedroom bungalow with so much to offer. Nice sized living room. Kitchen with ample cabinets and counter space. Two bedrooms on the first floor and third bedroom located on the second floor. Basement awaits your finishing plans and ideas. Being sold as-is. Call today to schedule a private tour!
-
2016-02-17status Pending 302-char remark
Show marketing remark (302 chars)
Great 3 bedroom bungalow with so much to offer. Nice sized living room. Kitchen with ample cabinets and counter space. Two bedrooms on the first floor and third bedroom located on the second floor. Basement awaits your finishing plans and ideas. Being sold as-is. Call today to schedule a private tour!
-
2016-02-08historical Contingent 302-char remark
Show marketing remark (302 chars)
Great 3 bedroom bungalow with so much to offer. Nice sized living room. Kitchen with ample cabinets and counter space. Two bedrooms on the first floor and third bedroom located on the second floor. Basement awaits your finishing plans and ideas. Being sold as-is. Call today to schedule a private tour!
-
2016-01-28$42,300 Active 302-char remark
Show marketing remark (302 chars)
Great 3 bedroom bungalow with so much to offer. Nice sized living room. Kitchen with ample cabinets and counter space. Two bedrooms on the first floor and third bedroom located on the second floor. Basement awaits your finishing plans and ideas. Being sold as-is. Call today to schedule a private tour!
-
2015-12-18historical
-
2015-12-17status Active
-
2015-10-05price $44,060
-
2015-09-22status Pending
-
2015-08-16$44,160 Active
-
2002-06-25soldstatus $102,000
-
2002-06-25soldstatus $102,000
-
2002-01-14$104,900
-
1996-09-30soldstatus $95,000
-
1996-06-05soldstatus $66,500
-
1985-10-25soldstatus $13,000
-
1985-10-25soldstatus $52,000
ⓘ Source: listings_history table (triggers on properties + properties_extension) + one-shot
backfill from property_details.listing_events for pre-trigger history.
Tax reassessment forecast OH · Partial reset (capped growth)
- Current annual tax
- $3,138 · $262/mo
- Projected year-2 tax
- $3,138 · $262/mo
- Expected delta
- $0/yr ($0/mo · 0.0%)
ⓘ Screening estimate from a state-policy table — verify with the county assessor before closing.
Climate risk First Street
- Flood 1/10 Low FEMA zone X (unshaded) · 0% chance over 30 yrs
- Wildfire 1/10 Low
- Heat 3/10 Moderate 7 d/yr ≥95°F today · 17 d/yr by 30 yrs out
- Wind 1/10 Low
- Air quality 3/10 Moderate 2 unhealthy d/yr today · 4 by 30 yrs out
Nearby sold comps map
Loading sold comps map…
Walkable amenities ~0.75 mi
Loading nearby amenities…
Taxation est. · year 1
- Rental income
- $19,857
- − Mortgage interest
- −$10,923
- − Property taxes
- −$3,138
- − Insurance
- −$975
- − Repairs & maintenance
- −$1,589
- − Management
- −$1,589
- − Depreciation
- −$5,673
- Taxable loss
- −$4,029
- Est. tax savings @ 24.0%
- +$967
- After-tax cash flow
- $270/yr
For passive investors: Depreciation is non-cash, so a rental often shows a tax loss while cash-flowing — sheltering income. Rental losses are passive: they offset passive income freely, and up to $25,000/yr can offset ordinary (W-2) income if you actively participate and your MAGI is under $100k (phasing out to $0 by $150k); unused losses carry forward. On sale, claimed depreciation is recaptured at up to 25%, and gains may owe capital-gains tax (a 1031 exchange can defer both). Figures are a year-1 estimate at your 24.0% rate — not tax advice; consult a CPA.
Schools (NCES district)
- District
- Parma City
- NCES district ID
- 3904463
- Math proficiency
- 43% ▼ -18.00%
- Reading proficiency
- 52% ▼ -10.00%
- Median HH income
- $50,371
- Composite
- 40.72/100
- National rank
- #3662
- State rank
- #469 of 656 in OH
Livability — Parma
- Score
- 82/100
- State rank
- #84
- US rank
- #1232
Category grades
Schools grade is shown separately in the Schools card above.
Census & demographics
- Census place
- Parma, OH
- County
- Cuyahoga County · 1,090,369 people
- City population
- 66,574
- Metro
- Cleveland-Elyria, OH
- Population (ZIP)
- 37,774
- Household income
- $68,625
- Rent vs Own
- Severe rent burden
- 668.0
Population outlook (Cuyahoga County) Hauer SSP2
- Today (2025)
- 1,244,621 people
- By 2030
- 1,230,093 · -1.2%
- By 2040
- 1,189,108 · -4.5%
- By 2050
- 1,145,706 · -7.9%
- By 2075
- 1,076,557 · -13.5%
- By 2100
- 978,987 · -21.3%
Race, ethnicity, and origin ACS 2023
- Neighborhood character
- Predominantly White (85%)
- Race & ethnicity
- White 85% Two or more races 6% Hispanic / Latino 5% Black 3% Asian 3%
- Common ancestry
- Romanian 14% Subsaharan African 6% Slovak 1%
- Foreign-born
- 11% · Canada, Vietnam
- Languages at home
- 84% English-only · Russian/Polish/Slavic 7% Spanish 3% Other Indo-European 2%
Political lean MEDSL · Cuyahoga
- 2024 margin
- Solid D (+31.5) · D 65.4% · R 33.9%
- 2008→2024 swing
- -7.4pp toward R · 2008: 38.9pp · 2024: 31.5pp
- All cycles
- 2024: D+31.5 2020: D+34.1 2016: D+35.0 2012: D+38.7 2008: D+38.9
Not yet ingested
- Civics
- —
Market trends
- HPI YoY
- ▼ -215.17%
- Current HPI
- 184.0553
- Rent YoY
- ▲ 10.56%
- Metro
- Cleveland-Elyria, OH
- State GDP YoY
- ▲ 1.98%
- F500 in state
- 48
Industry mix (Fortune 500 HQ in OH)
| Industry | F500 HQs | Revenue |
|---|---|---|
| Insurance | 3 | $145B |
|
||
| Industrial Machinery | 3 | $49B |
|
||
| Financial Services | 3 | $24B |
|
||
| Consumer Goods | 2 | $93B |
|
||
| Aerospace / Defense | 2 | $47B |
|
||
| Utilities | 2 | $33B |
|
||
Price history
+1400.0% since first listed17 events — show timeline
- 2026-05-22 Listed $195,000 MLSNOW
- 2016-03-10 Sold (MLS) $52,000 MLSNOW
- 2016-02-17 Pending — MLSNOW
- 2016-02-08 Contingent — MLSNOW
- 2016-01-28 Listed $42,300 MLSNOW
- 2015-12-18 Listing Removed — MLSNOW
- 2015-12-17 Relisted — MLSNOW
- 2015-10-05 Price Changed $44,060 MLSNOW
- 2015-09-22 Pending — MLSNOW
- 2015-08-16 Listed $44,160 MLSNOW
- 2002-06-25 Sold (Public Records) $102,000 Public Records
- 2002-06-25 Sold (MLS) $102,000 MLSNOW
- 2002-01-14 Listed $104,900 MLSNOW
- 1996-09-30 Sold (Public Records) $95,000 Public Records
- 1996-06-05 Sold (Public Records) $66,500 Public Records
- 1985-10-25 Sold (Public Records) $52,000 Public Records
- 1985-10-25 Sold (Public Records) $13,000 Public Records
Property tax history
+4.4%/yrLatest (2025): $3,138 · -5.3% YoY. Source: county tax records.
Cash-flow waterfall
monthlySold comps — $/sqft
last 12 mo · ≤1 miLoading sold comps…