 Duplex
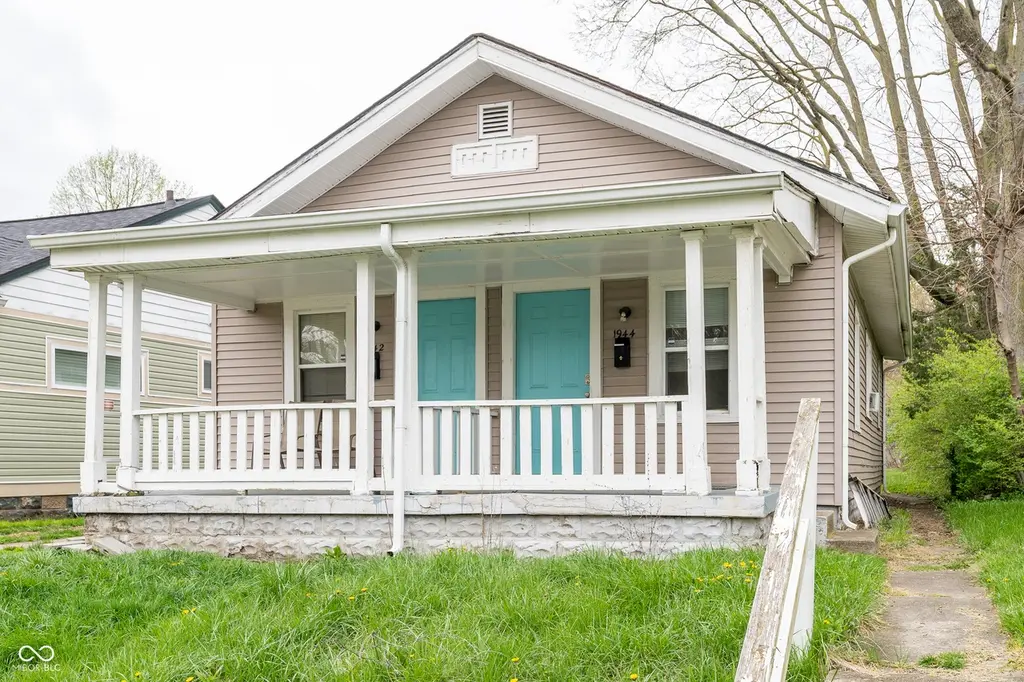
1942 Houston St · Indianapolis city (balance), IN
Flood risk 1/10 · Minimal
- FEMA flood zone
- X (unshaded)
- Chance of flooding over 30 yrs
- 0.0%
- Est. flood insurance / yr
- $507 – $1,088
Fire risk 1/10 · Minimal
- Est. fire insurance / yr
- $717 – $1,331
Heat risk 3/10 · Minor
- Hot days now (above 102°F)
- 7 days/yr
- Hot days in 30 yrs
- 19 days/yr
Wind risk 2/10 · Minimal
- Chance of severe wind over 30 yrs
- 0.0%
Air-quality risk 4/10 · Minor
- Unhealthy air days now
- 5 days/yr
- Unhealthy air days in 30 yrs
- 7 days/yr
Risk factors via First Street. Map © Google.
Why this score? — see what drove the B- grade
The composite is a weighted blend of 9 inputs, each scored 0–100. Each bar is that input's sub-score; the figure is the points it added to the 100-point composite (weight × sub-score).
- Cash flow +30.0/30.0
- 1% rule +10.0/10.0
- DSCR +10.0/10.0
- ARV discount +7.5/15.0
- Rent growth +2.7/5.0
- Livability +2.5/5.0
- Condition / age +2.5/5.0
- Schools +1.4/10.0
- Appreciation +0.0/10.0
$155,000
🖨 Deal sheet (PDF) 📄 Offer letter ✓ Due diligence
Multi-family units
County records classify this as Multi-Family (2-4 Unit). Listing-text estimate: 2 units. confirmed
Listing remarks MLS
1-bed double available now! Home has new gutters & downspouts, updated kitchen, new furnace on 1944 side, new water heaters on both sides, new bathrooms, could make a nice rental or house hack!
Key facts
- Fully leased
- Brookside pool
- Park amenities
Tags
Property features AI
Finance
- Other: Multi-unit totals: 2 units, 8 rooms overall
- Financial info: Property listed as residential income duplex with two units; Unit 1 rent reported as $825 per month; Unit 2 rent reported as $850 per month; Gross income and expenses reported as 0 in the provided data; Owner pays: Not Applicable
Exterior
- Parking: On-street parking
- Utilities: Solid waste service available; Building utilities described as 'Other'
- Home design: Duplex (residential income property); Conversion: No
- Construction: Vinyl siding
- Exterior features: Property currently used for residential purposes; Lot under 1/4 acre (0.12 acre); Lot features listed as not applicable; Road access listed as not applicable
Interior
- Kitchen: Each unit has a 12x9 kitchen
- Bedrooms: Two bedrooms per unit (multi-unit totals: 2 beds each)
- Bathrooms: Two bathrooms total across units (multi-unit total: 2 baths)
- Interior features: Building described as 'Other' (per listing information)
- Laundry & utility: Laundry connections provided for all units; Utilities listed as 'Other' for each unit
Neighborhood map
What this means for you Summary
Snapshot
- This is a 2 × 3-bed/3.0-bath units multifamily listed at $155k.
Deal economics
- At list price, monthly cash flow is $861 ($10k/yr) — positive. Per door: $430/mo.
- The deal already cash-flows at list — no discount required.
- Meets the 1% rule at list price ($2k rent vs $155k).
- Cap rate 13.0% vs local median 4.4% in Indianapolis city (balance) — top-decile yield for the area; either an underpriced asset or a hidden risk that comps aren't pricing in. Stress-test before assuming the spread holds.
Location & tenants
- Location reads: area grade B — affects rentability + tenant quality, not the cash-flow math above.
- Indianapolis Public Schools (urban): math 14% / reading 20% proficiency, ranked #286 of 301 in IN (top 95%) — low school quality limits family demand, transient renter base, plan for 1-2y turnover; 77% free/reduced lunch — lower-income household profile, screen leases tightly.
- Market conditions: Rents flat; 334 active listings in the ZIP; 2 comparable units currently listed for rent nearby; lower-income renter base — watch delinquency; 1,906 units permitted in Marion County in 2024 (621 in 5+ unit buildings).
- At $2,464/mo this rent would consume 78% of the median local household income ($38k/yr) (locally 2340% of renters already pay >50% of income on rent) — very limited rent-growth headroom before tenants either downsize or default.
Forward outlook
- Local home prices are declining (-3.0%/yr); year-one equity from $1k of loan paydown is wiped out by about $5k of value loss. Plan a longer hold.
- Marion County population projected at +18% by 2050 — long-run rental-demand tailwind backs the buy-and-hold thesis.
- At projected returns (-3.0% appreciation + 0.8% rent growth), your $43k cash investment doubles in ~6 years — after that, you're playing with house money.
Negotiation context
- Only 13 days on market — expect competitive offers; lowballing is unlikely to land.
- 8 sale attempts since 23y ago with the ask held roughly flat each time — persistent listings suggest the price (not the market) is what's stuck; bring a comps-based counter.
- Current owner paid $125k; 24% above their basis — modest negotiation headroom, anchor on the comps not their cost.
Risks & watch-outs
- Watch-outs: built in 1922 — expect roof / HVAC / electrical / plumbing capex.
Questions for the listing agent
- Can we see the unit-by-unit rent roll, current vacancy, and any below-market leases? What's the average tenancy length?
- What capital expenditures (roof, boiler, parking lot, exteriors) have been made in the last 5 years, and what's planned in the next 2?
- Built in 1922 — when were the roof, HVAC, electrical panel, plumbing, and water heater last replaced?
- Is there a deadline driving the sale (1031 exchange, divorce, estate, relocation)? That informs how much negotiation room exists.
- What's the average days-on-market for RENTAL listings here right now (not sales)? A rising rental-DOM trend means longer vacancies and softer asking-rent achievability than the comps imply.
- What's the recent tenant-quality profile in this submarket — average credit score on applications, eviction rate, late-payment / NSF rate, and stable-employment percentage? A property-management company in the area should have these aggregated.
- How much new apartment / multifamily construction is in the pipeline within 1–3 miles? Heavy new supply (>2% of stock underway) typically softens rents 12–24 months out; light construction supports rent growth.
Investment metrics
- 1% rule
- 1.59% ✓
- Cap rate
- 12.95%
- Cash-on-cash
- 23.79%
- DSCR
- 2.06
- GRM
- 5.2
CMA / ARV
No comps found within radius.
Projected returns pro-forma
-3.0% appreciation · 0.81% rent growth · sell at horizon
- IRR
- 14.5%
- Equity multiple
- 1.56×
- Total profit
- $24,422
- Equity at exit
- $23,111
- IRR
- 21.5%
- Equity multiple
- 2.64×
- Total profit
- $71,160
- Equity at exit
- $13,402
Cash invested: $43,400 (down + closing). Projections, not guarantees.
Landlord ↔ Tenant lean methodology
- Overall (STATE)
- 90 Strongly Landlord-Friendly
- State Indiana
- 90 Strongly Landlord-Friendly · R+11
- County
- — inherits STATE
- City
- — inherits STATE
ZIP-level market 46218
- Home prices YoY
- -17.1%
- Rents YoY
- 0.8%
- Active inventory
- 334
- Price-to-rent
- 10.5×
Monthly cashflow live
- Estimated rent
- $2,464 high interval (Pro) →
- Mortgage (P&I)
- −$813
- Tax from tax record
- −$209 /mo · $2,504/yr
- Insurance
- −$65
- HOA
- −$0
- Vacancy / Maint / Mgmt
- −$517
- Net cashflow
- $861
Break-even live
Sensitivity live
| Price | -10% $948 | -5% $904 | +0% $861 | +5% $817 | +10% $773 |
|---|---|---|---|---|---|
| Rent | -10% $666 | -5% $763 | +0% $861 | +5% $958 | +10% $1,055 |
| Rate | -1.0pp $939 | -0.5pp $900 | base $861 | +0.5pp $820 | +1.0pp $779 |
2-unit breakdown (identical units grouped — click to expand)
| Units | Beds | Baths | Est. rent |
|---|---|---|---|
| 2× units | 3 | 3 | $2,464 |
| #1 | 3 | 3 | $1,232 |
| #2 | 3 | 3 | $1,232 |
| Total (2 units) | $2,464 | ||
UW: 25.0% down · 7.5% · 30yr · 1.5% tax · 5.0% vac · 8.0% maint · 8.0% mgmt
Financing live
Cash to close
- Down payment
- $38,750
- Closing costs
- $4,650
- Reserves months
- —
- Total cash needed
- —
Loan-product check · same deal, 3 products live
Conventional
25% down · 7.5% · 30yr
- Down + closing
- —
- Monthly P&I
- —
- Monthly cashflow
- —
- DSCR
- —
- Eligible?
- —
Personal DTI + credit; lowest rate.
DSCR
20% down · 8.5% · 30yr
- Down + closing
- —
- Monthly P&I
- —
- Monthly cashflow
- —
- DSCR
- —
- Eligible?
- —
No personal income docs; deal must DSCR.
Hard money
10% down · 12.0% · 12mo
- Down + closing
- —
- Monthly P&I
- —
- Monthly cashflow
- —
- DSCR
- —
- Eligible?
- —
Short-term bridge; refi at stabilization.
Rent comps 2 comps
| Address | Beds | Baths | Sqft | Rent | $/sqft | DOM | Units | Dist |
|---|---|---|---|---|---|---|---|---|
| 1538 N Grant Ave Indianapolis, IN | 1.0 | 1.0 | 375 | $700 | $1.87 | 44d | 1 | 0.72mi |
| 2932 N Dearborn St Indianapolis, IN | 1.0 | 1.0 | 300 | $599 | $2.00 | 44d | 1 | 1.10mi |
Listing history 23 events
-
2026-06-02statusdays on market $155,000 Pending 13 DOM
-
2026-06-01days on market $155,000 Active 12 DOM
-
2026-05-31days on market $155,000 Active 11 DOM
-
2026-05-20$155,000 Active
-
2022-12-29soldstatus $125,000 Closed
-
2022-12-01status Pending
-
2022-12-01$130,000 Active
-
2020-01-25soldstatus $57,000 Sold 197-char remark
Show marketing remark (197 chars)
1-bed double available now! Home has new gutters & downspouts, updated kitchen, new furnace on 1944 side, new water heaters on both sides, new bathrooms, could make a nice rental or house hack!
-
2019-12-07status Pending 197-char remark
Show marketing remark (197 chars)
1-bed double available now! Home has new gutters & downspouts, updated kitchen, new furnace on 1944 side, new water heaters on both sides, new bathrooms, could make a nice rental or house hack!
-
2019-12-05$60,000 Active 197-char remark
Show marketing remark (197 chars)
1-bed double available now! Home has new gutters & downspouts, updated kitchen, new furnace on 1944 side, new water heaters on both sides, new bathrooms, could make a nice rental or house hack!
-
2019-10-16historical
-
2019-09-17price $47,900
-
2019-08-27price $50,000
-
2019-08-01$55,000 Active
-
2012-11-19historical
-
2012-11-16soldstatus $3,500
-
2012-07-02$10,000
-
2007-03-29soldstatus $13,900
-
2006-12-31historical
-
2006-12-29$13,900
-
2006-06-11$22,500
-
2004-08-30historical
-
2003-09-23$24,900
ⓘ Source: listings_history table (triggers on properties + properties_extension) + one-shot
backfill from property_details.listing_events for pre-trigger history.
Tax reassessment forecast IN · Partial reset (capped growth)
- Current annual tax
- $2,504 · $209/mo
- Projected year-2 tax
- $2,504 · $209/mo
- Expected delta
- $0/yr ($0/mo · 0.0%)
ⓘ Screening estimate from a state-policy table — verify with the county assessor before closing.
Climate risk First Street
- Flood 1/10 Low FEMA zone X (unshaded) · 0% chance over 30 yrs
- Wildfire 1/10 Low
- Heat 3/10 Moderate 7 d/yr ≥102°F today · 19 d/yr by 30 yrs out
- Wind 2/10 Low 0% chance of damaging wind over 30 yrs
- Air quality 4/10 Moderate 5 unhealthy d/yr today · 7 by 30 yrs out
Nearby sold comps map
Loading sold comps map…
Walkable amenities ~0.75 mi
Loading nearby amenities…
Taxation est. · year 1
- Rental income
- $29,568
- − Mortgage interest
- −$8,682
- − Property taxes
- −$2,504
- − Insurance
- −$775
- − Repairs & maintenance
- −$2,365
- − Management
- −$2,365
- − Depreciation
- −$4,509
- Taxable income
- $8,367
- Est. tax owed @ 24.0%
- −$2,008
- After-tax cash flow
- $8,318/yr
For passive investors: Depreciation is non-cash, so a rental often shows a tax loss while cash-flowing — sheltering income. Rental losses are passive: they offset passive income freely, and up to $25,000/yr can offset ordinary (W-2) income if you actively participate and your MAGI is under $100k (phasing out to $0 by $150k); unused losses carry forward. On sale, claimed depreciation is recaptured at up to 25%, and gains may owe capital-gains tax (a 1031 exchange can defer both). Figures are a year-1 estimate at your 24.0% rate — not tax advice; consult a CPA.
Schools (NCES district)
- District
- Indianapolis Public Schools
- NCES district ID
- 1804770
- Math proficiency
- 14% ▼ -7.00%
- Reading proficiency
- 20% ▼ -3.00%
- Median HH income
- $32,034
- Composite
- 13.69/100
- National rank
- #9499
- State rank
- #286 of 301 in IN
Livability — Indianapolis city (balance)
No livability data for this city. (Only ~50 U.S. cities are tracked.)
Census & demographics
- Census place
- Indianapolis city (balance), IN
- County
- Marion County · 998,460 people
- City population
- 881,119
- Metro
- Indianapolis-Carmel-Anderson, IN
- Population (ZIP)
- 29,360
- Household income
- $38,063
- Rent vs Own
- Severe rent burden
- 2340.0
Population outlook (Marion County) Hauer SSP2
- Today (2025)
- 1,025,572 people
- By 2030
- 1,065,727 · +3.9%
- By 2040
- 1,141,577 · +11.3%
- By 2050
- 1,208,920 · +17.9%
- By 2075
- 1,367,288 · +33.3%
- By 2100
- 1,438,201 · +40.2%
Race, ethnicity, and origin ACS 2023
- Neighborhood character
- Predominantly Black (68%)
- Race & ethnicity
- Black 68% White 18% Hispanic / Latino 9% Two or more races 6%
- Hispanic origin (detail)
- Mexican 6%
- Common ancestry
- Romanian 1%
- Foreign-born
- 5% · Canada, Philippines
- Languages at home
- 92% English-only · Spanish 7%
Political lean MEDSL · Marion
- 2024 margin
- Strong D (+27.7) · D 63.0% · R 35.3% · Other 1.7%
- 2008→2024 swing
- -0.7pp no change · 2008: 28.4pp · 2024: 27.7pp
- All cycles
- 2024: D+27.7 2020: D+29.1 2016: D+22.8 2012: D+22.2 2008: D+28.4
Not yet ingested
- Civics
- —
Market trends
- HPI YoY
- ▼ -81.57%
- Current HPI
- 395.7071
- Rent YoY
- ▲ 0.81%
- Metro
- Indianapolis-Carmel-Anderson, IN
- State GDP YoY
- ▲ 2.90%
- F500 in state
- 18
Industry mix (Fortune 500 HQ in IN)
| Industry | F500 HQs | Revenue |
|---|---|---|
| Industrial Machinery | 2 | $37B |
|
||
| Healthcare | 1 | $177B |
|
||
| Pharmaceuticals | 1 | $45B |
|
||
| Metals / Steel | 1 | $18B |
|
||
| Agriculture | 1 | $17B |
|
||
| Packaging | 1 | $12B |
|
||
Price history
+522.5% since first listed20 events — show timeline
- 2026-05-20 Listed $155,000 MIBOR as Distributed by MLS Grid
- 2022-12-29 Sold (MLS) $125,000 MIBOR as Distributed by MLS Grid
- 2022-12-01 Pending — MIBOR as Distributed by MLS Grid
- 2022-12-01 Listed $130,000 MIBOR as Distributed by MLS Grid
- 2020-01-25 Sold (MLS) $57,000 MIBOR as Distributed by MLS Grid
- 2019-12-07 Pending — MIBOR as Distributed by MLS Grid
- 2019-12-05 Listed $60,000 MIBOR as Distributed by MLS Grid
- 2019-10-16 Listing Removed — MIBOR as Distributed by MLS Grid
- 2019-09-17 Price Changed $47,900 MIBOR as Distributed by MLS Grid
- 2019-08-27 Price Changed $50,000 MIBOR as Distributed by MLS Grid
- 2019-08-01 Listed $55,000 MIBOR as Distributed by MLS Grid
- 2012-11-19 Listing Removed — MIBOR as Distributed by MLS Grid
- 2012-11-16 Sold (MLS) $3,500 MIBOR as Distributed by MLS Grid
- 2012-07-02 Listed $10,000 MIBOR as Distributed by MLS Grid
- 2007-03-29 Sold (MLS) $13,900 MIBOR as Distributed by MLS Grid
- 2006-12-31 Listing Removed — MIBOR as Distributed by MLS Grid
- 2006-12-29 Listed $13,900 MIBOR as Distributed by MLS Grid
- 2006-06-11 Listed $22,500 MIBOR as Distributed by MLS Grid
- 2004-08-30 Listing Removed — MIBOR as Distributed by MLS Grid
- 2003-09-23 Listed $24,900 MIBOR as Distributed by MLS Grid
Property tax history
+9.3%/yrLatest (2025): $2,504 · +10.1% YoY. Source: county tax records.
Cash-flow waterfall
monthlySold comps — $/sqft
last 12 mo · ≤1 miLoading sold comps…