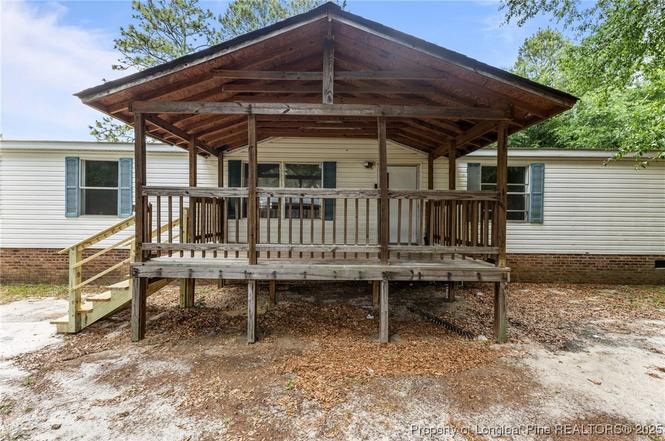
3663 Classic Rd · Fayetteville, NC
Flood risk 1/10 · Minimal
- FEMA flood zone
- X (unshaded)
- Chance of flooding over 30 yrs
- 0.0%
- Est. flood insurance / yr
- $507 – $1,088
Fire risk 6/10 · Moderate
- Est. fire insurance / yr
- $906 – $1,684
Heat risk 7/10 · Major
- Hot days now (above 106°F)
- 7 days/yr
- Hot days in 30 yrs
- 16 days/yr
Wind risk 7/10 · Major
- Chance of severe wind over 30 yrs
- 78.0%
Air-quality risk 1/10 · Minimal
- Unhealthy air days now
- 0 days/yr
- Unhealthy air days in 30 yrs
- 0 days/yr
Risk factors via First Street. Map © Google.
Why this score? — see what drove the C+ grade
The composite is a weighted blend of 9 inputs, each scored 0–100. Each bar is that input's sub-score; the figure is the points it added to the 100-point composite (weight × sub-score).
- Cash flow +25.8/30.0
- DSCR +8.6/10.0
- ARV discount +7.5/15.0
- 1% rule +6.2/10.0
- Livability +3.8/5.0
- Schools +3.1/10.0
- Rent growth +2.7/5.0
- Condition / age +2.5/5.0
- Appreciation +0.0/10.0
$174,500
🖨 Deal sheet 📄 Offer letter ✓ Due diligence
Listing remarks
Welcome to your beautifully updated 3-bedroom, 2-bathroom home, where comfort meets style! This inviting residence features fresh flooring, modern paint, and stylish fixtures throughout the bathrooms and kitchen. The spacious layout includes 2 living room spaces, a bright dining area, a functional kitchen, and a versatile flex room, perfect for a home office, playroom, or guest space. With thoughtful updates and a warm, welcoming atmosphere, this home is ready for you to move in and make it your own. Don’t miss the chance to enjoy both charm and convenience in one perfect package!
Key facts
- Built 2001
- Listed 221 days
Neighborhood map
What this means for you Summary
Snapshot
- This is a 3-bed/2.0-bath manufactured listed at $174k.
Deal economics
- At list price, monthly cash flow is $425 ($5k/yr) — positive.
- The deal already cash-flows at list — no discount required.
- Meets the 1% rule at list price ($2k rent vs $174k).
- Recommended offer: $154k (12.0% below list) — sets the bar for market timing.
- Cap rate 9.2% vs local median 4.9% in Fayetteville — top-decile yield for the area; either an underpriced asset or a hidden risk that comps aren't pricing in. Stress-test before assuming the spread holds.
Location & tenants
- Location reads 75/100 on livability (#45 in NC, #4,031 nationally) — a middle-class / working-renter tenant base. Strengths: commute A+, cost of living A+, housing A+; Watch: crime F, employment D-.
- Cumberland County Schools (urban): math 32% / reading 41% proficiency, ranked #126 of 178 in NC (top 71%) — families likely to look elsewhere, expect single-tenant / working-renter base with shorter leases.
- Zoned schools: South View Middle (math 20% / reading 34%, grade F, #374 of 475 statewide, top 80%, 661 students, 99% FRL); South View High (math 60% / reading 43%, grade D+, #299 of 535 statewide, top 56%, 1,502 students, 66% FRL) — zoned schools average 82% FRL vs 55% district-wide (28 pts higher); higher-poverty schools than district average — tighter screening recommended.
- Market conditions: Rents flat; 401 active listings in the ZIP; 6 comparable units currently listed for rent nearby; rentals leasing fast (median 14d on market — plan ~1-2 weeks tenant-placement turnaround); 1,125 units permitted in Cumberland County in 2024 (104 in 5+ unit buildings).
- This rent runs 35% of the median local income ($68k/yr) — at the standard rent-burdened threshold; future hikes will face affordability resistance.
Forward outlook
- Local home prices are declining (-3.0%/yr); year-one equity from $1k of loan paydown is wiped out by about $5k of value loss. Plan a longer hold.
Negotiation context
- It's been on market 221 days — a 12% lower offer ($154k) is reasonable based on typical stale-listing flexibility.
- 4 sale attempts since 9y ago with the ask held roughly flat each time — persistent listings suggest the price (not the market) is what's stuck; bring a comps-based counter.
- Current owner paid $56k; list at $174k implies a 212% gain — meaningful room to come down on a strong offer.
Risks & watch-outs
- Climate carrying-cost: major wind risk, 78% chance of damaging wind over 30y; major wildfire risk; extreme-heat days projected 7→16/yr by 2055 (HVAC capex compounding) — expect insurance premiums to compound above CPI over the hold.
Questions for the listing agent
- It's been on market 221 days. Have you received any prior offers? Is the seller open to a 12% concession, seller financing, or rate buy-down credit?
- Why hasn't it sold? Are there any deal-killer items the seller is aware of (foundation, flood, title, zoning, code violations)?
- Is there a deadline driving the sale (1031 exchange, divorce, estate, relocation)? That informs how much negotiation room exists.
- Crime grade is F in this area — have there been break-ins, vandalism, or insurance claims at this property in the last 3 years? What carrier currently insures it and at what premium?
- What's the average days-on-market for RENTAL listings here right now (not sales)? A rising rental-DOM trend means longer vacancies and softer asking-rent achievability than the comps imply.
- What's the recent tenant-quality profile in this submarket — average credit score on applications, eviction rate, late-payment / NSF rate, and stable-employment percentage? A property-management company in the area should have these aggregated.
- How much new for-sale + rental construction is in the pipeline within 1–3 miles? Heavy new supply typically softens prices + rents 12–24 months out; constrained supply supports both.
Investment metrics
- 1% rule
- 1.12% ✓
- Cap rate
- 9.22%
- Cash-on-cash
- 10.44%
- DSCR
- 1.46
- GRM
- 7.4
CMA / ARV
- ARV (on-the-fly)
- $174,420
- Comps found
- 1
Show comp detail 1 sale within ~0.75 mi
| Address | Dist | Beds/Ba | Sqft | Sold | Price | $/sf | Match |
|---|---|---|---|---|---|---|---|
| 3663 Classic Rd | 0.00mi | 3/2.0 | 2,010 (-2%) | 0mo | $171,000 | $85 | 96 |
Match score weights: distance 35% · size 25% · config 20% · recency 20%. Top-matched comps best support the ARV.
Projected returns pro-forma
-3.0% appreciation · 0.9% rent growth · sell at horizon
- IRR
- -2.9%
- Equity multiple
- 0.89×
- Total profit
- $-5,287
- Equity at exit
- $26,019
- IRR
- 4.4%
- Equity multiple
- 1.29×
- Total profit
- $14,214
- Equity at exit
- $15,088
Cash invested: $48,860 (down + closing). Projections, not guarantees.
Landlord ↔ Tenant lean methodology
- Overall (STATE)
- 85 Strongly Landlord-Friendly
- State North Carolina
- 85 Strongly Landlord-Friendly · R+3
- County
- — inherits STATE
- City
- — inherits STATE
ZIP-level market 28306
- Home prices YoY
- -17.7%
- Rents YoY
- 0.9%
- Active inventory
- 401
- Price-to-rent
- 7.4×
Monthly cashflow live
- Estimated rent
- $1,958 high interval (Pro) →
- Mortgage (P&I)
- −$915
- Tax from tax record
- −$134 /mo · $1,607/yr
- Insurance
- −$73
- HOA
- −$0
- Vacancy / Maint / Mgmt
- −$411
- Net cashflow
- $425
Break-even live
UW: 25.0% down · 7.5% · 30yr · 1.5% tax · 5.0% vac · 8.0% maint · 8.0% mgmt
Financing live
Cash to close
- Down payment
- $43,625
- Closing costs
- $5,235
- Reserves months
- —
- Total cash needed
- —
Loan-product check · same deal, 3 products live
Conventional
25% down · 7.5% · 30yr
- Down + closing
- —
- Monthly P&I
- —
- Monthly cashflow
- —
- DSCR
- —
- Eligible?
- —
Personal DTI + credit; lowest rate.
DSCR
20% down · 8.5% · 30yr
- Down + closing
- —
- Monthly P&I
- —
- Monthly cashflow
- —
- DSCR
- —
- Eligible?
- —
No personal income docs; deal must DSCR.
Hard money
10% down · 12.0% · 12mo
- Down + closing
- —
- Monthly P&I
- —
- Monthly cashflow
- —
- DSCR
- —
- Eligible?
- —
Short-term bridge; refi at stabilization.
Rent comps 6 comps
| Address | Beds | Baths | Sqft | Rent | $/sqft | DOM | Units | Dist |
|---|---|---|---|---|---|---|---|---|
| 3640 Ambition Rd Fayetteville, NC | 4.0 | 2.5 | 1990 | $1,995 | $1.00 | 13d | 1 | 0.49mi |
| 2935 High Plains Dr Hope Mills, NC | 4.0 | 2.5 | 1937 | $1,900 | $0.98 | 13d | 1 | 0.74mi |
| 5340 Miranda Dr Hope Mills, NC | 4.0 | 2.5 | 1954 | $1,900 | $0.97 | 23d | 1 | 0.96mi |
| 3718 Pioneer Dr Hope Mills, NC | 3.0 | 2.0 | 1511 | $1,290 | $0.85 | 23d | 1 | 1.24mi |
| 2616 Indian Wells Ct Hope Mills, NC | 4.0 | 2.5 | 2181 | $2,150 | $0.99 | 13d | 1 | 1.46mi |
| 2634 Indian Wells Ct Hope Mills, NC | 4.0 | 2.5 | 1932 | $2,100 | $1.09 | 13d | 1 | 1.48mi |
Listing history 19 events
-
2026-04-19status Pending
-
2026-03-23price $174,500
-
2026-02-16price $174,600
-
2026-01-26price $174,700
-
2026-01-17price $174,800
-
2025-12-12price $174,900
-
2025-11-23price $178,400
-
2025-09-10$179,400 Active
-
2025-08-26price $179,400
-
2025-08-08price $179,900
-
2025-07-07price $189,900
-
2025-06-14price $193,900
-
2025-05-17$195,000 Active
-
2025-02-14price $115,000
-
2025-01-17$120,000 Active
-
2018-05-25soldstatus $56,000
-
2018-05-22soldstatus $56,000
-
2017-06-05$56,000
-
2001-11-05soldstatus $86,000
ⓘ Source: listings_history table (triggers on properties + properties_extension) + one-shot
backfill from property_details.listing_events for pre-trigger history.
Tax reassessment forecast NC · Resets to sale price
- Current annual tax
- $1,607 · $134/mo
- Projected year-2 tax
- $1,607 · $134/mo
- Expected delta
- $0/yr ($0/mo · 0.0%)
ⓘ Screening estimate from a state-policy table — verify with the county assessor before closing.
Climate risk First Street
- Flood 1/10 Low FEMA zone X (unshaded) · 0% chance over 30 yrs
- Wildfire 6/10 Major
- Heat 7/10 Severe 7 d/yr ≥106°F today · 16 d/yr by 30 yrs out
- Wind 7/10 Severe 78% chance of damaging wind over 30 yrs
- Air quality 1/10 Low 0 unhealthy d/yr today · 0 by 30 yrs out
Nearby sold comps map
Loading sold comps map…
Walkable amenities ~0.75 mi
Loading nearby amenities…
Taxation est. · year 1
- Rental income
- $23,493
- − Mortgage interest
- −$9,775
- − Property taxes
- −$1,607
- − Insurance
- −$872
- − Repairs & maintenance
- −$1,879
- − Management
- −$1,879
- − Depreciation
- −$5,076
- Taxable income
- $2,404
- Est. tax owed @ 24.0%
- −$577
- After-tax cash flow
- $4,522/yr
For passive investors: Depreciation is non-cash, so a rental often shows a tax loss while cash-flowing — sheltering income. Rental losses are passive: they offset passive income freely, and up to $25,000/yr can offset ordinary (W-2) income if you actively participate and your MAGI is under $100k (phasing out to $0 by $150k); unused losses carry forward. On sale, claimed depreciation is recaptured at up to 25%, and gains may owe capital-gains tax (a 1031 exchange can defer both). Figures are a year-1 estimate at your 24.0% rate — not tax advice; consult a CPA.
Schools (NCES district)
- District
- Cumberland County Schools
- NCES district ID
- 3700011
- Math proficiency
- 32% ▼ -2.00%
- Reading proficiency
- 41% ▼ -1.00%
- Median HH income
- $44,168
- Composite
- 31.0/100
- National rank
- #6096
- State rank
- #126 of 178 in NC
Livability — Fayetteville
- Score
- 75/100
- State rank
- #45
- US rank
- #4031
Category grades
Schools grade is shown separately in the Schools card above.
Census & demographics
- County
- Cumberland County · 265,314 people
- City population
- 226,118
- Metro
- Fayetteville, NC
- Population (ZIP)
- 43,042
- Household income
- $67,544
- Rent vs Own
- Severe rent burden
- 1386.0
Population outlook (Cumberland County) Hauer SSP2
- Today (2025)
- 330,855 people
- By 2030
- 333,523 · +0.8%
- By 2040
- 335,583 · +1.4%
- By 2050
- 335,325 · +1.4%
- By 2075
- 342,853 · +3.6%
- By 2100
- 340,698 · +3.0%
Race, ethnicity, and origin ACS 2023
- Neighborhood character
- Diverse neighborhood (Simpson 0.68)
- Race & ethnicity
- White 44% Black 33% Hispanic / Latino 13% Two or more races 8% Asian 4% Native American 2%
- Hispanic origin (detail)
- Mexican 5% Puerto Rican 5%
- Common ancestry
- Italian 2% Slovak 1% Serbian 1%
- Foreign-born
- 8% · Canada, South Korea, Jamaica
- Languages at home
- 87% English-only · Spanish 9% Other Indo-European 1% French/Haitian/Cajun 1%
Political lean MEDSL · Cumberland
- 2024 margin
- D (+13.4) · D 56.1% · R 42.7% · Other 1.2%
- 2008→2024 swing
- -4.3pp toward R · 2008: 17.7pp · 2024: 13.4pp
- All cycles
- 2024: D+13.4 2020: D+16.6 2016: D+16.0 2012: D+19.7 2008: D+17.7
Not yet ingested
- Civics
- —
Market trends
- HPI YoY
- ▼ -51.69%
- Current HPI
- 239.7281
- Rent YoY
- ▲ 0.90%
- Metro
- Fayetteville, NC
- State GDP YoY
- ▲ 3.28%
- F500 in state
- 26
Industry mix (Fortune 500 HQ in NC)
| Industry | F500 HQs | Revenue |
|---|---|---|
| Financial Services | 2 | $213B |
|
||
| Retail | 2 | $95B |
|
||
| Industrial Conglomerate | 1 | $38B |
|
||
| Metals / Steel | 1 | $35B |
|
||
| Utilities | 1 | $30B |
|
||
| Industrial Machinery | 1 | $19B |
|
||
Price history
+102.9% since first listed19 events — show timeline
- 2026-04-19 Pending — LPRMLS
- 2026-03-23 Price Changed $174,500 LPRMLS
- 2026-02-16 Price Changed $174,600 LPRMLS
- 2026-01-26 Price Changed $174,700 LPRMLS
- 2026-01-17 Price Changed $174,800 LPRMLS
- 2025-12-12 Price Changed $174,900 LPRMLS
- 2025-11-23 Price Changed $178,400 LPRMLS
- 2025-09-10 Listed $179,400 LPRMLS
- 2025-08-26 Price Changed $179,400 LPRMLS
- 2025-08-08 Price Changed $179,900 LPRMLS
- 2025-07-07 Price Changed $189,900 LPRMLS
- 2025-06-14 Price Changed $193,900 LPRMLS
- 2025-05-17 Listed $195,000 LPRMLS
- 2025-02-14 Price Changed $115,000 LPRMLS
- 2025-01-17 Listed $120,000 LPRMLS
- 2018-05-25 Sold (Public Records) $56,000 Public Records
- 2018-05-22 Sold (MLS) $56,000 LPRMLS
- 2017-06-05 Listed $56,000 LPRMLS
- 2001-11-05 Sold (Public Records) $86,000 Public Records
Property tax history
+5.7%/yrLatest (2025): $1,607 · +79.5% YoY. Source: county tax records.
Cash-flow waterfall
monthlySold comps — $/sqft
last 12 mo · ≤1 miLoading sold comps…