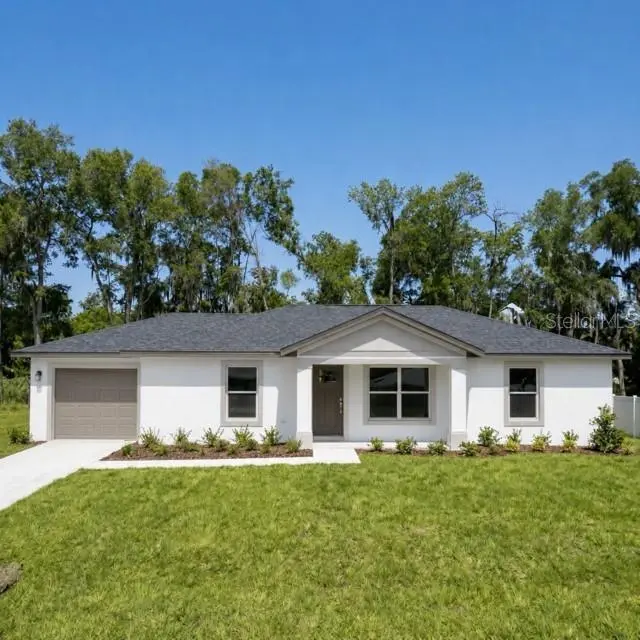
 🏗️ New Construction
914 NW 52 Ave · Ocala, FL
Flood risk 1/10 · Minimal
- FEMA flood zone
- X (unshaded)
- Chance of flooding over 30 yrs
- 0.0%
- Est. flood insurance / yr
- $507 – $1,088
Fire risk 4/10 · Minor
- Est. fire insurance / yr
- $947 – $1,759
Heat risk 8/10 · Major
- Hot days now (above 107°F)
- 7 days/yr
- Hot days in 30 yrs
- 22 days/yr
Wind risk 9/10 · Severe
- Chance of severe wind over 30 yrs
- 99.0%
Air-quality risk 3/10 · Minor
- Unhealthy air days now
- 3 days/yr
- Unhealthy air days in 30 yrs
- 3 days/yr
Risk factors via First Street. Map © Google.
Why this score? — see what drove the D grade
The composite is a weighted blend of 9 inputs, each scored 0–100. Each bar is that input's sub-score; the figure is the points it added to the 100-point composite (weight × sub-score).
- Cash flow +15.8/30.0
- ARV discount +7.5/15.0
- Rent growth +5.0/5.0
- DSCR +4.9/10.0
- 1% rule +4.3/10.0
- Schools +3.6/10.0
- Livability +3.5/5.0
- Condition / age +0.5/5.0
- Appreciation +0.0/10.0
$219,900
🖨 Deal sheet (PDF) 📄 Offer letter ✓ Due diligence
Listing remarks
Under Construction. Home is under construction. Completion date May 2026. * * PICTURES ARE OF A MODEL HOME SOME DETAILS MAY VARY * * Discover your ideal home with this charming new construction property, perfectly situated near the World Equestrian Center (WEC) in beautiful Ocala, FL. This 3-bedroom, 2-bathroom home features a 1-car garage and offers a fantastic opportunity for first-time home buyers and investors alike, with no HOA fees. Bright and airy open-concept living space, perfect for entertaining! Contemporary kitchen equipped with stainless steel appliances, granite countertops, and ample storage! Comfortable master suite featuring a private bathroom and spacious walk-in c
Key facts
- New construction
- No hoa fees
- Private bathroom
Tags
Property features AI
Finance
- Other: Property type: Residential; Property subtype: Single Family Residence; Zoning: R2; Lot size about 0.18 acres (approx. 728 m²); Living area about 1181 (public records); total building area about 1522; Unfurnished
Exterior
- Parking: Attached garage (1 car)
- Utilities: Well water; Septic tank; Cable available
- Home design: Single family residence; One story; Facing east; Under construction (projected completion June 2026)
- Construction: Brick construction; Shingle roof; Built by MOGUL CONSTRUCTION LLC (model: JENKINS); Slab foundation; New construction
- Exterior features: Asphalt road access
Interior
- Kitchen: Dishwasher; Microwave; Refrigerator
- Bedrooms: 3 bedrooms
- Bathrooms: 2 full bathrooms
- Heating & cooling: Central heating; Central air conditioning
- Interior features: Ceiling fans; Open floor plan; ENERGY STAR qualified windows
- Laundry & utility: Dedicated laundry room
Neighborhood map
What this means for you Summary
Snapshot
- This is a 3-bed/2.0-bath single-family listed at $220k. Condition is rated poor.
Deal economics
- At list price, monthly cash flow is $93 ($1k/yr) — positive.
- To cash-flow at today's rent, offer at most $220k (0.2% below list).
- To meet the 1% rule (rent ≥ 1% of price), the offer needs to be $192k (12.7% below list).
- Recommended offer: $192k (12.7% below list) — sets the bar for 1% rule.
- Cap rate 6.8% vs local median 4.1% in Ocala — top-decile yield for the area; either an underpriced asset or a hidden risk that comps aren't pricing in. Stress-test before assuming the spread holds.
Location & tenants
- Location reads 69/100 on livability (#476 in FL) — a middle-class / working-renter tenant base. Strengths: cost of living A+, housing A+, health & safety A+; Watch: crime F, amenities F, commute F.
- Marion (rural): math 42% / reading 43% proficiency, ranked #61 of 73 in FL (top 84%) — families likely to look elsewhere, expect single-tenant / working-renter base with shorter leases; 61% free/reduced lunch — lower-income household profile, screen leases tightly.
- Zoned schools: Liberty Middle School (math 40% / reading 41%, grade F, #360 of 571 statewide, top 64%, 1,365 students, 54% FRL); West Port High School (math 34% / reading 52%, grade F, #255 of 667 statewide, top 39%, 2,906 students, 52% FRL).
- Market conditions: Rents rising fast (+11.1%/yr); 670 active listings in the ZIP; 14 comparable units currently listed for rent nearby; rentals at typical pace (median 23d on market — plan ~3-4 weeks tenant-placement turnaround); 7,071 units permitted in Marion County in 2024 (534 in 5+ unit buildings).
- This rent runs 35% of the median local income ($66k/yr) — at the standard rent-burdened threshold; future hikes will face affordability resistance.
Forward outlook
- Local home prices are declining (-3.0%/yr); year-one equity from $1k of loan paydown is wiped out by about $6k of value loss. Plan a longer hold.
- Marion County population projected at +13% by 2050 — modest demand growth; plan on rents tracking national, not racing it.
Negotiation context
- It's been on market 37 days — a 3% lower offer ($213k) is reasonable based on typical stale-listing flexibility.
Risks & watch-outs
- Climate carrying-cost: severe wind risk, 99% chance of damaging wind over 30y; extreme-heat days projected 7→22/yr by 2055 (HVAC capex compounding) — expect insurance premiums to compound above CPI over the hold.
Questions for the listing agent
- It's been on market 37 days. Have you received any prior offers? Is the seller open to a 13% concession, seller financing, or rate buy-down credit?
- Have any recent inspections been done? Can we get a copy of the seller's disclosures and any deferred-maintenance estimates?
- Is there a deadline driving the sale (1031 exchange, divorce, estate, relocation)? That informs how much negotiation room exists.
- Crime grade is F in this area — have there been break-ins, vandalism, or insurance claims at this property in the last 3 years? What carrier currently insures it and at what premium?
- The area grade is low — what's the realistic commute time and amenity access for the typical tenant pool here? Any planned neighborhood developments (good or bad) we should know about?
- What's the average days-on-market for RENTAL listings here right now (not sales)? A rising rental-DOM trend means longer vacancies and softer asking-rent achievability than the comps imply.
- What's the recent tenant-quality profile in this submarket — average credit score on applications, eviction rate, late-payment / NSF rate, and stable-employment percentage? A property-management company in the area should have these aggregated.
- How much new for-sale + rental construction is in the pipeline within 1–3 miles? Heavy new supply typically softens prices + rents 12–24 months out; constrained supply supports both.
Investment metrics
- 1% rule
- 0.93% ✗
- Cap rate
- 6.83%
- Cash-on-cash
- 1.93%
- DSCR
- 1.09
- GRM
- 8.9
CMA / ARV
- ARV (median comp)
- $206,090
- List price
- $219,900
- Delta
- 6.70%
- Verdict
- FAIR
- Comps
- 20 within 1.0 mi
Show comp detail 9 sales within ~0.75 mi
| Address | Dist | Beds/Ba | Sqft | Sold | Price | $/sf | Match |
|---|---|---|---|---|---|---|---|
| 5785 NW 14th St | 0.35mi | 3/2.0 | 1,232 (+4%) | 6mo | $215,000 | $175 | 72 |
| 1035 NW 52nd Ct | 0.35mi | 3/2.0 | 1,181 (0%) | 17mo | $215,000 | $182 | 70 |
| 1089 NW 52nd Ct | 0.35mi | 3/2.0 | 1,181 (0%) | 17mo | $220,000 | $186 | 70 |
| 5935 NW 14th St | 0.43mi | 3/2.0 | 1,173 (-1%) | 15mo | $225,000 | $192 | 66 |
| 5339 NW 6th Pl | 0.31mi | 3/2.0 | 1,173 (-1%) | 24mo | $230,000 | $196 | 64 |
| 5711 NW 4th St | 0.36mi | 3/2.0 | 1,028 (-13%) | 3mo | $190,000 | $185 | 59 |
| 1384 NW 48th Ter | 0.72mi | 3/2.0 | 1,263 (+7%) | 2mo | $262,790 | $208 | 53 |
| 5532 NW 1st St | 0.61mi | 3/2.0 | 1,248 (+6%) | 19mo | $195,000 | $156 | 46 |
| 5747 NW 4th St | 0.37mi | 3/2.0 | 1,028 (-13%) | 24mo | $225,000 | $219 | 41 |
Match score weights: distance 35% · size 25% · config 20% · recency 20%. Top-matched comps best support the ARV.
Projected returns pro-forma
-3.0% appreciation · 8.0% rent growth · sell at horizon
- IRR
- -7.8%
- Equity multiple
- 0.70×
- Total profit
- $-17,316
- Equity at exit
- $30,729
- IRR
- 7.3%
- Equity multiple
- 1.67×
- Total profit
- $38,826
- Equity at exit
- $17,819
Cash invested: $57,705 (down + closing). Projections, not guarantees.
Landlord ↔ Tenant lean methodology
- Overall (STATE)
- 87 Strongly Landlord-Friendly
- State Florida
- 87 Strongly Landlord-Friendly · R+3
- County
- — inherits STATE
- City
- — inherits STATE
ZIP-level market 34482
- Rents YoY
- 11.1%
- Active inventory
- 670
- Price-to-rent
- 9.5×
Monthly cashflow live
- Estimated rent
- $1,920 high interval (Pro) →
- Mortgage (P&I)
- −$1,081
- Tax est. 1.5%
- −$258 /mo · $3,091/yr
- Insurance
- −$86
- HOA
- −$0
- Vacancy / Maint / Mgmt
- −$403
- Net cashflow
- $93
Break-even live
Sensitivity live
| Price | -10% $235 | -5% $164 | +0% $93 | +5% $21 | +10% $-50 |
|---|---|---|---|---|---|
| Rent | -10% $-59 | -5% $17 | +0% $93 | +5% $169 | +10% $244 |
| Rate | -1.0pp $196 | -0.5pp $145 | base $93 | +0.5pp $39 | +1.0pp $-15 |
UW: 25.0% down · 7.5% · 30yr · 1.5% tax · 5.0% vac · 8.0% maint · 8.0% mgmt
Financing live
Cash to close
- Down payment
- $51,523
- Closing costs
- $6,183
- Reserves months
- —
- Total cash needed
- —
Loan-product check · same deal, 3 products live
Conventional
25% down · 7.5% · 30yr
- Down + closing
- —
- Monthly P&I
- —
- Monthly cashflow
- —
- DSCR
- —
- Eligible?
- —
Personal DTI + credit; lowest rate.
DSCR
20% down · 8.5% · 30yr
- Down + closing
- —
- Monthly P&I
- —
- Monthly cashflow
- —
- DSCR
- —
- Eligible?
- —
No personal income docs; deal must DSCR.
Hard money
10% down · 12.0% · 12mo
- Down + closing
- —
- Monthly P&I
- —
- Monthly cashflow
- —
- DSCR
- —
- Eligible?
- —
Short-term bridge; refi at stabilization.
Rent comps 14 comps
| Address | Beds | Baths | Sqft | Rent | $/sqft | DOM | Units | Dist |
|---|---|---|---|---|---|---|---|---|
| 933 NW 57th Ct Unit 935 Ocala, FL | 3.0 | 2.0 | 1162 | $1,649 | $1.42 | 23d | 1 | 0.15mi |
| 985 NW 57th Ct Unit 987 Ocala, FL | 3.0 | 2.0 | 1162 | $1,697 | $1.46 | 23d | 1 | 0.16mi |
| 985 NW 57th Ct Unit 985 Ocala, FL | 3.0 | 2.0 | 1162 | $1,649 | $1.42 | 23d | 1 | 0.16mi |
| 1017 NW 57th Ct Unit 1019 Ocala, FL | 3.0 | 2.0 | 1162 | $1,649 | $1.42 | 23d | 1 | 0.16mi |
| 5811 NW 10th St Unit 5811 Ocala, FL | 3.0 | 2.0 | 1162 | $1,649 | $1.42 | 23d | 1 | 0.23mi |
| 1527 NW 57th Ct Unit 1 Ocala, FL | 3.0 | 2.0 | 1460 | $1,550 | $1.06 | 23d | 1 | 0.41mi |
| 311 NW 60th Ave Ocala, FL | 3.0 | 2.0 | 1462 | $1,900 | $1.30 | 23d | 1 | 0.58mi |
| 5399 NW 18th St Ocala, FL | 2.0 | 2.0 | 1085 | $2,100 | $1.94 | 15d | 1 | 0.65mi |
| 5399 NW 18th St Ocala, FL | 2.0 | 2.0 | 1085 | $2,100 | $1.94 | 23d | 1 | 0.65mi |
| 1918 NW 50th Cir Ocala, FL | 2.0 | 2.0 | 1061 | $2,200 | $2.07 | 23d | 1 | 0.89mi |
| 2028 NW 50th Ave Ocala, FL | 2.0 | 2.0 | 1066 | $1,595 | $1.50 | 23d | 1 | 0.94mi |
| 2038 NW 50th Ave Ocala, FL | 2.0 | 2.0 | 1062 | $2,250 | $2.12 | 23d | 1 | 0.95mi |
| 2048 NW 50th Ave Ocala, FL | 2.0 | 2.0 | 1062 | $2,250 | $2.12 | 23d | 1 | 0.95mi |
| NW 40th Avenue Rd Ocala, FL | 2.0 | 1.0 | 1050 | $1,050 | $1.00 | 15d | 1 | 1.48mi |
Listing history 17 events
-
2026-06-21days on market $219,900 Active 37 DOM
-
2026-06-18days on market $219,900 Active 34 DOM
-
2026-06-17days on market $219,900 Active 33 DOM
-
2026-06-16days on market $219,900 Active 32 DOM
-
2026-06-15days on market $219,900 Active 31 DOM
-
2026-06-14days on market $219,900 Active 29 DOM
-
2026-06-13days on market $219,900 Active 28 DOM
-
2026-06-10days on market $219,900 Active 26 DOM
-
2026-06-09days on market $219,900 Active 25 DOM
-
2026-06-08days on market $219,900 Active 24 DOM
-
2026-06-07pricedays on market $219,900 Active 23 DOM
-
2026-06-03days on market $225,000 Active 19 DOM
-
2026-06-02days on market $225,000 Active 18 DOM
-
2026-06-01days on market $225,000 Active 17 DOM
-
2026-05-31days on market $225,000 Active 16 DOM
-
2026-05-30days on market $225,000 Active 15 DOM
-
2026-05-15$225,000 Active 1403-char remark
ⓘ Source: listings_history table (triggers on properties + properties_extension) + one-shot
backfill from property_details.listing_events for pre-trigger history.
Climate risk First Street
- Flood 1/10 Low FEMA zone X (unshaded) · 0% chance over 30 yrs
- Wildfire 4/10 Moderate
- Heat 8/10 Severe 7 d/yr ≥107°F today · 22 d/yr by 30 yrs out
- Wind 9/10 Extreme 99% chance of damaging wind over 30 yrs
- Air quality 3/10 Moderate 3 unhealthy d/yr today · 3 by 30 yrs out
Nearby sold comps map
Loading sold comps map…
Walkable amenities ~0.75 mi
Loading nearby amenities…
Taxation est. · year 1
- Rental income
- $23,042
- − Mortgage interest
- −$11,544
- − Property taxes
- −$3,091
- − Insurance
- −$1,030
- − Repairs & maintenance
- −$1,843
- − Management
- −$1,843
- − Depreciation
- −$5,995
- Taxable loss
- −$2,306
- Est. tax savings @ 24.0%
- +$553
- After-tax cash flow
- $1,666/yr
For passive investors: Depreciation is non-cash, so a rental often shows a tax loss while cash-flowing — sheltering income. Rental losses are passive: they offset passive income freely, and up to $25,000/yr can offset ordinary (W-2) income if you actively participate and your MAGI is under $100k (phasing out to $0 by $150k); unused losses carry forward. On sale, claimed depreciation is recaptured at up to 25%, and gains may owe capital-gains tax (a 1031 exchange can defer both). Figures are a year-1 estimate at your 24.0% rate — not tax advice; consult a CPA.
Condition & rehab AI · 2 photos
This property is under construction and will not be move-in ready until May 2026. No repairs or maintenance are needed as it is in the construction phase.
Schools (NCES district)
- District
- Marion
- NCES district ID
- 1201260
- Math proficiency
- 42% ▼ -7.00%
- Reading proficiency
- 43% ▼ -4.00%
- Median HH income
- $40,015
- Composite
- 35.61/100
- National rank
- #4890
- State rank
- #61 of 73 in FL
Livability — Ocala
- Score
- 69/100
- State rank
- #476
- US rank
- #8461
Category grades
Schools grade is shown separately in the Schools card above.
Census & demographics
- County
- Marion County · 315,796 people
- City population
- 263,375
- Metro
- Ocala, FL
- Population (ZIP)
- 22,807
- Household income
- $65,901
- Rent vs Own
- Severe rent burden
- 282.0
Population outlook (Marion County) Hauer SSP2
- Today (2025)
- 365,905 people
- By 2030
- 376,768 · +3.0%
- By 2040
- 396,555 · +8.4%
- By 2050
- 412,723 · +12.8%
- By 2075
- 446,090 · +21.9%
- By 2100
- 436,193 · +19.2%
Race, ethnicity, and origin ACS 2023
- Neighborhood character
- Majority White (63%)
- Race & ethnicity
- White 63% Hispanic / Latino 19% Black 14% Two or more races 12%
- Hispanic origin (detail)
- Mexican 6% Puerto Rican 9% Cuban 2%
- Common ancestry
- Lithuanian 2% Romanian 2% Slovak 2%
- Foreign-born
- 10% · Canada
- Languages at home
- 81% English-only · Spanish 16% Other Indo-European 1%
Political lean MEDSL · Marion
- 2024 margin
- Solid R (+31.6) · D 33.8% · R 65.5%
- 2008→2024 swing
- -20.0pp toward R · 2008: -11.6pp · 2024: -31.6pp
- All cycles
- 2024: R+31.6 2020: R+25.9 2016: R+26.2 2012: R+16.2 2008: R+11.6
Not yet ingested
- Civics
- —
Market trends
- HPI YoY
- ▼ -133.62%
- Current HPI
- 194.3857
- Rent YoY
- ▲ 11.12%
- Metro
- Ocala, FL
- State GDP YoY
- ▲ 3.28%
- F500 in state
- 36
Industry mix (Fortune 500 HQ in FL)
| Industry | F500 HQs | Revenue |
|---|---|---|
| Industrial Technology | 2 | $29B |
|
||
| Insurance | 2 | $17B |
|
||
| Retail | 1 | $60B |
|
||
| Technology Distribution | 1 | $58B |
|
||
| Homebuilding | 1 | $35B |
|
||
| Technology Manufacturing | 1 | $35B |
|
||
Price history
-2.3% since first listed2 events — show timeline
- 2026-06-04 Price Changed $219,900 Stellar MLS as Distributed by MLS Grid
- 2026-05-15 Listed $225,000 Stellar MLS as Distributed by MLS Grid
Cash-flow waterfall
monthlySold comps — $/sqft
last 12 mo · ≤1 miLoading sold comps…