 Duplex
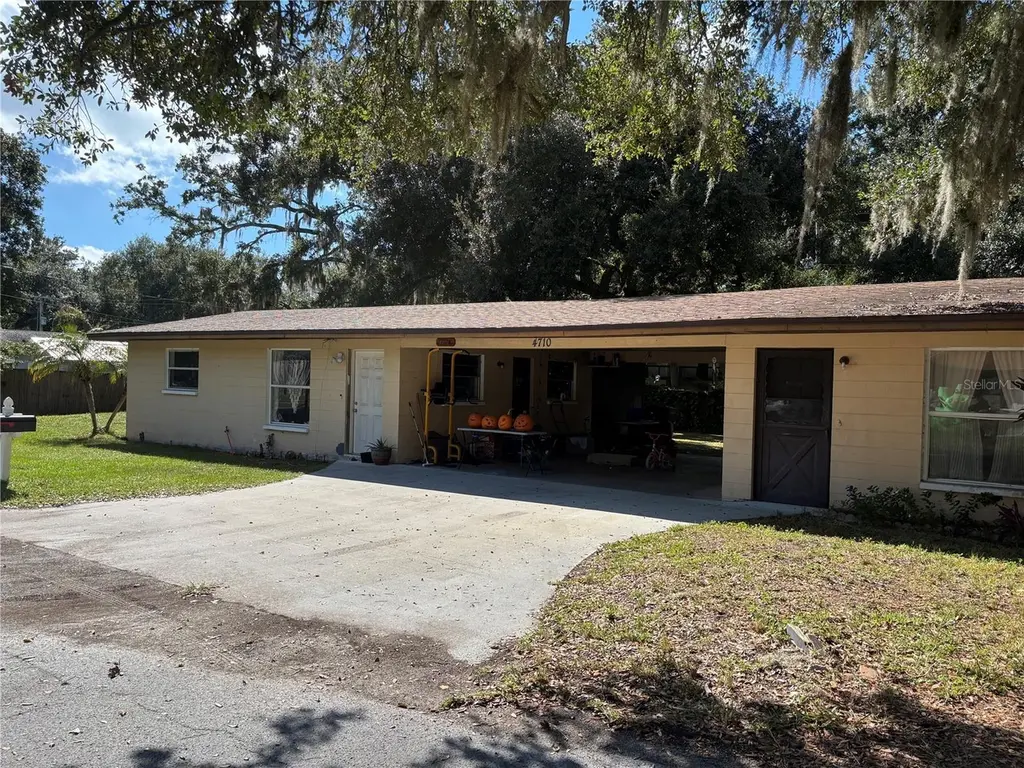
4710 Fernery Ln · Lakeland, FL
Flood risk 1/10 · Minimal
- FEMA flood zone
- X (unshaded)
- Chance of flooding over 30 yrs
- 0.0%
- Est. flood insurance / yr
- $507 – $1,088
Fire risk 3/10 · Minor
- Est. fire insurance / yr
- $947 – $1,759
Heat risk 8/10 · Major
- Hot days now (above 108°F)
- 7 days/yr
- Hot days in 30 yrs
- 21 days/yr
Wind risk 9/10 · Severe
- Chance of severe wind over 30 yrs
- 99.0%
Air-quality risk 2/10 · Minimal
- Unhealthy air days now
- 1 days/yr
- Unhealthy air days in 30 yrs
- 1 days/yr
Risk factors via First Street. Map © Google.
Why this score? — see what drove the D grade
The composite is a weighted blend of 9 inputs, each scored 0–100. Each bar is that input's sub-score; the figure is the points it added to the 100-point composite (weight × sub-score).
- Cash flow +14.2/30.0
- ARV discount +7.5/15.0
- DSCR +4.3/10.0
- Livability +3.9/5.0
- 1% rule +3.6/10.0
- Schools +3.5/10.0
- Rent growth +2.7/5.0
- Condition / age +2.5/5.0
- Appreciation +0.0/10.0
$350,000
🖨 Deal sheet (PDF) 📄 Offer letter ✓ Due diligence
Multi-family units
County records classify this as Multi-Family (2-4 Unit). Listing-text estimate: 2 units. confirmed
Listing remarks
Completely renovated duplex and quiet neighborhood. Each unit encompasses three bedrooms, one bath with one currently rented at $1500 a month. This makes an excellent investment property, or you could possibly live in one unit and rent out the other period
Key facts
- Renovated duplex
- Investment property
- One bath
Tags
Property features AI
Finance
- Financial info: Property used as residential income with 2 units; Annual net income reported: $36,000; Unit 1 pro forma rent: $1,500; Unit 2 pro forma rent: $1,650
- HOA & community: No association
Exterior
- Parking: Carport with 2 spaces
- Utilities: Public water; Septic tank sewer; Cable available
- Home design: Residential income property (duplex); Single building; Zoned C-3; Lot acreage about 1/4 to less than 1/2 acre; Facing direction not specified
- Construction: Stucco exterior; Shingle roof; Slab foundation; Built year not specified
- Exterior features: Paved road access; Lot dimensions approximately 150 x 85
Interior
- Kitchen: Each unit includes a kitchen
- Bedrooms: Six total bedrooms (property configured as two 3-bedroom units)
- Bathrooms: Two bathrooms (one in each unit)
- Heating & cooling: Central heating; Central air conditioning
- Interior features: Kitchen/family room combo
- Laundry & utility: Inside laundry
Neighborhood map
What this means for you Summary
Snapshot
- This is a 2 × 3-bed/1.0-bath units multifamily listed at $350k.
Deal economics
- At list price, monthly cash flow is $58 ($693/yr) — positive. Per door: $29/mo.
- The deal already cash-flows at list — no discount required.
- To meet the 1% rule (rent ≥ 1% of price), the offer needs to be $302k (13.8% below list).
- Recommended offer: $302k (13.8% below list) — sets the bar for 1% rule.
Location & tenants
- Location reads 77/100 on livability (#206 in FL, #3,179 nationally) — a middle-class / working-renter tenant base. Strengths: cost of living A+, housing A+, health & safety A+; Watch: employment D+, amenities F, commute F.
- Polk (suburban): math 39% / reading 43% proficiency, ranked #62 of 73 in FL (top 85%) — families likely to look elsewhere, expect single-tenant / working-renter base with shorter leases.
- Zoned schools: North Lakeland Elementary School of Choice (math 36% / reading 34%, grade F, #1,697 of 2,144 statewide, top 80%, 644 students, 61% FRL); Lake Gibson Middle School (math 40% / reading 39%, grade F, #373 of 571 statewide, top 66%, 1,218 students, 56% FRL); Lake Gibson Senior High School (math 16% / reading 38%, grade F, #478 of 667 statewide, top 73%, 2,080 students, 49% FRL) — zoned schools at 55% FRL track the district average.
- Market conditions: Rents flat; 263 active listings in the ZIP; 15 comparable units currently listed for rent nearby; rentals at typical pace (median 16d on market — plan ~3-4 weeks tenant-placement turnaround); 10,384 units permitted in Polk County in 2024 (1,716 in 5+ unit buildings).
- At $3,018/mo this rent would consume 52% of the median local household income ($70k/yr) (locally 924% of renters already pay >50% of income on rent) — very limited rent-growth headroom before tenants either downsize or default.
Forward outlook
- Local home prices are declining (-3.0%/yr); year-one equity from $2k of loan paydown is wiped out by about $10k of value loss. Plan a longer hold.
- Polk County population projected at +33% by 2050 — long-run rental-demand tailwind backs the buy-and-hold thesis.
Negotiation context
- It's been on market 68 days — a 6% lower offer ($329k) is reasonable based on typical stale-listing flexibility.
- 2 sale attempts with the ask held roughly flat each time — persistent listings suggest the price (not the market) is what's stuck; bring a comps-based counter.
- Current owner paid $256k; 36% above their basis — modest negotiation headroom, anchor on the comps not their cost.
Risks & watch-outs
- Climate carrying-cost: severe wind risk, 99% chance of damaging wind over 30y; extreme-heat days projected 7→21/yr by 2055 (HVAC capex compounding) — expect insurance premiums to compound above CPI over the hold.
Questions for the listing agent
- It's been on market 68 days. Have you received any prior offers? Is the seller open to a 14% concession, seller financing, or rate buy-down credit?
- Can we see the unit-by-unit rent roll, current vacancy, and any below-market leases? What's the average tenancy length?
- What capital expenditures (roof, boiler, parking lot, exteriors) have been made in the last 5 years, and what's planned in the next 2?
- Built in 1966 — when were the roof, HVAC, electrical panel, plumbing, and water heater last replaced?
- Why hasn't it sold? Are there any deal-killer items the seller is aware of (foundation, flood, title, zoning, code violations)?
- Is there a deadline driving the sale (1031 exchange, divorce, estate, relocation)? That informs how much negotiation room exists.
- The area grade is low — what's the realistic commute time and amenity access for the typical tenant pool here? Any planned neighborhood developments (good or bad) we should know about?
- What's the average days-on-market for RENTAL listings here right now (not sales)? A rising rental-DOM trend means longer vacancies and softer asking-rent achievability than the comps imply.
- What's the recent tenant-quality profile in this submarket — average credit score on applications, eviction rate, late-payment / NSF rate, and stable-employment percentage? A property-management company in the area should have these aggregated.
- How much new apartment / multifamily construction is in the pipeline within 1–3 miles? Heavy new supply (>2% of stock underway) typically softens rents 12–24 months out; light construction supports rent growth.
Investment metrics
- 1% rule
- 0.86% ✗
- Cap rate
- 6.49%
- Cash-on-cash
- 0.71%
- DSCR
- 1.03
- GRM
- 9.7
CMA / ARV
No comps found within radius.
Projected returns pro-forma
-3.0% appreciation · 0.65% rent growth · sell at horizon
- IRR
- -17.8%
- Equity multiple
- 0.39×
- Total profit
- $-60,023
- Equity at exit
- $52,186
- IRR
- -14.9%
- Equity multiple
- 0.24×
- Total profit
- $-74,873
- Equity at exit
- $30,262
Cash invested: $98,000 (down + closing). Projections, not guarantees.
Landlord ↔ Tenant lean methodology
- Overall (STATE)
- 87 Strongly Landlord-Friendly
- State Florida
- 87 Strongly Landlord-Friendly · R+3
- County
- — inherits STATE
- City
- — inherits STATE
ZIP-level market 33809
- Home prices YoY
- -20.9%
- Rents YoY
- 0.7%
- Active inventory
- 263
- Price-to-rent
- 19.3×
Monthly cashflow live
- Estimated rent
- $3,018 high interval (Pro) →
- Mortgage (P&I)
- −$1,835
- Tax from tax record
- −$345 /mo · $4,143/yr
- Insurance
- −$146
- HOA
- −$0
- Vacancy / Maint / Mgmt
- −$634
- Net cashflow
- $58
Break-even live
Sensitivity live
| Price | -10% $256 | -5% $157 | +0% $58 | +5% $-41 | +10% $-140 |
|---|---|---|---|---|---|
| Rent | -10% $-181 | -5% $-61 | +0% $58 | +5% $177 | +10% $296 |
| Rate | -1.0pp $234 | -0.5pp $147 | base $58 | +0.5pp $-33 | +1.0pp $-125 |
2-unit breakdown (identical units grouped — click to expand)
| Units | Beds | Baths | Est. rent |
|---|---|---|---|
| 2× units | 3 | 1 | $3,018 |
| #1 | 3 | 1 | $1,509 |
| #2 | 3 | 1 | $1,509 |
| Total (2 units) | $3,018 | ||
UW: 25.0% down · 7.5% · 30yr · 1.5% tax · 5.0% vac · 8.0% maint · 8.0% mgmt
Financing live
Cash to close
- Down payment
- $87,500
- Closing costs
- $10,500
- Reserves months
- —
- Total cash needed
- —
Loan-product check · same deal, 3 products live
Conventional
25% down · 7.5% · 30yr
- Down + closing
- —
- Monthly P&I
- —
- Monthly cashflow
- —
- DSCR
- —
- Eligible?
- —
Personal DTI + credit; lowest rate.
DSCR
20% down · 8.5% · 30yr
- Down + closing
- —
- Monthly P&I
- —
- Monthly cashflow
- —
- DSCR
- —
- Eligible?
- —
No personal income docs; deal must DSCR.
Hard money
10% down · 12.0% · 12mo
- Down + closing
- —
- Monthly P&I
- —
- Monthly cashflow
- —
- DSCR
- —
- Eligible?
- —
Short-term bridge; refi at stabilization.
Rent comps 15 comps
| Address | Beds | Baths | Sqft | Rent | $/sqft | DOM | Units | Dist |
|---|---|---|---|---|---|---|---|---|
| 4940 N Socrum Loop Rd Lakeland, FL | 3.0 | 2.5 | 1950 | $3,900 | $2.00 | 25d | 1 | 0.32mi |
| 733 Carpenters Way #37 Lakeland, FL | 2.0 | 1.5 | 1307 | $1,400 | $1.07 | 21d | 1 | 0.65mi |
| 4950 Deep Forest Ct Lakeland, FL | 1.0–3.0 | 1.0–2.0 | 1047 | $1,718 | $1.64 | 4d | 27 | 0.83mi |
| 4048 Chelsea Ln Lakeland, FL | 3.0 | 2.0 | 1697 | $2,320 | $1.37 | 5d | 1 | 0.87mi |
| 3685 Victoria Manor Dr Lakeland, FL | 3.0 | 1.0–2.0 | 1154 | $1,507 | $1.31 | 5d | 17 | 0.88mi |
| 206 Mary Catherine Ct Lakeland, FL | 3.0 | 2.0 | 1254 | $1,725 | $1.38 | 25d | 1 | 0.96mi |
| 5817 Daughtery Downs Loop Lakeland, FL | 3.0 | 2.0 | 1609 | $1,800 | $1.12 | 16d | 1 | 1.12mi |
| 5817 Daughtery Downs Loop Lakeland, FL | 3.0 | 2.0 | 1609 | $1,800 | $1.12 | 25d | 1 | 1.12mi |
| 5818 Bambi Dr Lakeland, FL | 3.0 | 2.0 | 1401 | $2,200 | $1.57 | 25d | 1 | 1.18mi |
| 907 Swann Dr Lakeland, FL | 3.0 | 3.0 | 1601 | $1,960 | $1.22 | 16d | 1 | 1.18mi |
| 5840 Sandpipers Dr Lakeland, FL | 3.0 | 2.0 | 1732 | $2,000 | $1.15 | 16d | 1 | 1.23mi |
| 236 Village Crest Ct Lakeland, FL | 2.0 | 2.0 | 1142 | $1,550 | $1.36 | 15d | 1 | 1.39mi |
| 5227 Grace St E Lakeland, FL | 3.0 | 2.0 | 1062 | $1,775 | $1.67 | 25d | 1 | 1.40mi |
| 1510 Galloway Oaks Dr Lakeland, FL | 2.0–3.0 | 2.0 | 1066 | $1,376 | $1.29 | 23d | 8 | 1.42mi |
| 6131 Doe Cir E Lakeland, FL | 3.0 | 2.0 | 1353 | $1,700 | $1.26 | 16d | 1 | 1.48mi |
Listing history 25 events
-
2026-06-22days on market $350,000 Active 68 DOM
-
2026-06-18days on market $350,000 Active 65 DOM
-
2026-06-17days on market $350,000 Active 64 DOM
-
2026-06-16days on market $350,000 Active 63 DOM
-
2026-06-15days on market $350,000 Active 62 DOM
-
2026-06-13days on market $350,000 Active 60 DOM
-
2026-06-10days on market $350,000 Active 57 DOM
-
2026-06-09days on market $350,000 Active 56 DOM
-
2026-06-08days on market $350,000 Active 55 DOM
-
2026-06-07days on market $350,000 Active 54 DOM
-
2026-06-05days on market $350,000 Active 51 DOM
-
2026-06-03days on market $350,000 Active 50 DOM
-
2026-06-03days on market $350,000 Active 49 DOM
-
2026-06-01days on market $350,000 Active 48 DOM
-
2026-05-31days on market $350,000 Active 47 DOM
-
2026-04-14$350,000 Active
-
2026-02-21historical
-
2026-01-06price $350,000
-
2025-10-24price $375,000
-
2025-10-19$350,000 Active
-
2023-08-28soldstatus $256,500
-
2023-02-23soldstatus $256,500
-
2023-01-11soldstatus $195,000
-
2001-05-03soldstatus $65,000
-
1996-07-01soldstatus $59,900
ⓘ Source: listings_history table (triggers on properties + properties_extension) + one-shot
backfill from property_details.listing_events for pre-trigger history.
Tax reassessment forecast FL · Resets to sale price
- Current annual tax
- $4,143 · $345/mo
- Projected year-2 tax
- $4,143 · $345/mo
- Expected delta
- $0/yr ($0/mo · 0.0%)
ⓘ Screening estimate from a state-policy table — verify with the county assessor before closing.
Climate risk First Street
- Flood 1/10 Low FEMA zone X (unshaded) · 0% chance over 30 yrs
- Wildfire 3/10 Moderate
- Heat 8/10 Severe 7 d/yr ≥108°F today · 21 d/yr by 30 yrs out
- Wind 9/10 Extreme 99% chance of damaging wind over 30 yrs
- Air quality 2/10 Low 1 unhealthy d/yr today · 1 by 30 yrs out
Nearby sold comps map
Loading sold comps map…
Walkable amenities ~0.75 mi
Loading nearby amenities…
Taxation est. · year 1
- Rental income
- $36,216
- − Mortgage interest
- −$19,605
- − Property taxes
- −$4,143
- − Insurance
- −$1,750
- − Repairs & maintenance
- −$2,897
- − Management
- −$2,897
- − Depreciation
- −$10,182
- Taxable loss
- −$5,259
- Est. tax savings @ 24.0%
- +$1,262
- After-tax cash flow
- $1,955/yr
For passive investors: Depreciation is non-cash, so a rental often shows a tax loss while cash-flowing — sheltering income. Rental losses are passive: they offset passive income freely, and up to $25,000/yr can offset ordinary (W-2) income if you actively participate and your MAGI is under $100k (phasing out to $0 by $150k); unused losses carry forward. On sale, claimed depreciation is recaptured at up to 25%, and gains may owe capital-gains tax (a 1031 exchange can defer both). Figures are a year-1 estimate at your 24.0% rate — not tax advice; consult a CPA.
Schools (NCES district)
- District
- Polk
- NCES district ID
- 1201590
- Math proficiency
- 39% ▼ -11.00%
- Reading proficiency
- 43% ▼ -4.00%
- Median HH income
- $43,979
- Composite
- 34.74/100
- National rank
- #5132
- State rank
- #62 of 73 in FL
Livability — Lakeland
- Score
- 77/100
- State rank
- #206
- US rank
- #3179
Category grades
Schools grade is shown separately in the Schools card above.
Census & demographics
- Census place
- Lakeland, FL
- County
- Polk County · 740,051 people
- City population
- 277,690
- Metro
- Lakeland-Winter Haven, FL
- Population (ZIP)
- 30,797
- Household income
- $70,066
- Rent vs Own
- Severe rent burden
- 924.0
Population outlook (Polk County) Hauer SSP2
- Today (2025)
- 752,975 people
- By 2030
- 804,621 · +6.9%
- By 2040
- 906,117 · +20.3%
- By 2050
- 1,000,476 · +32.9%
- By 2075
- 1,197,520 · +59.0%
- By 2100
- 1,271,518 · +68.9%
Race, ethnicity, and origin ACS 2023
- Neighborhood character
- Diverse neighborhood (Simpson 0.55)
- Race & ethnicity
- White 63% Hispanic / Latino 18% Black 11% Two or more races 11% Asian 3%
- Hispanic origin (detail)
- Puerto Rican 9% Cuban 1% Dominican 2%
- Common ancestry
- Lithuanian 2% Italian 2% Romanian 2%
- Foreign-born
- 11% · Canada, Jamaica
- Languages at home
- 81% English-only · Spanish 15% Other Asian/Pacific 2% Other Indo-European 1%
Political lean MEDSL · Polk
- 2024 margin
- Strong R (+20.7) · D 39.2% · R 59.9%
- 2008→2024 swing
- -14.6pp toward R · 2008: -6.1pp · 2024: -20.7pp
- All cycles
- 2024: R+20.7 2020: R+14.4 2016: R+14.1 2012: R+6.8 2008: R+6.1
Not yet ingested
- Civics
- —
Market trends
- HPI YoY
- ▼ -79.46%
- Current HPI
- 301.3054
- Rent YoY
- ▲ 0.65%
- Metro
- Lakeland-Winter Haven, FL
- State GDP YoY
- ▲ 3.28%
- F500 in state
- 36
Industry mix (Fortune 500 HQ in FL)
| Industry | F500 HQs | Revenue |
|---|---|---|
| Industrial Technology | 2 | $29B |
|
||
| Insurance | 2 | $17B |
|
||
| Retail | 1 | $60B |
|
||
| Technology Distribution | 1 | $58B |
|
||
| Homebuilding | 1 | $35B |
|
||
| Technology Manufacturing | 1 | $35B |
|
||
Price history
+484.3% since first listed10 events — show timeline
- 2026-04-14 Listed $350,000 Stellar MLS as Distributed by MLS Grid
- 2026-02-21 Listing Removed — Stellar MLS as Distributed by MLS Grid
- 2026-01-06 Price Changed $350,000 Stellar MLS as Distributed by MLS Grid
- 2025-10-24 Price Changed $375,000 Stellar MLS as Distributed by MLS Grid
- 2025-10-19 Listed $350,000 Stellar MLS as Distributed by MLS Grid
- 2023-08-28 Sold (Public Records) $256,500 Public Records
- 2023-02-23 Sold (Public Records) $256,500 Public Records
- 2023-01-11 Sold (Public Records) $195,000 Public Records
- 2001-05-03 Sold (Public Records) $65,000 Public Records
- 1996-07-01 Sold (Public Records) $59,900 Public Records
Property tax history
+12.7%/yrLatest (2025): $4,143 · +3.3% YoY. Source: county tax records.
Cash-flow waterfall
monthlySold comps — $/sqft
last 12 mo · ≤1 miLoading sold comps…