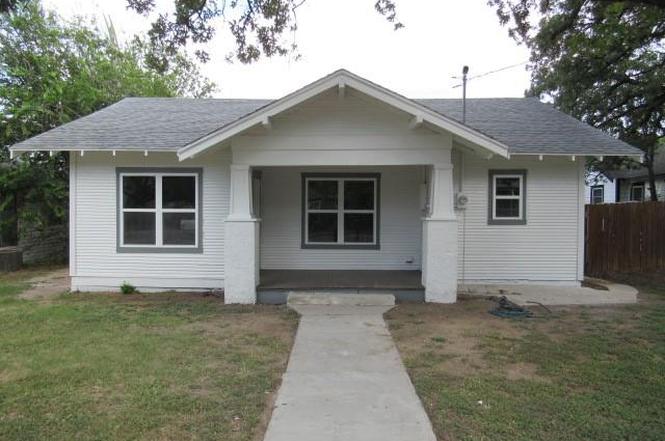
2204 Avenue E · Brownwood, TX
Flood risk 1/10 · Minimal
- FEMA flood zone
- X (unshaded)
- Chance of flooding over 30 yrs
- 0.0%
- Est. flood insurance / yr
- $507 – $1,088
Fire risk 6/10 · Moderate
- Est. fire insurance / yr
- $1,222 – $2,270
Heat risk 7/10 · Major
- Hot days now (above 107°F)
- 7 days/yr
- Hot days in 30 yrs
- 23 days/yr
Wind risk 6/10 · Moderate
- Chance of severe wind over 30 yrs
- 27.0%
Air-quality risk 1/10 · Minimal
- Unhealthy air days now
- 0 days/yr
- Unhealthy air days in 30 yrs
- 0 days/yr
Risk factors via First Street. Map © Google.
Why this score? — see what drove the D+ grade
The composite is a weighted blend of 9 inputs, each scored 0–100. Each bar is that input's sub-score; the figure is the points it added to the 100-point composite (weight × sub-score).
- Cash flow +19.1/30.0
- ARV discount +7.5/15.0
- DSCR +6.0/10.0
- 1% rule +5.0/10.0
- Schools +3.6/10.0
- Livability +3.2/5.0
- Rent growth +2.5/5.0
- Condition / age +2.5/5.0
- Appreciation +0.0/10.0
$109,500
🖨 Deal sheet 📄 Offer letter ✓ Due diligence
Listing remarks MLS
Very Nice Smaller home. Great for starter or investment. Some new electrical work. Some new plumbing. Overall this home for its age is in excellent condition. Need to look as it has great quality.
Key facts
- Recently remodeled
- New water heater
- Splitter a-c unit
Tags
Property features AI
Finance
- Other: Listing is Active Under Contract; Possession at closing/funding
- Financial info: Treat as clear loan type; No second mortgage information
- HOA & community: No association
Exterior
- Parking: Carport (1 covered space, 1 carport space)
- Utilities: City water; City sewer; No municipal utility district
- Home design: Single-family residence; Property is attached; Residential property
- Construction: Year built not specified
- Exterior features: Lot under 0.5 acre (approximately 0.172 acres); Subdivision: Grandview Add; Located in Brown County
Interior
- Kitchen: Kitchen with built-in cabinets; Appliances: Other
- Bedrooms: 2 bedrooms (both on the main level)
- Bathrooms: 1 full bathroom
- Interior features: One-level layout; 3 total rooms; Living area includes 1 living area and 1 dining area; Other interior features
Neighborhood map
What this means for you Summary
Snapshot
- This is a 2-bed/1.0-bath single-family listed at $110k.
Deal economics
- At list price, monthly cash flow is $117 ($1k/yr) — positive.
- The deal already cash-flows at list — no discount required.
- Meets the 1% rule at list price ($1k rent vs $110k).
- Recommended offer: $96k (12.0% below list) — sets the bar for market timing.
- Cap rate 7.6% vs local median 3.7% in Brownwood — top-decile yield for the area; either an underpriced asset or a hidden risk that comps aren't pricing in. Stress-test before assuming the spread holds.
Location & tenants
- Location reads 64/100 on livability (#781 in TX) — a middle-class / working-renter tenant base. Strengths: cost of living A+, housing A+; Watch: crime D+, health & safety D+, amenities F.
- Brownwood ISD (town): math 45% / reading 41% proficiency, ranked #344 of 826 in TX (top 42%) — families likely to look elsewhere, expect single-tenant / working-renter base with shorter leases.
- Zoned schools: Coggin El (math 45% / reading 34%, grade F, #1,545 of 4,322 statewide, top 38%, 708 students, 79% FRL) — zoned schools average 79% FRL vs 54% district-wide (25 pts higher); higher-poverty schools than district average — tighter screening recommended.
- Market conditions: 377 active listings in the ZIP; 1 comparable units currently listed for rent nearby; 142 units permitted in Brown County in 2024 (0 in 5+ unit buildings).
Forward outlook
- Local home prices are declining (-3.0%/yr); year-one equity from $757 of loan paydown is wiped out by about $3k of value loss. Plan a longer hold.
Negotiation context
- It's been on market 269 days — a 12% lower offer ($96k) is reasonable based on typical stale-listing flexibility.
- 2 sale attempts since 24y ago; this cycle's ask has dropped $20k (15%) from the opening price — seller is motivated, your offer sets the floor, not the list.
Risks & watch-outs
- Climate carrying-cost: major wind risk, 27% chance of damaging wind over 30y; major wildfire risk; extreme-heat days projected 7→23/yr by 2055 (HVAC capex compounding) — expect insurance premiums to compound above CPI over the hold.
Questions for the listing agent
- It's been on market 269 days. Have you received any prior offers? Is the seller open to a 12% concession, seller financing, or rate buy-down credit?
- Why hasn't it sold? Are there any deal-killer items the seller is aware of (foundation, flood, title, zoning, code violations)?
- Is there a deadline driving the sale (1031 exchange, divorce, estate, relocation)? That informs how much negotiation room exists.
- Schools are F-rated, which usually means shorter tenancies and higher turnover. Who's the typical renter profile here, and what's been the actual vacancy rate?
- Crime grade is D in this area — have there been break-ins, vandalism, or insurance claims at this property in the last 3 years? What carrier currently insures it and at what premium?
- The area grade is low — what's the realistic commute time and amenity access for the typical tenant pool here? Any planned neighborhood developments (good or bad) we should know about?
- What's the average days-on-market for RENTAL listings here right now (not sales)? A rising rental-DOM trend means longer vacancies and softer asking-rent achievability than the comps imply.
- What's the recent tenant-quality profile in this submarket — average credit score on applications, eviction rate, late-payment / NSF rate, and stable-employment percentage? A property-management company in the area should have these aggregated.
- How much new for-sale + rental construction is in the pipeline within 1–3 miles? Heavy new supply typically softens prices + rents 12–24 months out; constrained supply supports both.
Investment metrics
- 1% rule
- 1.00% ✓
- Cap rate
- 7.57%
- Cash-on-cash
- 4.57%
- DSCR
- 1.20
- GRM
- 8.3
CMA / ARV
- ARV (on-the-fly)
- $109,384
- Comps found
- 11
Show comp detail 11 sales within ~0.75 mi
| Address | Dist | Beds/Ba | Sqft | Sold | Price | $/sf | Match |
|---|---|---|---|---|---|---|---|
| 1809 Avenue C | 0.30mi | 2/1.0 | 911 (+1%) | 12mo | $109,900 | $121 | 74 |
| 1810 9th St | 0.34mi | 2/1.0 | 857 (-5%) | 2mo | $69,000 | $81 | 73 |
| 2400 Avenue I | 0.26mi | 2/1.0 | 896 (-1%) | 21mo | $130,000 | $145 | 69 |
| 1700 4th St | 0.48mi | 2/1.0 | 877 (-3%) | 6mo | $115,000 | $131 | 67 |
| 405 4th St | 0.61mi | 2/1.0 | 972 (+8%) | 3mo | $43,200 | $44 | 56 |
| 1507 Avenue J | 0.54mi | 2/1.0 | 804 (-11%) | 6mo | $39,000 | $49 | 52 |
| 2204 13th St | 0.70mi | 3/1.0 (+1) | 916 (+1%) | 11mo | $124,900 | $136 | 51 |
| 1620 Avenue D | 0.40mi | 2/1.0 | 1,036 (+15%) | 10mo | $105,000 | $101 | 49 |
| 1617 2nd St | 0.61mi | 3/1.0 (+1) | 902 (-0%) | 23mo | $114,700 | $127 | 47 |
| 2803 Avenue C | 0.43mi | 3/1.0 (+1) | 1,026 (+14%) | 15mo | $49,900 | $49 | 40 |
| 2104 6th St | 0.65mi | 3/1.0 (+1) | 1,027 (+14%) | 22mo | $148,000 | $144 | 24 |
Match score weights: distance 35% · size 25% · config 20% · recency 20%. Top-matched comps best support the ARV.
Projected returns pro-forma
-3.0% appreciation · 3.0% rent growth · sell at horizon
- IRR
- -9.2%
- Equity multiple
- 0.66×
- Total profit
- $-10,296
- Equity at exit
- $16,327
- IRR
- 0.3%
- Equity multiple
- 1.02×
- Total profit
- $655
- Equity at exit
- $9,468
Cash invested: $30,660 (down + closing). Projections, not guarantees.
Landlord ↔ Tenant lean methodology
- Overall (STATE)
- 87 Strongly Landlord-Friendly
- State Texas
- 87 Strongly Landlord-Friendly · R+5
- County
- — inherits STATE
- City
- — inherits STATE
ZIP-level market 76801
- Active inventory
- 377
- Price-to-rent
- 8.3×
Monthly cashflow live
- Estimated rent
- $1,095 medium interval (Pro) →
- Mortgage (P&I)
- −$574
- Tax from tax record
- −$128 /mo · $1,541/yr
- Insurance
- −$46
- HOA
- −$0
- Vacancy / Maint / Mgmt
- −$230
- Net cashflow
- $117
Break-even live
UW: 25.0% down · 7.5% · 30yr · 1.5% tax · 5.0% vac · 8.0% maint · 8.0% mgmt
Financing live
Cash to close
- Down payment
- $27,375
- Closing costs
- $3,285
- Reserves months
- —
- Total cash needed
- —
Loan-product check · same deal, 3 products live
Conventional
25% down · 7.5% · 30yr
- Down + closing
- —
- Monthly P&I
- —
- Monthly cashflow
- —
- DSCR
- —
- Eligible?
- —
Personal DTI + credit; lowest rate.
DSCR
20% down · 8.5% · 30yr
- Down + closing
- —
- Monthly P&I
- —
- Monthly cashflow
- —
- DSCR
- —
- Eligible?
- —
No personal income docs; deal must DSCR.
Hard money
10% down · 12.0% · 12mo
- Down + closing
- —
- Monthly P&I
- —
- Monthly cashflow
- —
- DSCR
- —
- Eligible?
- —
Short-term bridge; refi at stabilization.
Rent comps 1 comps
| Address | Beds | Baths | Sqft | Rent | $/sqft | DOM | Units | Dist |
|---|---|---|---|---|---|---|---|---|
| 2001 Brady Ave Unit 1705 Austin-A Brownwood, TX | 2.0 | 1.0 | 1070 | $1,095 | $1.02 | 44d | 1 | 0.34mi |
Listing history 10 events
-
2026-04-29status Pending
-
2026-04-22historical Active Option Contract
-
2026-02-26price $109,500
-
2025-11-19price $124,900
-
2025-11-03price $124,700
-
2025-08-03$129,000 Active
-
2002-11-04soldstatus 196-char remark
Show marketing remark (196 chars)
Very Nice Smaller home. Great for starter or investment. Some new electrical work. Some new plumbing. Overall this home for its age is in excellent condition. Need to look as it has great quality.
-
2002-11-04soldstatus
Show marketing remark (196 chars)
Very Nice Smaller home. Great for starter or investment. Some new electrical work. Some new plumbing. Overall this home for its age is in excellent condition. Need to look as it has great quality.
-
2002-10-09historical 196-char remark
Show marketing remark (196 chars)
Very Nice Smaller home. Great for starter or investment. Some new electrical work. Some new plumbing. Overall this home for its age is in excellent condition. Need to look as it has great quality.
-
2002-09-10$25,500 196-char remark
Show marketing remark (196 chars)
Very Nice Smaller home. Great for starter or investment. Some new electrical work. Some new plumbing. Overall this home for its age is in excellent condition. Need to look as it has great quality.
ⓘ Source: listings_history table (triggers on properties + properties_extension) + one-shot
backfill from property_details.listing_events for pre-trigger history.
Tax reassessment forecast TX · Resets to sale price
- Current annual tax
- $1,541 · $128/mo
- Projected year-2 tax
- $2,004 · $167/mo
- Expected delta
- +$463/yr (+$39/mo · 30.0%)
ⓘ Screening estimate from a state-policy table — verify with the county assessor before closing.
Climate risk First Street
- Flood 1/10 Low FEMA zone X (unshaded) · 0% chance over 30 yrs
- Wildfire 6/10 Major
- Heat 7/10 Severe 7 d/yr ≥107°F today · 23 d/yr by 30 yrs out
- Wind 6/10 Major 27% chance of damaging wind over 30 yrs
- Air quality 1/10 Low 0 unhealthy d/yr today · 0 by 30 yrs out
Nearby sold comps map
Loading sold comps map…
Walkable amenities ~0.75 mi
Loading nearby amenities…
Taxation est. · year 1
- Rental income
- $13,140
- − Mortgage interest
- −$6,134
- − Property taxes
- −$1,541
- − Insurance
- −$548
- − Repairs & maintenance
- −$1,051
- − Management
- −$1,051
- − Depreciation
- −$3,185
- Taxable loss
- −$370
- Est. tax savings @ 24.0%
- +$89
- After-tax cash flow
- $1,490/yr
For passive investors: Depreciation is non-cash, so a rental often shows a tax loss while cash-flowing — sheltering income. Rental losses are passive: they offset passive income freely, and up to $25,000/yr can offset ordinary (W-2) income if you actively participate and your MAGI is under $100k (phasing out to $0 by $150k); unused losses carry forward. On sale, claimed depreciation is recaptured at up to 25%, and gains may owe capital-gains tax (a 1031 exchange can defer both). Figures are a year-1 estimate at your 24.0% rate — not tax advice; consult a CPA.
Schools (NCES district)
- District
- Brownwood ISD
- NCES district ID
- 4811700
- Math proficiency
- 45% ▲ 4.00%
- Reading proficiency
- 41% ▲ 1.00%
- Median HH income
- $37,395
- Composite
- 35.8/100
- National rank
- #4833
- State rank
- #344 of 826 in TX
Livability — Brownwood
- Score
- 64/100
- State rank
- #781
- US rank
- #14230
Category grades
Schools grade is shown separately in the Schools card above.
Census & demographics
- Census place
- Brownwood, TX
- Population (ZIP)
- 25,152
Population outlook (Brown County) Hauer SSP2
- Today (2025)
- 38,381 people
- By 2030
- 38,288 · -0.2%
- By 2040
- 38,120 · -0.7%
- By 2050
- 38,227 · -0.4%
- By 2075
- 39,362 · +2.6%
- By 2100
- 39,171 · +2.1%
Race, ethnicity, and origin ACS 2023
- Neighborhood character
- Predominantly White (66%)
- Race & ethnicity
- White 66% Hispanic / Latino 26% Two or more races 15% Black 4%
- Hispanic origin (detail)
- Mexican 23%
- Common ancestry
- Italian 12% Slovak 2% Lithuanian 1%
- Foreign-born
- 4% · Canada
- Languages at home
- 82% English-only · Spanish 17%
Political lean MEDSL · Brown
- 2024 margin
- Solid R (+73.9) · D 12.7% · R 86.6%
- 2008→2024 swing
- -12.5pp toward R · 2008: -61.5pp · 2024: -73.9pp
- All cycles
- 2024: R+73.9 2020: R+72.6 2016: R+74.5 2012: R+71.7 2008: R+61.5
Not yet ingested
- Civics
- —
Market trends
- HPI YoY
- ▼ -121.52%
- Current HPI
- 164.0992
- Rent YoY
- —
- Metro
- —
- State GDP YoY
- ▲ 3.95%
- F500 in state
- 110
Industry mix (Fortune 500 HQ in TX)
| Industry | F500 HQs | Revenue |
|---|---|---|
| Energy | 16 | $1,198B |
|
||
| Technology | 5 | $198B |
|
||
| Engineering / Construction | 4 | $72B |
|
||
| Energy Services | 3 | $60B |
|
||
| Utilities | 3 | $41B |
|
||
| Healthcare | 2 | $330B |
|
||
Price history
+329.4% since first listed10 events — show timeline
- 2026-04-29 Pending — NTREIS
- 2026-04-22 Contingent — NTREIS
- 2026-02-26 Price Changed $109,500 NTREIS
- 2025-11-19 Price Changed $124,900 NTREIS
- 2025-11-03 Price Changed $124,700 NTREIS
- 2025-08-03 Listed $129,000 NTREIS
- 2002-11-04 Sold (Public Records) — Public Records
- 2002-11-04 Sold (MLS) — NTREIS
- 2002-10-09 Listing Removed — NTREIS
- 2002-09-10 Listed $25,500 NTREIS
Property tax history
+3.5%/yrLatest (2025): $1,541 · -0.1% YoY. Source: county tax records.
Cash-flow waterfall
monthlySold comps — $/sqft
last 12 mo · ≤1 miLoading sold comps…