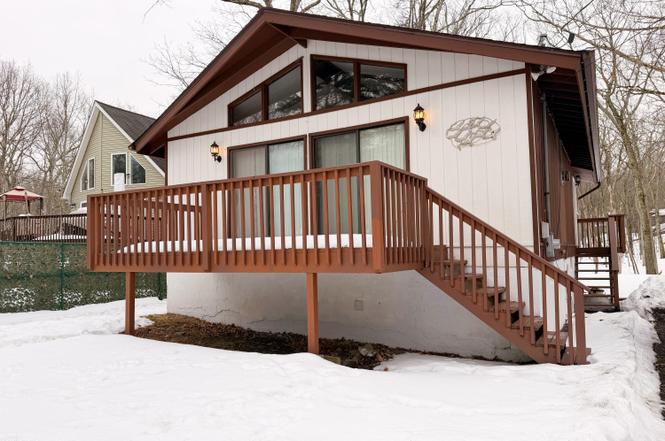
110 Spring Dr · Pocono Ranch Lands, PA
Flood risk 1/10 · Minimal
- FEMA flood zone
- X (unshaded)
- Chance of flooding over 30 yrs
- 0.0%
- Est. flood insurance / yr
- $473 – $860
Fire risk 4/10 · Minor
- Est. fire insurance / yr
- $511 – $949
Heat risk 3/10 · Minor
- Hot days now (above 95°F)
- 7 days/yr
- Hot days in 30 yrs
- 15 days/yr
Wind risk 4/10 · Minor
- Chance of severe wind over 30 yrs
- 8.0%
Air-quality risk 2/10 · Minimal
- Unhealthy air days now
- 1 days/yr
- Unhealthy air days in 30 yrs
- 2 days/yr
Risk factors via First Street. Map © Google.
Why this score? — see what drove the C+ grade
The composite is a weighted blend of 9 inputs, each scored 0–100. Each bar is that input's sub-score; the figure is the points it added to the 100-point composite (weight × sub-score).
- Cash flow +16.5/30.0
- ARV discount +11.4/15.0
- Appreciation +10.0/10.0
- 1% rule +5.2/10.0
- DSCR +5.1/10.0
- Schools +4.7/10.0
- Livability +3.3/5.0
- Rent growth +2.5/5.0
- Condition / age +2.5/5.0
$169,000
🖨 Deal sheet 📄 Offer letter ✓ Due diligence
Listing remarks
Best of both worlds. .well loved with room for personal touch located in the gated community of Wild Acres. This two bedroom ranch is it! Find inside two bedrooms, living room with a gas FP, vaulted ceilings, and two additional bonus rooms! One of which is currently occupied by a hot tub and surrounded by knotty pine interior for that extra comfort. Additional home features include front deck, and unfinished basement. Stay the weekend or stay awhile. Schedule your showing today!
Key facts
- Gated community
- Knotty pine interior
- Front deck
Tags
Neighborhood map
What this means for you Summary
Snapshot
- This is a 2-bed/1.0-bath single-family listed at $169k.
Deal economics
- At list price, monthly cash flow is $98 ($1k/yr) — positive.
- The deal already cash-flows at list — no discount required.
- Meets the 1% rule at list price ($2k rent vs $169k).
- Recommended offer: $166k (1.5% below list) — sets the bar for market timing.
- Cap rate 7.0% vs local median 4.4% in Pocono Ranch Lands — top-decile yield for the area; either an underpriced asset or a hidden risk that comps aren't pricing in. Stress-test before assuming the spread holds.
Location & tenants
- Location reads 66/100 on livability (#1,037 in PA) — a middle-class / working-renter tenant base. Strengths: crime A+, cost of living A+, housing A; Watch: employment D, health & safety D, schools F.
- Delaware Valley SD (rural): math 41% / reading 66% proficiency, ranked #121 of 539 in PA (top 22%) — acceptable for families but not a draw, mixed tenant base, ~2y average lease.
- Market conditions: 211 active listings in the ZIP; 213 units permitted in Pike County in 2024 (0 in 5+ unit buildings).
Forward outlook
- In year one you build about $18k of equity ($1k loan paydown + $17k appreciation (10.0% local appreciation)).
- Pike County population projected at -25% by 2050 — secular population decline; favor cash flow + early exit over multi-decade hold.
- At projected returns (10.0% appreciation + 3.0% rent growth), your $47k cash investment doubles in ~3 years — after that, you're playing with house money.
- By year 3, paydown + projected appreciation supports a ~$46k cash-out refi (75% LTV) — recoverable capital for the next deal without selling this one.
Negotiation context
- It's been on market 16 days — a 2% lower offer ($166k) is reasonable based on typical stale-listing flexibility.
- 9 sale attempts since 3y ago with the ask held roughly flat each time — persistent listings suggest the price (not the market) is what's stuck; bring a comps-based counter.
Questions for the listing agent
- What does the HOA fee cover, when was the last increase, and are there any pending special assessments or reserve-fund shortfalls?
- Is there a deadline driving the sale (1031 exchange, divorce, estate, relocation)? That informs how much negotiation room exists.
- Schools are F-rated, which usually means shorter tenancies and higher turnover. Who's the typical renter profile here, and what's been the actual vacancy rate?
- What's the average days-on-market for RENTAL listings here right now (not sales)? A rising rental-DOM trend means longer vacancies and softer asking-rent achievability than the comps imply.
- What's the recent tenant-quality profile in this submarket — average credit score on applications, eviction rate, late-payment / NSF rate, and stable-employment percentage? A property-management company in the area should have these aggregated.
- How much new for-sale + rental construction is in the pipeline within 1–3 miles? Heavy new supply typically softens prices + rents 12–24 months out; constrained supply supports both.
Investment metrics
- 1% rule
- 1.02% ✓
- Cap rate
- 6.99%
- Cash-on-cash
- 2.48%
- DSCR
- 1.11
- GRM
- 8.2
CMA / ARV
- ARV (on-the-fly)
- $185,136
- Comps found
- 9
Show comp detail 9 sales within ~0.75 mi
| Address | Dist | Beds/Ba | Sqft | Sold | Price | $/sf | Match |
|---|---|---|---|---|---|---|---|
| 109 Autumn Rd | 0.09mi | 3/1.0 (+1) | 864 (-5%) | 10mo | $170,000 | $197 | 74 |
| 107 Summer Dr | 0.06mi | 2/1.0 | 984 (+8%) | 18mo | $200,000 | $203 | 69 |
| 112 Keystone Ct | 0.29mi | 2/1.0 | 960 (+5%) | 21mo | $188,837 | $197 | 60 |
| 164 Westwood Dr | 0.31mi | 2/1.0 | 992 (+9%) | 15mo | $215,000 | $217 | 58 |
| 147 Spring Dr | 0.26mi | 3/1.0 (+1) | 1,008 (+10%) | 11mo | $222,000 | $220 | 56 |
| 159 Sandstone Dr | 0.45mi | 2/1.0 | 781 (-14%) | 6mo | $106,000 | $136 | 50 |
| 158 Mountain Lake Dr | 0.49mi | 2/1.0 | 864 (-5%) | 23mo | $130,000 | $150 | 49 |
| 260 High Ridge Rd | 0.51mi | 3/1.0 (+1) | 960 (+5%) | 18mo | $235,000 | $245 | 47 |
| 310 Wild Acres Dr | 0.71mi | 2/1.0 | 848 (-7%) | 19mo | $182,500 | $215 | 39 |
Match score weights: distance 35% · size 25% · config 20% · recency 20%. Top-matched comps best support the ARV.
Projected returns pro-forma
10.0% appreciation · 3.0% rent growth · sell at horizon
- IRR
- 26.1%
- Equity multiple
- 3.08×
- Total profit
- $98,350
- Equity at exit
- $152,249
- IRR
- 22.9%
- Equity multiple
- 7.02×
- Total profit
- $284,893
- Equity at exit
- $328,330
Cash invested: $47,320 (down + closing). Projections, not guarantees.
Landlord ↔ Tenant lean methodology
- Overall (STATE)
- 62 Landlord-Friendly
- State Pennsylvania
- 62 Landlord-Friendly · EVEN
- County
- — inherits STATE
- City
- — inherits STATE
ZIP-level market 18328
- Home prices YoY
- 18.1%
- Active inventory
- 211
- Price-to-rent
- 8.2×
Monthly cashflow live
- Estimated rent
- $1,719 medium interval (Pro) →
- Mortgage (P&I)
- −$886
- Tax est. 1.5%
- −$211 /mo · $2,535/yr
- Insurance
- −$70
- HOA
- −$92
- Vacancy / Maint / Mgmt
- −$361
- Net cashflow
- $98
Break-even live
UW: 25.0% down · 7.5% · 30yr · 1.5% tax · 5.0% vac · 8.0% maint · 8.0% mgmt
Financing live
Cash to close
- Down payment
- $42,250
- Closing costs
- $5,070
- Reserves months
- —
- Total cash needed
- —
Loan-product check · same deal, 3 products live
Conventional
25% down · 7.5% · 30yr
- Down + closing
- —
- Monthly P&I
- —
- Monthly cashflow
- —
- DSCR
- —
- Eligible?
- —
Personal DTI + credit; lowest rate.
DSCR
20% down · 8.5% · 30yr
- Down + closing
- —
- Monthly P&I
- —
- Monthly cashflow
- —
- DSCR
- —
- Eligible?
- —
No personal income docs; deal must DSCR.
Hard money
10% down · 12.0% · 12mo
- Down + closing
- —
- Monthly P&I
- —
- Monthly cashflow
- —
- DSCR
- —
- Eligible?
- —
Short-term bridge; refi at stabilization.
HOA detail
- Monthly dues
- $92 · $1,104/yr
- Likely covers
- gassecurity
Listing history 22 events
-
2026-03-08status Pending
-
2026-02-19$169,000 Active
-
2024-09-24price $185,000
-
2024-09-04price $199,900
-
2024-07-12price $205,000
-
2024-06-01$215,000 Active
-
2023-12-28historical
-
2023-12-26historical
-
2023-11-07$190,000 Active
-
2023-11-07historical
-
2023-11-07$190,000 Active
-
2023-11-07$190,000 Active
-
2023-11-05historical
-
2023-09-11price $195,000
-
2023-09-11price $195,000
-
2023-09-11price $195,000
-
2023-09-02status Active
-
2023-08-04historical
-
2023-07-14$200,000 Active
-
2023-07-12historical
-
2023-07-12$200,000 Active
-
2023-07-12$200,000 Active - No Show
ⓘ Source: listings_history table (triggers on properties + properties_extension) + one-shot
backfill from property_details.listing_events for pre-trigger history.
Climate risk First Street
- Flood 1/10 Low FEMA zone X (unshaded) · 0% chance over 30 yrs
- Wildfire 4/10 Moderate
- Heat 3/10 Moderate 7 d/yr ≥95°F today · 15 d/yr by 30 yrs out
- Wind 4/10 Moderate 8% chance of damaging wind over 30 yrs
- Air quality 2/10 Low 1 unhealthy d/yr today · 2 by 30 yrs out
Nearby sold comps map
Loading sold comps map…
Walkable amenities ~0.75 mi
Loading nearby amenities…
Taxation est. · year 1
- Rental income
- $20,623
- − Mortgage interest
- −$9,467
- − Property taxes
- −$2,535
- − Insurance
- −$845
- − Repairs & maintenance
- −$1,650
- − Management
- −$1,650
- − HOA
- −$1,104
- − Depreciation
- −$4,916
- Taxable loss
- −$1,544
- Est. tax savings @ 24.0%
- +$371
- After-tax cash flow
- $1,544/yr
For passive investors: Depreciation is non-cash, so a rental often shows a tax loss while cash-flowing — sheltering income. Rental losses are passive: they offset passive income freely, and up to $25,000/yr can offset ordinary (W-2) income if you actively participate and your MAGI is under $100k (phasing out to $0 by $150k); unused losses carry forward. On sale, claimed depreciation is recaptured at up to 25%, and gains may owe capital-gains tax (a 1031 exchange can defer both). Figures are a year-1 estimate at your 24.0% rate — not tax advice; consult a CPA.
Schools (NCES district)
- District
- Delaware Valley SD
- NCES district ID
- 4207530
- Math proficiency
- 41% ▼ -12.00%
- Reading proficiency
- 66% ▼ -9.00%
- Median HH income
- $64,202
- Composite
- 46.95/100
- National rank
- #2359
- State rank
- #121 of 539 in PA
Livability — Pocono Ranch Lands
- Score
- 66/100
- State rank
- #1037
- US rank
- #11566
Category grades
Schools grade is shown separately in the Schools card above.
Census & demographics
- Population (ZIP)
- 8,061
Population outlook (Pike County) Hauer SSP2
- Today (2025)
- 53,548 people
- By 2030
- 51,622 · -3.6%
- By 2040
- 46,490 · -13.2%
- By 2050
- 40,372 · -24.6%
- By 2075
- 31,951 · -40.3%
- By 2100
- 26,821 · -49.9%
Race, ethnicity, and origin ACS 2023
- Neighborhood character
- Predominantly White (85%)
- Race & ethnicity
- White 85% Hispanic / Latino 10% Two or more races 8%
- Hispanic origin (detail)
- Puerto Rican 5%
- Common ancestry
- Scotch-Irish 6% Romanian 6% Iranian 4%
- Foreign-born
- 9% · Canada, Jamaica
- Languages at home
- 86% English-only · Spanish 6% Russian/Polish/Slavic 5% Other Indo-European 2%
Political lean MEDSL · Pike
- 2024 margin
- Strong R (+24.1) · D 37.6% · R 61.6%
- 2008→2024 swing
- -19.8pp toward R · 2008: -4.2pp · 2024: -24.1pp
- All cycles
- 2024: R+24.1 2020: R+19.0 2016: R+26.0 2012: R+11.0 2008: R+4.2
Not yet ingested
- Civics
- —
Market trends
- HPI YoY
- ▲ 38.13%
- Current HPI
- 248.4494
- Rent YoY
- —
- Metro
- —
- State GDP YoY
- ▲ 1.68%
- F500 in state
- 34
Industry mix (Fortune 500 HQ in PA)
| Industry | F500 HQs | Revenue |
|---|---|---|
| Healthcare | 2 | $309B |
|
||
| Insurance | 2 | $27B |
|
||
| Telecommunications / Media | 1 | $124B |
|
||
| Industrial Distribution | 1 | $22B |
|
||
| Financial Services | 1 | $20B |
|
||
| Chemicals / Materials | 1 | $18B |
|
||
Price history
-15.5% since first listed22 events — show timeline
- 2026-03-08 Pending — PWMLS
- 2026-02-19 Listed $169,000 PWMLS
- 2024-09-24 Price Changed $185,000 PWMLS
- 2024-09-04 Price Changed $199,900 PWMLS
- 2024-07-12 Price Changed $205,000 PWMLS
- 2024-06-01 Listed $215,000 PWMLS
- 2023-12-28 Listing Removed — BRIGHT MLS
- 2023-12-26 Listing Removed — GLVRMLS
- 2023-11-07 Listed $190,000 PMAR
- 2023-11-07 Listing Removed — BRIGHT MLS
- 2023-11-07 Listed $190,000 BRIGHT MLS
- 2023-11-07 Listed $190,000 GLVRMLS
- 2023-11-05 Listing Removed — GLVRMLS
- 2023-09-11 Price Changed $195,000 BRIGHT MLS
- 2023-09-11 Price Changed $195,000 GLVRMLS
- 2023-09-11 Price Changed $195,000 PMAR
- 2023-09-02 Relisted — PMAR
- 2023-08-04 Delisted — PMAR
- 2023-07-14 Listed $200,000 BRIGHT MLS
- 2023-07-12 Coming Soon — BRIGHT MLS
- 2023-07-12 Listed $200,000 GLVRMLS
- 2023-07-12 Listed $200,000 PMAR
Cash-flow waterfall
monthlySold comps — $/sqft
last 12 mo · ≤1 miLoading sold comps…