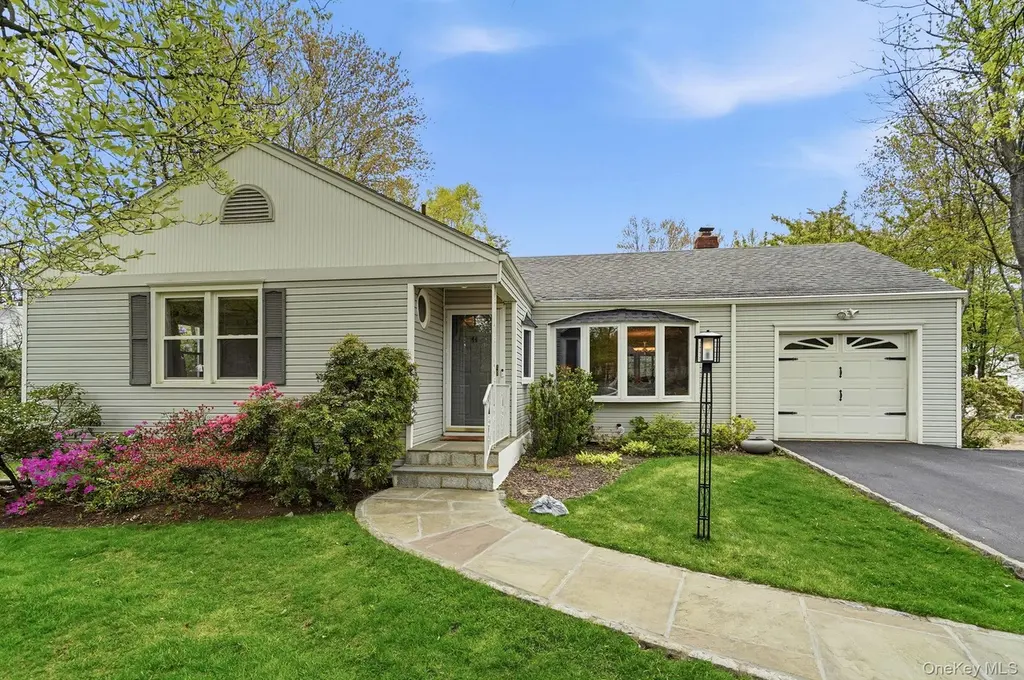
44 Darling Ave · New Rochelle, NY
Flood risk 7/10 · Major
- FEMA flood zone
- X (unshaded)
- Chance of flooding over 30 yrs
- 0.96%
- Est. flood insurance / yr
- $473 – $860
Fire risk 1/10 · Minimal
- Est. fire insurance / yr
- $691 – $1,283
Heat risk 5/10 · Moderate
- Hot days now (above 98°F)
- 7 days/yr
- Hot days in 30 yrs
- 16 days/yr
Wind risk 6/10 · Moderate
- Chance of severe wind over 30 yrs
- 27.0%
Air-quality risk 4/10 · Minor
- Unhealthy air days now
- 3 days/yr
- Unhealthy air days in 30 yrs
- 5 days/yr
Risk factors via First Street. Map © Google.
Why this score? — see what drove the D grade
The composite is a weighted blend of 9 inputs, each scored 0–100. Each bar is that input's sub-score; the figure is the points it added to the 100-point composite (weight × sub-score).
- ARV discount +15.0/15.0
- Cash flow +8.1/30.0
- Schools +5.7/10.0
- Livability +3.5/5.0
- 1% rule +2.6/10.0
- Rent growth +2.5/5.0
- Condition / age +2.5/5.0
- DSCR +2.1/10.0
- Appreciation +0.0/10.0
$939,000
🖨 Deal sheet 📄 Offer letter ✓ Due diligence
Listing remarks
Hang your coats and backpacks in the welcoming entrance foyer of this beautiful move-in ready expanded ranch. Rare in this quiet coveted Davis Elementary School neighborhood, this is a true four bedroom 2.5 bath home with bright spacious rooms offering a great one-level lifestyle. The open floor plan is fabulous for casual living and entertaining featuring: bay-windowed living room, dining room, expansive Great Room with wood burning fireplace and Palladium windows offering views of the verdant, almost half acre level property. The open-style gourmet kitchen w/ granite countertops and cherry wood cabinets has a walk-in pantry for all your storage needs, a pendant-lit breakfast bar and casua
Key facts
- 0.43 acre lot
- Garage
- Built 1954
Property features AI
Exterior
- Parking: Attached garage; 1-car garage; Driveway; No carport
- Security: Security system
- Utilities: Electricity connected (Con-Edison); Natural gas connected; Public water; Public sewer; Trash collection
- Home design: Single-family residence; One level; Finished full basement
- Construction: Frame construction; Pull-down attic stairs; Finished basement with storage space
- Exterior features: Deck; Irrigation system; Not waterfront
Interior
- Kitchen: Cooktop; Dishwasher; Disposal; Microwave; Oven; Refrigerator; Granite counters; Breakfast bar
- Bedrooms: Master downstairs
- Flooring: Carpet; Hardwood; Tile
- Bathrooms: 2 full bathrooms; 1 half bathroom; First-floor full bath
- Heating & cooling: Hot air heating; Central air conditioning; Fireplace
- Interior features: First-floor bedroom; First-floor full bathroom; Breakfast bar; Cathedral ceilings; Entrance foyer; Formal dining room; Granite counters; Primary bathroom; Master bedroom on the main level; Bay windows; Blinds; Window screens; Deck
- Laundry & utility: Laundry room; Washer; Dryer; Gas water heater
Neighborhood map
What this means for you Summary
Snapshot
- This is a 3-bed/2.0-bath single-family listed at $939k.
Deal economics
- At list price, monthly cash flow is $-967 ($-12k/yr) — negative.
- To cash-flow at today's rent, offer at most $768k (18.2% below list).
- To meet the 1% rule (rent ≥ 1% of price), the offer needs to be $715k (23.8% below list).
- Recommended offer: $715k (23.8% below list) — sets the bar for 1% rule.
Location & tenants
- Location reads 69/100 on livability (#487 in NY) — a middle-class / working-renter tenant base. Strengths: employment A+, crime A, amenities B+; Watch: housing D+, commute F, cost of living F.
- New Rochelle City School District (suburban): math 63% / reading 66% proficiency, ranked #171 of 590 in NY (top 29%) — acceptable for families but not a draw, mixed tenant base, ~2y average lease.
- Zoned schools: George M Davis Elementary School (math 72% / reading 72%, grade A-, #378 of 2,108 statewide, top 20%, 667 students, 36% FRL); Albert Leonard Middle School (math 41% / reading 73%, grade B, #192 of 729 statewide, top 28%, 1,086 students, 42% FRL); New Rochelle High School (math 87% / reading 72%, grade A-, #518 of 1,100 statewide, top 51%, 3,076 students, 57% FRL) — zoned schools at 45% FRL track the district average.
- Market conditions: 116 active listings in the ZIP; 8 comparable units currently listed for rent nearby; rentals at typical pace (median 22d on market — plan ~3-4 weeks tenant-placement turnaround); 954 units permitted in Westchester County in 2024 (649 in 5+ unit buildings).
Forward outlook
- Local home prices are declining (-3.0%/yr); year-one equity from $6k of loan paydown is wiped out by about $28k of value loss. Plan a longer hold.
- Westchester County population projected at +10% by 2050 — modest demand growth; plan on rents tracking national, not racing it.
Negotiation context
- Only 3 days on market — expect competitive offers; lowballing is unlikely to land.
- Current owner paid $213k; list at $939k implies a 341% gain — meaningful room to come down on a strong offer.
Risks & watch-outs
- Watch-outs: flood insurance adds $56/mo; built in 1954 — expect roof / HVAC / electrical / plumbing capex.
- Climate carrying-cost: major flood risk; major wind risk, 27% chance of damaging wind over 30y; extreme-heat days projected 7→16/yr by 2055 (HVAC capex compounding) — expect insurance premiums to compound above CPI over the hold.
Questions for the listing agent
- What do current leases actually rent for vs. the listed asking? Can we see a recent rent roll and the last 12 months of T-12 income?
- Built in 1954 — when were the roof, HVAC, electrical panel, plumbing, and water heater last replaced?
- What's the actual annual flood-insurance premium (NFIP or private), and is the property in a SFHA with mandatory coverage?
- Is there a deadline driving the sale (1031 exchange, divorce, estate, relocation)? That informs how much negotiation room exists.
- The area grade is low — what's the realistic commute time and amenity access for the typical tenant pool here? Any planned neighborhood developments (good or bad) we should know about?
- What's the average days-on-market for RENTAL listings here right now (not sales)? A rising rental-DOM trend means longer vacancies and softer asking-rent achievability than the comps imply.
- What's the recent tenant-quality profile in this submarket — average credit score on applications, eviction rate, late-payment / NSF rate, and stable-employment percentage? A property-management company in the area should have these aggregated.
- How much new for-sale + rental construction is in the pipeline within 1–3 miles? Heavy new supply typically softens prices + rents 12–24 months out; constrained supply supports both.
Investment metrics
- 1% rule
- 0.76% ✗
- Cap rate
- 5.13%
- Cash-on-cash
- -4.16%
- DSCR
- 0.81
- GRM
- 10.9
CMA / ARV
- ARV (median comp)
- $1,224,673
- List price
- $939,000
- Delta
- -23.33%
- Verdict
- UNDERPRICED
- Comps
- 20 within 1.0 mi
Show comp detail 12 sales within ~0.75 mi
| Address | Dist | Beds/Ba | Sqft | Sold | Price | $/sf | Match |
|---|---|---|---|---|---|---|---|
| 151 Hilburn Rd | 0.40mi | 3/2.0 | 2,215 (-1%) | 2mo | $1,500,000 | $677 | 78 |
| 18 Lambert Ln | 0.21mi | 3/3.5 | 2,079 (-7%) | 4mo | $1,310,000 | $630 | 69 |
| 32 Lambert Ln | 0.20mi | 4/3.0 (+1) | 2,464 (+10%) | 1mo | $890,000 | $361 | 64 |
| 168 Waverly Rd | 0.52mi | 3/3.0 | 2,114 (-6%) | 1mo | $1,370,000 | $648 | 61 |
| 130 Locust Ave | 0.57mi | 3/2.5 | 2,400 (+7%) | 1mo | $1,619,000 | $675 | 59 |
| 155 Hilburn Rd | 0.38mi | 4/3.0 (+1) | 2,429 (+9%) | 3mo | $1,670,000 | $688 | 57 |
| 3 Greentree Dr | 0.72mi | 3/2.5 | 2,130 (-5%) | 2mo | $1,260,000 | $592 | 55 |
| 1079 Weaver St | 0.70mi | 3/2.5 | 2,400 (+7%) | 1mo | $1,110,000 | $463 | 52 |
| 44 Amherst Dr | 0.70mi | 4/3.0 (+1) | 2,181 (-2%) | 3mo | $1,187,000 | $544 | 52 |
| 33 Johnson Rd | 0.55mi | 3/2.0 | 1,980 (-12%) | 4mo | $1,200,000 | $606 | 52 |
| 105 Sprague Rd | 0.52mi | 3/1.5 | 1,959 (-12%) | 4mo | $1,215,000 | $620 | 50 |
| 43 Amherst Dr | 0.69mi | 4/2.5 (+1) | 2,364 (+6%) | 4mo | $1,325,000 | $560 | 48 |
Match score weights: distance 35% · size 25% · config 20% · recency 20%. Top-matched comps best support the ARV.
Projected returns pro-forma
-3.0% appreciation · 3.0% rent growth · sell at horizon
- IRR
- -23.7%
- Equity multiple
- 0.19×
- Total profit
- $-213,538
- Equity at exit
- $140,008
- IRR
- -18.6%
- Equity multiple
- -0.01×
- Total profit
- $-264,462
- Equity at exit
- $81,188
Cash invested: $262,920 (down + closing). Projections, not guarantees.
Landlord ↔ Tenant lean methodology
- Overall (STATE)
- 15 Strongly Tenant-Friendly
- State New York
- 15 Strongly Tenant-Friendly · D+10
- County
- — inherits STATE
- City
- — inherits STATE
ZIP-level market 10804
- Active inventory
- 116
- Price-to-rent
- 10.9×
Monthly cashflow live
- Estimated rent
- $7,154 high interval (Pro) →
- Mortgage (P&I)
- −$4,924
- Tax from tax record
- −$1,247 /mo · $14,966/yr
- Insurance
- −$391
- Flood insurance flood zone
- −$56 /mo · $666/yr
- HOA
- −$0
- Vacancy / Maint / Mgmt
- −$1,502
- Net cashflow
- $-967
Break-even live
UW: 25.0% down · 7.5% · 30yr · 1.5% tax · 5.0% vac · 8.0% maint · 8.0% mgmt
Financing live
Cash to close
- Down payment
- $234,750
- Closing costs
- $28,170
- Reserves months
- —
- Total cash needed
- —
Loan-product check · same deal, 3 products live
Conventional
25% down · 7.5% · 30yr
- Down + closing
- —
- Monthly P&I
- —
- Monthly cashflow
- —
- DSCR
- —
- Eligible?
- —
Personal DTI + credit; lowest rate.
DSCR
20% down · 8.5% · 30yr
- Down + closing
- —
- Monthly P&I
- —
- Monthly cashflow
- —
- DSCR
- —
- Eligible?
- —
No personal income docs; deal must DSCR.
Hard money
10% down · 12.0% · 12mo
- Down + closing
- —
- Monthly P&I
- —
- Monthly cashflow
- —
- DSCR
- —
- Eligible?
- —
Short-term bridge; refi at stabilization.
Rent comps 8 comps
| Address | Beds | Baths | Sqft | Rent | $/sqft | DOM | Units | Dist |
|---|---|---|---|---|---|---|---|---|
| 106 White Rd Scarsdale, NY | 3.0 | 2.0 | 1700 | $5,999 | $3.53 | 22d | 1 | 0.48mi |
| 106 White Rd Scarsdale, NY | 3.0 | 2.0 | 1700 | $5,800 | $3.41 | 1d | 1 | 0.48mi |
| 155 White Rd Scarsdale, NY | 3.0 | 1.5 | 1632 | $7,000 | $4.29 | 43d | 1 | 0.55mi |
| 4 Greentree Dr Scarsdale, NY | 4.0 | 2.5 | 2086 | $6,850 | $3.28 | 1d | 1 | 0.69mi |
| 154 Bell Rd Scarsdale, NY | 3.0 | 2.5 | 1611 | $7,900 | $4.90 | 1d | 1 | 0.84mi |
| 372 Heathcote Rd Scarsdale, NY | 4.0 | 3.0 | 2826 | $12,000 | $4.25 | 1d | 1 | 0.86mi |
| 96 Alkamont Ave Scarsdale, NY | 2.0 | 1.0 | 2000 | $3,500 | $1.75 | 43d | 1 | 1.22mi |
| 36 Grand Blvd Unit 2 Scarsdale, NY | 3.0 | 2.0 | 1500 | $6,100 | $4.07 | 43d | 1 | 1.39mi |
Listing history 4 events
-
2026-05-08status Pending 1223-char remark
-
2026-05-01$939,000 Active 1223-char remark
-
2026-04-29historical $939,000 1223-char remark
-
1996-11-08soldstatus $213,000
ⓘ Source: listings_history table (triggers on properties + properties_extension) + one-shot
backfill from property_details.listing_events for pre-trigger history.
Tax reassessment forecast NY · Partial reset (capped growth)
- Current annual tax
- $14,966 · $1,247/mo
- Projected year-2 tax
- $15,417 · $1,285/mo
- Expected delta
- +$452/yr (+$38/mo · 3.0%)
ⓘ Screening estimate from a state-policy table — verify with the county assessor before closing.
Climate risk First Street
- Flood 7/10 Severe FEMA zone X (unshaded) · 96% chance over 30 yrs
- Wildfire 1/10 Low
- Heat 5/10 Major 7 d/yr ≥98°F today · 16 d/yr by 30 yrs out
- Wind 6/10 Major 27% chance of damaging wind over 30 yrs
- Air quality 4/10 Moderate 3 unhealthy d/yr today · 5 by 30 yrs out
Nearby sold comps map
Loading sold comps map…
Walkable amenities ~0.75 mi
Loading nearby amenities…
Taxation est. · year 1
- Rental income
- $85,845
- − Mortgage interest
- −$52,599
- − Property taxes
- −$14,966
- − Insurance
- −$5,362
- − Repairs & maintenance
- −$6,868
- − Management
- −$6,868
- − Depreciation
- −$27,316
- Taxable loss
- −$28,132
- Est. tax savings @ 24.0%
- +$6,752
- After-tax cash flow
- $-4,848/yr
For passive investors: Depreciation is non-cash, so a rental often shows a tax loss while cash-flowing — sheltering income. Rental losses are passive: they offset passive income freely, and up to $25,000/yr can offset ordinary (W-2) income if you actively participate and your MAGI is under $100k (phasing out to $0 by $150k); unused losses carry forward. On sale, claimed depreciation is recaptured at up to 25%, and gains may owe capital-gains tax (a 1031 exchange can defer both). Figures are a year-1 estimate at your 24.0% rate — not tax advice; consult a CPA.
Schools (NCES district)
- District
- New Rochelle City School District
- NCES district ID
- 3620490
- Math proficiency
- 63% ▲ 3.00%
- Reading proficiency
- 66% ▲ 9.00%
- Median HH income
- $69,165
- Composite
- 56.63/100
- National rank
- #1139
- State rank
- #171 of 590 in NY
Livability — New Rochelle
- Score
- 69/100
- State rank
- #487
- US rank
- #8572
Category grades
Schools grade is shown separately in the Schools card above.
Census & demographics
- Census place
- New Rochelle, NY
- City population
- 63,657
- Population (ZIP)
- 15,228
Population outlook (Westchester County) Hauer SSP2
- Today (2025)
- 1,028,035 people
- By 2030
- 1,051,636 · +2.3%
- By 2040
- 1,098,520 · +6.9%
- By 2050
- 1,136,044 · +10.5%
- By 2075
- 1,196,925 · +16.4%
- By 2100
- 1,175,147 · +14.3%
Race, ethnicity, and origin ACS 2023
- Neighborhood character
- Predominantly White (73%)
- Race & ethnicity
- White 73% Black 11% Hispanic / Latino 10% Two or more races 5% Asian 3%
- Hispanic origin (detail)
- Mexican 1% Puerto Rican 2% Dominican 2%
- Common ancestry
- Scotch-Irish 4% Romanian 3% Italian 2%
- Foreign-born
- 15% · Canada, Dominican Republic, Jamaica
- Languages at home
- 80% English-only · Spanish 6% Russian/Polish/Slavic 3% Other Indo-European 3%
Political lean MEDSL · Westchester
- 2024 margin
- Strong D (+26.3) · D 63.1% · R 36.9%
- 2008→2024 swing
- -1.3pp toward R · 2008: 27.6pp · 2024: 26.3pp
- All cycles
- 2024: D+26.3 2020: D+36.3 2016: D+32.8 2012: D+22.2 2008: D+27.6
Not yet ingested
- Civics
- —
Market trends
- HPI YoY
- ▼ -819.58%
- Current HPI
- 280.9571
- Rent YoY
- —
- Metro
- —
- State GDP YoY
- ▲ 2.60%
- F500 in state
- 92
Industry mix (Fortune 500 HQ in NY)
| Industry | F500 HQs | Revenue |
|---|---|---|
| Financial Services | 10 | $950B |
|
||
| Consumer Goods | 9 | $162B |
|
||
| Insurance | 4 | $225B |
|
||
| Telecommunications | 2 | $144B |
|
||
| Pharmaceuticals | 2 | $112B |
|
||
| Media / Entertainment | 2 | $69B |
|
||
Price history
+340.8% since first listed4 events — show timeline
- 2026-05-08 Pending — OneKey® MLS as Distributed by MLS Grid
- 2026-05-01 Listed $939,000 OneKey® MLS as Distributed by MLS Grid
- 2026-04-29 Coming Soon $939,000 OneKey® MLS as Distributed by MLS Grid
- 1996-11-08 Sold (Public Records) $213,000 Public Records
Property tax history
-5.1%/yrLatest (2025): $14,966 · -17.3% YoY. Source: county tax records.
Cash-flow waterfall
monthlySold comps — $/sqft
last 12 mo · ≤1 miLoading sold comps…