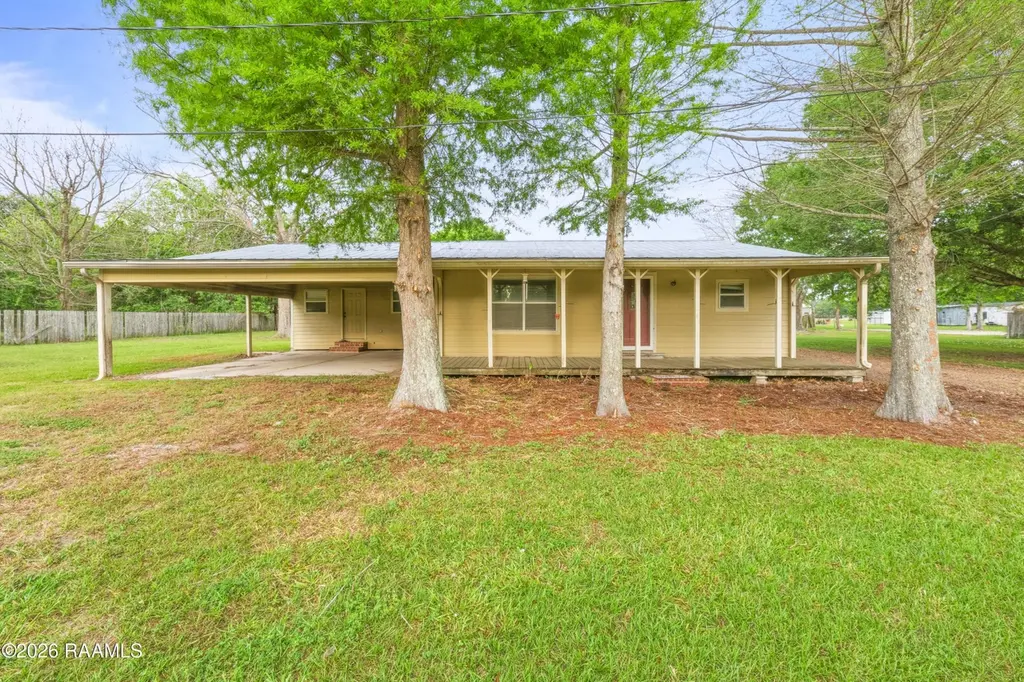
132 Canary Ln · Scott, LA
Flood risk 5/10 · Moderate
- FEMA flood zone
- X (unshaded)
- Chance of flooding over 30 yrs
- 0.3%
- Est. flood insurance / yr
- $507 – $1,088
Fire risk 1/10 · Minimal
- Est. fire insurance / yr
- $1,269 – $2,357
Heat risk 8/10 · Major
- Hot days now (above 109°F)
- 7 days/yr
- Hot days in 30 yrs
- 20 days/yr
Wind risk 9/10 · Severe
- Chance of severe wind over 30 yrs
- 99.0%
Air-quality risk 1/10 · Minimal
- Unhealthy air days now
- 0 days/yr
- Unhealthy air days in 30 yrs
- 0 days/yr
Risk factors via First Street. Map © Google.
Why this score? — see what drove the D grade
The composite is a weighted blend of 9 inputs, each scored 0–100. Each bar is that input's sub-score; the figure is the points it added to the 100-point composite (weight × sub-score).
- ARV discount +15.0/15.0
- Cash flow +9.8/30.0
- Schools +3.6/10.0
- Livability +3.3/5.0
- DSCR +2.8/10.0
- Rent growth +2.5/5.0
- Condition / age +2.5/5.0
- 1% rule +2.2/10.0
- Appreciation +0.0/10.0
$110,000
🖨 Deal sheet 📄 Offer letter ✓ Due diligence
Listing remarks MLS
Investor Opportunity in Duson!Located at 132 Canary Lane in Duson, this property is full of potential and ready for the right investoror handy buyer to bring it back to life. While the home does need some TLC, it offers a solid opportunityto add value through updates and improvements. With the right vision, this could be a great flip, rental,or long-term investment. Convenient location and plenty of upside make this one worth a look for anyoneseeking their next project.
Key facts
- 0.85 acre lot
- 2 parking spots
- Built 1975
Neighborhood map
What this means for you Summary
Snapshot
- This is a 2-bed/1.5-bath single-family listed at $110k.
Deal economics
- At list price, monthly cash flow is $-71 ($-854/yr) — negative.
- To cash-flow at today's rent, offer at most $97k (11.4% below list).
- To meet the 1% rule (rent ≥ 1% of price), the offer needs to be $79k (28.4% below list).
- Recommended offer: $79k (28.4% below list) — sets the bar for 1% rule.
Location & tenants
- Location reads 66/100 on livability (#116 in LA) — a middle-class / working-renter tenant base. Strengths: cost of living A+, health & safety A+, schools B+; Watch: crime F, amenities F, commute F.
- Lafayette Parish (urban): math 38% / reading 46% proficiency, ranked #19 of 98 in LA (top 19%) — families likely to look elsewhere, expect single-tenant / working-renter base with shorter leases.
- Market conditions: 196 active listings in the ZIP; 10 comparable units currently listed for rent nearby; rentals at typical pace (median 21d on market — plan ~3-4 weeks tenant-placement turnaround); 40% of comp listings sitting > 30 days — soft ceiling on asking rent; 1,585 units permitted in Lafayette Parish in 2024 (10 in 5+ unit buildings).
Forward outlook
- Local home prices are declining (-3.0%/yr); year-one equity from $761 of loan paydown is wiped out by about $3k of value loss. Plan a longer hold.
- Lafayette County population projected at +34% by 2050 — long-run rental-demand tailwind backs the buy-and-hold thesis.
Negotiation context
- It's been on market 128 days — a 12% lower offer ($97k) is reasonable based on typical stale-listing flexibility.
- 2 sale attempts since 14y ago; this cycle's ask has dropped $8k (6%) from the opening price — seller is motivated, your offer sets the floor, not the list.
- Current owner paid $95k; 16% above their basis — modest negotiation headroom, anchor on the comps not their cost.
Risks & watch-outs
- Climate carrying-cost: moderate flood risk; severe wind risk, 99% chance of damaging wind over 30y; extreme-heat days projected 7→20/yr by 2055 (HVAC capex compounding) — expect insurance premiums to compound above CPI over the hold.
Questions for the listing agent
- What do current leases actually rent for vs. the listed asking? Can we see a recent rent roll and the last 12 months of T-12 income?
- It's been on market 128 days. Have you received any prior offers? Is the seller open to a 28% concession, seller financing, or rate buy-down credit?
- Built in 1975 — when were the roof, HVAC, electrical panel, plumbing, and water heater last replaced?
- Why hasn't it sold? Are there any deal-killer items the seller is aware of (foundation, flood, title, zoning, code violations)?
- Is there a deadline driving the sale (1031 exchange, divorce, estate, relocation)? That informs how much negotiation room exists.
- Schools are B-rated — typically a magnet for longer-tenancy family renters. What's the average tenant stay here, and is there a school-zone premium baked into asking?
- Crime grade is F in this area — have there been break-ins, vandalism, or insurance claims at this property in the last 3 years? What carrier currently insures it and at what premium?
- The area grade is low — what's the realistic commute time and amenity access for the typical tenant pool here? Any planned neighborhood developments (good or bad) we should know about?
- What's the average days-on-market for RENTAL listings here right now (not sales)? A rising rental-DOM trend means longer vacancies and softer asking-rent achievability than the comps imply.
- What's the recent tenant-quality profile in this submarket — average credit score on applications, eviction rate, late-payment / NSF rate, and stable-employment percentage? A property-management company in the area should have these aggregated.
- How much new for-sale + rental construction is in the pipeline within 1–3 miles? Heavy new supply typically softens prices + rents 12–24 months out; constrained supply supports both.
Investment metrics
- 1% rule
- 0.72% ✗
- Cap rate
- 5.52%
- Cash-on-cash
- -2.77%
- DSCR
- 0.88
- GRM
- 11.6
CMA / ARV
- ARV (median comp)
- $167,532
- List price
- $110,000
- Delta
- -34.34%
- Verdict
- UNDERPRICED
- Comps
- 20 within 1.0 mi
Show comp detail 1 sale within ~0.75 mi
| Address | Dist | Beds/Ba | Sqft | Sold | Price | $/sf | Match |
|---|---|---|---|---|---|---|---|
| 107 Dairyman Ln | 0.46mi | 3/1.0 (+1) | 1,260 (-2%) | 2mo | $159,900 | $127 | 67 |
Match score weights: distance 35% · size 25% · config 20% · recency 20%. Top-matched comps best support the ARV.
Projected returns pro-forma
-3.0% appreciation · 3.0% rent growth · sell at horizon
- IRR
- -21.0%
- Equity multiple
- 0.27×
- Total profit
- $-22,389
- Equity at exit
- $16,401
- IRR
- -14.4%
- Equity multiple
- 0.17×
- Total profit
- $-25,454
- Equity at exit
- $9,511
Cash invested: $30,800 (down + closing). Projections, not guarantees.
Landlord ↔ Tenant lean methodology
- Overall (STATE)
- 90 Strongly Landlord-Friendly
- State Louisiana
- 90 Strongly Landlord-Friendly · R+12
- County
- — inherits STATE
- City
- — inherits STATE
ZIP-level market 70529
- Home prices YoY
- -11.1%
- Active inventory
- 196
- Price-to-rent
- 11.6×
Monthly cashflow live
- Estimated rent
- $787 high interval (Pro) →
- Mortgage (P&I)
- −$577
- Tax from tax record
- −$70 /mo · $845/yr
- Insurance
- −$46
- HOA
- −$0
- Vacancy / Maint / Mgmt
- −$165
- Net cashflow
- $-71
Break-even live
UW: 25.0% down · 7.5% · 30yr · 1.5% tax · 5.0% vac · 8.0% maint · 8.0% mgmt
Financing live
Cash to close
- Down payment
- $27,500
- Closing costs
- $3,300
- Reserves months
- —
- Total cash needed
- —
Loan-product check · same deal, 3 products live
Conventional
25% down · 7.5% · 30yr
- Down + closing
- —
- Monthly P&I
- —
- Monthly cashflow
- —
- DSCR
- —
- Eligible?
- —
Personal DTI + credit; lowest rate.
DSCR
20% down · 8.5% · 30yr
- Down + closing
- —
- Monthly P&I
- —
- Monthly cashflow
- —
- DSCR
- —
- Eligible?
- —
No personal income docs; deal must DSCR.
Hard money
10% down · 12.0% · 12mo
- Down + closing
- —
- Monthly P&I
- —
- Monthly cashflow
- —
- DSCR
- —
- Eligible?
- —
Short-term bridge; refi at stabilization.
Rent comps 10 comps
| Address | Beds | Baths | Sqft | Rent | $/sqft | DOM | Units | Dist |
|---|---|---|---|---|---|---|---|---|
| 101 Limoges St Unit C Duson, LA | 2.0 | 2.0 | 900 | $600 | $0.67 | 21d | 1 | 0.16mi |
| 101 Limoges St Unit B Duson, LA | 2.0 | 2.0 | 900 | $600 | $0.67 | 43d | 1 | 0.16mi |
| 102 Meudon St Unit C Duson, LA | 2.0 | 2.0 | 1000 | $725 | $0.72 | 43d | 1 | 0.17mi |
| 106 Limoges St Unit B Duson, LA | 2.0 | 2.0 | 950 | $700 | $0.74 | 13d | 1 | 0.19mi |
| 607 Marigny Cir Unit C Duson, LA | 2.0 | 2.0 | 1000 | $750 | $0.75 | 21d | 1 | 0.29mi |
| 5000 W Congress St Unit 2D Lafayette, LA | 2.0 | 1.0 | 900 | $925 | $1.03 | 43d | 1 | 0.70mi |
| 5000 W Congress St Unit 7A Lafayette, LA | 2.0 | 1.0 | 900 | $925 | $1.03 | 21d | 1 | 0.70mi |
| 5000 W Congress St Unit 6A Lafayette, LA | 2.0 | 1.0 | 900 | $925 | $1.03 | 13d | 1 | 0.71mi |
| 401 Pinto St Lafayette, LA | 3.0 | 2.0 | 1601 | $2,300 | $1.44 | 43d | 1 | 0.91mi |
| 118 Millie Park Lafayette, LA | 3.0 | 2.0 | 1200 | $1,750 | $1.46 | 21d | 1 | 1.35mi |
Listing history 21 events
-
2026-06-18days on market $110,000 Active 128 DOM
-
2026-06-17days on market $110,000 Active 127 DOM
-
2026-06-16pricedays on market $110,000 Active 126 DOM
-
2026-06-15days on market $112,500 Active 125 DOM
-
2026-06-14days on market $112,500 Active 123 DOM
-
2026-06-13days on market $112,500 Active 122 DOM
-
2026-06-10days on market $112,500 Active 120 DOM
-
2026-06-09days on market $112,500 Active 119 DOM
-
2026-06-08days on market $112,500 Active 118 DOM
-
2026-06-07days on market $112,500 Active 117 DOM
-
2026-06-05days on market $112,500 Active 114 DOM
-
2026-06-03days on market $112,500 Active 113 DOM
-
2026-06-02days on market $112,500 Active 112 DOM
-
2026-06-01days on market $112,500 Active 111 DOM
-
2026-05-31days on market $112,500 Active 110 DOM
-
2026-05-30days on market $112,500 Active 109 DOM
-
2026-04-09price $112,500 474-char remark
Show marketing remark (474 chars)
Investor Opportunity in Duson!Located at 132 Canary Lane in Duson, this property is full of potential and ready for the right investoror handy buyer to bring it back to life. While the home does need some TLC, it offers a solid opportunityto add value through updates and improvements. With the right vision, this could be a great flip, rental,or long-term investment. Convenient location and plenty of upside make this one worth a look for anyoneseeking their next project.
-
2026-02-10$117,500 Active 474-char remark
Show marketing remark (474 chars)
Investor Opportunity in Duson!Located at 132 Canary Lane in Duson, this property is full of potential and ready for the right investoror handy buyer to bring it back to life. While the home does need some TLC, it offers a solid opportunityto add value through updates and improvements. With the right vision, this could be a great flip, rental,or long-term investment. Convenient location and plenty of upside make this one worth a look for anyoneseeking their next project.
-
2012-12-05soldstatus $95,000 226-char remark
Show marketing remark (226 chars)
Cute cottage with large front porch to enjoy! Enter into open kitchen/dining and living area. Gorgeous wood floors! Great open kitchen with lots of cabinets. A must see! Move right in without dusting a shelf!! Shows very well!
-
2012-12-05soldstatus $95,000
Show marketing remark (226 chars)
Cute cottage with large front porch to enjoy! Enter into open kitchen/dining and living area. Gorgeous wood floors! Great open kitchen with lots of cabinets. A must see! Move right in without dusting a shelf!! Shows very well!
-
2012-10-04$104,500 226-char remark
Show marketing remark (226 chars)
Cute cottage with large front porch to enjoy! Enter into open kitchen/dining and living area. Gorgeous wood floors! Great open kitchen with lots of cabinets. A must see! Move right in without dusting a shelf!! Shows very well!
ⓘ Source: listings_history table (triggers on properties + properties_extension) + one-shot
backfill from property_details.listing_events for pre-trigger history.
Tax reassessment forecast LA · Resets to sale price
- Current annual tax
- $845 · $70/mo
- Projected year-2 tax
- $845 · $70/mo
- Expected delta
- $0/yr ($0/mo · 0.0%)
ⓘ Screening estimate from a state-policy table — verify with the county assessor before closing.
Climate risk First Street
- Flood 5/10 Major FEMA zone X (unshaded) · 30% chance over 30 yrs
- Wildfire 1/10 Low
- Heat 8/10 Severe 7 d/yr ≥109°F today · 20 d/yr by 30 yrs out
- Wind 9/10 Extreme 99% chance of damaging wind over 30 yrs
- Air quality 1/10 Low 0 unhealthy d/yr today · 0 by 30 yrs out
Nearby sold comps map
Loading sold comps map…
Walkable amenities ~0.75 mi
Loading nearby amenities…
Taxation est. · year 1
- Rental income
- $9,447
- − Mortgage interest
- −$6,162
- − Property taxes
- −$845
- − Insurance
- −$550
- − Repairs & maintenance
- −$756
- − Management
- −$756
- − Depreciation
- −$3,200
- Taxable loss
- −$2,822
- Est. tax savings @ 24.0%
- +$677
- After-tax cash flow
- $-177/yr
For passive investors: Depreciation is non-cash, so a rental often shows a tax loss while cash-flowing — sheltering income. Rental losses are passive: they offset passive income freely, and up to $25,000/yr can offset ordinary (W-2) income if you actively participate and your MAGI is under $100k (phasing out to $0 by $150k); unused losses carry forward. On sale, claimed depreciation is recaptured at up to 25%, and gains may owe capital-gains tax (a 1031 exchange can defer both). Figures are a year-1 estimate at your 24.0% rate — not tax advice; consult a CPA.
Schools (NCES district)
- District
- Lafayette Parish
- NCES district ID
- 2200870
- Math proficiency
- 38% ▼ -32.00%
- Reading proficiency
- 46% ▼ -24.00%
- Median HH income
- $50,238
- Composite
- 36.15/100
- National rank
- #4741
- State rank
- #19 of 98 in LA
Livability — Scott
- Score
- 66/100
- State rank
- #116
- US rank
- #11265
Category grades
Schools grade is shown separately in the Schools card above.
Census & demographics
- City population
- 8,670
- Population (ZIP)
- 13,557
Population outlook (Lafayette County) Hauer SSP2
- Today (2025)
- 280,930 people
- By 2030
- 301,092 · +7.2%
- By 2040
- 339,456 · +20.8%
- By 2050
- 375,156 · +33.5%
- By 2075
- 451,672 · +60.8%
- By 2100
- 497,203 · +77.0%
Race, ethnicity, and origin ACS 2023
- Neighborhood character
- Diverse neighborhood (Simpson 0.55)
- Race & ethnicity
- White 62% Black 25% Hispanic / Latino 6% Two or more races 6%
- Hispanic origin (detail)
- Common ancestry
- Lithuanian 16% English 1% Iranian 1%
- Foreign-born
- 6% · Canada
- Languages at home
- 90% English-only · Spanish 5% French/Haitian/Cajun 4%
Political lean MEDSL · Lafayette
- 2024 margin
- Solid R (+31.4) · D 33.5% · R 64.8% · Other 1.7%
- 2008→2024 swing
- -0.1pp no change · 2008: -31.3pp · 2024: -31.4pp
- All cycles
- 2024: R+31.4 2020: R+28.7 2016: R+33.6 2012: R+33.7 2008: R+31.3
Not yet ingested
- Civics
- —
Market trends
- HPI YoY
- ▼ -23.96%
- Current HPI
- 192.2639
- Rent YoY
- —
- Metro
- —
- State GDP YoY
- ▲ 3.29%
- F500 in state
- 10
Industry mix (Fortune 500 HQ in LA)
| Industry | F500 HQs | Revenue |
|---|---|---|
| Telecommunications | 2 | $23B |
|
||
| Utilities | 1 | $12B |
|
||
| Wholesale / Distribution | 1 | $5B |
|
||
| Advertising | 1 | $2B |
|
||
Price history
+7.7% since first listed5 events — show timeline
- 2026-04-09 Price Changed $112,500 AcadianaMLS
- 2026-02-10 Listed $117,500 AcadianaMLS
- 2012-12-05 Sold (Public Records) $95,000 Public Records
- 2012-12-05 Sold (MLS) $95,000 AcadianaMLS
- 2012-10-04 Listed $104,500 AcadianaMLS
Property tax history
+3.8%/yrLatest (2025): $845 · -1.3% YoY. Source: county tax records.
Cash-flow waterfall
monthlySold comps — $/sqft
last 12 mo · ≤1 miLoading sold comps…