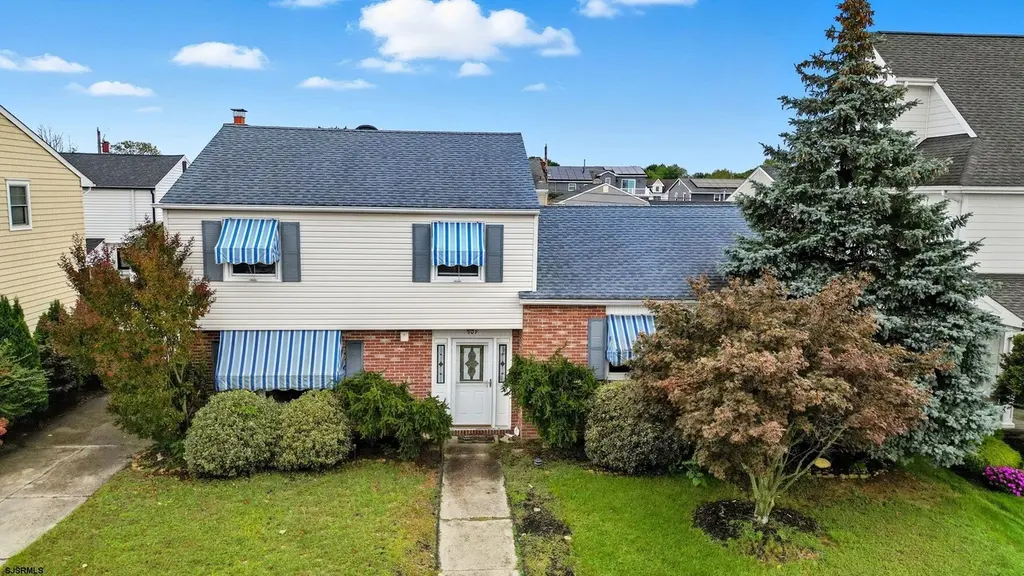
507 N Douglas Ave · Margate City, NJ
Flood risk 8/10 · Major
- FEMA flood zone
- AE
- Chance of flooding over 30 yrs
- 0.97%
- Est. flood insurance / yr
- $1,737 – $8,500
Fire risk 1/10 · Minimal
- Est. fire insurance / yr
- $526 – $976
Heat risk 9/10 · Severe
- Hot days now (above 95°F)
- 7 days/yr
- Hot days in 30 yrs
- 16 days/yr
Wind risk 8/10 · Major
- Chance of severe wind over 30 yrs
- 80.0%
Air-quality risk 2/10 · Minimal
- Unhealthy air days now
- 1 days/yr
- Unhealthy air days in 30 yrs
- 2 days/yr
Risk factors via First Street. Map © Google.
Why this score? — see what drove the B+ grade
The composite is a weighted blend of 9 inputs, each scored 0–100. Each bar is that input's sub-score; the figure is the points it added to the 100-point composite (weight × sub-score).
- Cash flow +30.0/30.0
- ARV discount +13.4/15.0
- 1% rule +10.0/10.0
- DSCR +10.0/10.0
- Schools +4.8/10.0
- Rent growth +4.7/5.0
- Livability +3.8/5.0
- Condition / age +2.5/5.0
- Appreciation +0.0/10.0
$859,000
🖨 Deal sheet 📄 Offer letter ✓ Due diligence
Listing remarks MLS
After 30 years it’s time to present this opportunity for a new owner to spruce up this nice split level home on a sizable 60’ x 67’ lot in the Parkshore neighborhood in Margate. This 1834sf home comprises 4 bedrooms and 2.5 baths with a fenced yard. Great potential for expansion or start over by building a new home on this 4020sf lot. Beautiful homes surrounding this property and situated conveniently to Margate Tighe & Ross Schools and around the corner from the soccer & lacrosse field. This property is a “Shore Bet”!
Key facts
- Fenced yard
- Split level home
- Sizable lot
Tags
Property features AI
Finance
- Other: Lead-based paint disclosure document on file
Exterior
- Parking: Two exterior parking spaces; No garage
- Utilities: Public water; Public sewer
- Home design: For sale; Age: 25+ years
- Construction: Brick and vinyl siding
- Exterior features: Brick and vinyl exterior; Concrete driveway; Lot dimensions approximately 60 x 67.25; Lot frontage 60'; Zoned S-40; Property less than 1 acre; Located outside waterfront; Property in a floodplain
Interior
- Kitchen: Electric stove; Microwave; Refrigerator; Self-cleaning oven
- Bedrooms: Three bedrooms on the upper level; One bedroom on the main level
- Bathrooms: Two full bathrooms (upper level); One half bathroom (main level)
- Heating & cooling: Electric heating; Wall air-conditioning units
- Interior features: Fireplace in family room; Den/TV room; Dining room; Eat-in kitchen; Recreation/Family room; 12 total rooms; Powder room on main level
- Laundry & utility: Utility room on main level
Neighborhood map
What this means for you Summary
Snapshot
- This is a 4-bed/2.5-bath single-family listed at $859k.
Deal economics
- At list price, monthly cash flow is $4k ($53k/yr) — positive.
- The deal already cash-flows at list — no discount required.
- Meets the 1% rule at list price ($13k rent vs $859k).
- Cap rate 13.1% vs local median 7.4% in Margate City — top-decile yield for the area; either an underpriced asset or a hidden risk that comps aren't pricing in. Stress-test before assuming the spread holds.
Location & tenants
- Location reads 75/100 on livability (#149 in NJ, #3,893 nationally) — a middle-class / working-renter tenant base. Strengths: schools A+, crime A+, employment A+; Watch: amenities F, commute F, cost of living F.
- Margate City School District (suburban): math 50% / reading 58% proficiency, ranked #113 of 472 in NJ (top 24%) — acceptable for families but not a draw, mixed tenant base, ~2y average lease; only 8% free/reduced lunch — higher-income household profile.
- Market conditions: Rents rising fast (+8.9%/yr); 147 active listings in the ZIP; 19 comparable units currently listed for rent nearby; rentals at typical pace (median 22d on market — plan ~3-4 weeks tenant-placement turnaround); 47% of comp listings sitting > 30 days — soft ceiling on asking rent; high-income renter base; 672 units permitted in Atlantic County in 2024 (258 in 5+ unit buildings).
- At $12,996/mo this rent would consume 128% of the median local household income ($122k/yr) (locally 23% of renters already pay >50% of income on rent) — very limited rent-growth headroom before tenants either downsize or default.
Forward outlook
- Local home prices are declining (-3.0%/yr); year-one equity from $6k of loan paydown is wiped out by about $26k of value loss. Plan a longer hold.
- Atlantic County population projected at -12% by 2050 — secular population decline; favor cash flow + early exit over multi-decade hold.
- At projected returns (-3.0% appreciation + 8.0% rent growth), your $241k cash investment doubles in ~5 years — after that, you're playing with house money.
Negotiation context
- Only 14 days on market — expect competitive offers; lowballing is unlikely to land.
- 8 sale attempts since 11y ago with the ask held roughly flat each time — persistent listings suggest the price (not the market) is what's stuck; bring a comps-based counter.
- Current owner paid $147k; list at $859k implies a 484% gain — meaningful room to come down on a strong offer.
Risks & watch-outs
- Watch-outs: flood insurance adds $427/mo.
- Climate carrying-cost: in FEMA flood zone AE (mandatory federal flood insurance); severe wind risk, 80% chance of damaging wind over 30y; extreme-heat days projected 7→16/yr by 2055 (HVAC capex compounding) — expect insurance premiums to compound above CPI over the hold.
Questions for the listing agent
- Built in 1966 — when were the roof, HVAC, electrical panel, plumbing, and water heater last replaced?
- What's the actual annual flood-insurance premium (NFIP or private), and is the property in a SFHA with mandatory coverage?
- Is there a deadline driving the sale (1031 exchange, divorce, estate, relocation)? That informs how much negotiation room exists.
- Schools are A-rated — typically a magnet for longer-tenancy family renters. What's the average tenant stay here, and is there a school-zone premium baked into asking?
- What's the average days-on-market for RENTAL listings here right now (not sales)? A rising rental-DOM trend means longer vacancies and softer asking-rent achievability than the comps imply.
- What's the recent tenant-quality profile in this submarket — average credit score on applications, eviction rate, late-payment / NSF rate, and stable-employment percentage? A property-management company in the area should have these aggregated.
- How much new for-sale + rental construction is in the pipeline within 1–3 miles? Heavy new supply typically softens prices + rents 12–24 months out; constrained supply supports both.
Investment metrics
- 1% rule
- 1.51% ✓
- Cap rate
- 13.11%
- Cash-on-cash
- 24.34%
- DSCR
- 2.08
- GRM
- 5.5
CMA / ARV
- ARV (on-the-fly)
- $987,768
- Comps found
- 12
Show comp detail 12 sales within ~0.75 mi
| Address | Dist | Beds/Ba | Sqft | Sold | Price | $/sf | Match |
|---|---|---|---|---|---|---|---|
| 505 N Delavan Ave | 0.04mi | 3/2.5 (-1) | 1,738 (-5%) | 9mo | $800,000 | $460 | 77 |
| 7510 Fremont Ave | 0.27mi | 3/2.5 (-1) | 1,803 (-2%) | 4mo | $750,000 | $416 | 76 |
| 209 N Fredericksburg Ave | 0.54mi | 3/2.5 (-1) | 1,864 (+2%) | 1mo | $775,000 | $416 | 66 |
| 202 N Fredericksburg Ave | 0.44mi | 4/3.0 | 1,800 (-2%) | 10mo | $1,299,999 | $722 | 66 |
| 39 N Douglas Ave | 0.51mi | 4/2.5 | 1,832 (-0%) | 14mo | $1,250,000 | $682 | 64 |
| 414 N Clermont Ave | 0.15mi | 4/3.0 | 2,076 (+13%) | 9mo | $760,000 | $366 | 62 |
| 614 N Delavan Ave | 0.13mi | 3/2.5 (-1) | 2,084 (+14%) | 6mo | $810,000 | $389 | 61 |
| 123 N Clermont Ave Ave | 0.40mi | 3/2.5 (-1) | 1,700 (-7%) | 4mo | $915,000 | $538 | 61 |
| 109 N Douglas Ave | 0.44mi | 4/3.5 | 2,000 (+9%) | 10mo | $1,375,000 | $688 | 52 |
| 2 S Barclay Ave | 0.69mi | 3/2.5 (-1) | 1,742 (-5%) | 9mo | $1,455,000 | $835 | 47 |
| 7 N Swarthmore Ave | 0.73mi | 4/3.0 | 2,046 (+11%) | 9mo | $1,300,000 | $635 | 37 |
| 400 Berkshire Dr | 0.54mi | 3/2.5 (-1) | 1,576 (-14%) | 12mo | $425,000 | $270 | 36 |
Match score weights: distance 35% · size 25% · config 20% · recency 20%. Top-matched comps best support the ARV.
Projected returns pro-forma
-3.0% appreciation · 8.0% rent growth · sell at horizon
- IRR
- 20.5%
- Equity multiple
- 1.89×
- Total profit
- $213,173
- Equity at exit
- $128,080
- IRR
- 31.8%
- Equity multiple
- 4.59×
- Total profit
- $863,848
- Equity at exit
- $74,271
Cash invested: $240,520 (down + closing). Projections, not guarantees.
Landlord ↔ Tenant lean methodology
- Overall (STATE)
- 21 Tenant-Leaning
- State New Jersey
- 21 Tenant-Leaning · D+6
- County
- — inherits STATE
- City
- — inherits STATE
ZIP-level market 08402
- Rents YoY
- 8.9%
- Active inventory
- 147
- Price-to-rent
- 5.5×
Monthly cashflow live
- Estimated rent
- $12,996 medium interval (Pro) →
- Mortgage (P&I)
- −$4,505
- Tax from tax record
- −$525 /mo · $6,303/yr
- Insurance
- −$358
- Flood insurance flood zone
- −$427 /mo · $5,118/yr
- HOA
- −$0
- Vacancy / Maint / Mgmt
- −$2,729
- Net cashflow
- $4,452
Break-even live
UW: 25.0% down · 7.5% · 30yr · 1.5% tax · 5.0% vac · 8.0% maint · 8.0% mgmt
Financing live
Cash to close
- Down payment
- $214,750
- Closing costs
- $25,770
- Reserves months
- —
- Total cash needed
- —
Loan-product check · same deal, 3 products live
Conventional
25% down · 7.5% · 30yr
- Down + closing
- —
- Monthly P&I
- —
- Monthly cashflow
- —
- DSCR
- —
- Eligible?
- —
Personal DTI + credit; lowest rate.
DSCR
20% down · 8.5% · 30yr
- Down + closing
- —
- Monthly P&I
- —
- Monthly cashflow
- —
- DSCR
- —
- Eligible?
- —
No personal income docs; deal must DSCR.
Hard money
10% down · 12.0% · 12mo
- Down + closing
- —
- Monthly P&I
- —
- Monthly cashflow
- —
- DSCR
- —
- Eligible?
- —
Short-term bridge; refi at stabilization.
Rent comps 19 comps
| Address | Beds | Baths | Sqft | Rent | $/sqft | DOM | Units | Dist |
|---|---|---|---|---|---|---|---|---|
| 307 N Essex Ave Margate City, NJ | 4.0 | 2.0 | 1561 | $1,800 | $1.15 | 44d | 1 | 0.26mi |
| 200 N Essex Ave Margate City, NJ | 4.0 | 3.0 | 1570 | $15,000 | $9.55 | 44d | 1 | 0.39mi |
| 8208 Lagoon Dr Margate City, NJ | 4.0 | 2.5 | 2480 | $18,000 | $7.26 | 13d | 1 | 0.40mi |
| 107 N Douglas Ave Unit AUGUST Margate City, NJ | 5.0 | 3.5 | 2312 | $33,000 | $14.27 | 21d | 1 | 0.45mi |
| 119 N Belmont Ave Unit June 2026 Margate City, NJ | 4.0 | 2.5 | 2044 | $10,000 | $4.89 | 13d | 1 | 0.46mi |
| 107 N Douglas Ave Margate City, NJ | 5.0 | 3.5 | 2312 | $36,000 | $15.57 | 44d | 1 | 0.46mi |
| 2 N Frontenac Ave Margate City, NJ | 3.0 | 2.5 | 1850 | $17,000 | $9.19 | 21d | 1 | 0.65mi |
| 8606 Monmouth Ave Unit August 9/13 Margate City, NJ | 4.0 | 3.5 | 2430 | $20,000 | $8.23 | 44d | 1 | 0.74mi |
| 7701 Atlantic Ave Margate City, NJ | 1.0–3.0 | 2.0–3.0 | 1660 | $75,000 | $45.18 | 44d | 4 | 0.76mi |
| 6 N Melbourne Ave Ventnor City, NJ | 4.0 | 3.5 | 2028 | $3,000 | $1.48 | 44d | 1 | 0.77mi |
| 7103 Ventnor Ave Ventnor City, NJ | 4.0 | 3.0 | 2288 | $5,500 | $2.40 | 13d | 1 | 0.82mi |
| 106 S Essex Ave Margate City, NJ | 5.0 | 3.0 | 2034 | $9,500 | $4.67 | 21d | 1 | 0.82mi |
| 109 N Wissahickon Ave Unit B Ventnor City, NJ | 4.0 | 3.5 | 2000 | $25,000 | $12.50 | 21d | 1 | 0.86mi |
| 204 N Union Ave Margate City, NJ | 5.0 | 4.0 | 2393 | $5,000 | $2.09 | 44d | 1 | 0.97mi |
| 7 S Richards Ave Ventnor City, NJ | 4.0 | 2.0 | 1600 | $25,000 | $15.62 | 13d | 1 | 1.01mi |
| 9406 Amherst Ave Margate City, NJ | 4.0 | 4.0 | 2554 | $47,000 | $18.40 | 21d | 1 | 1.23mi |
| 406 N Dorset Ave Ventnor City, NJ | 4.0 | 1.5 | 1568 | $13,000 | $8.29 | 13d | 1 | 1.27mi |
| 16 S Decatur Ave Unit 9/15-10/31 Margate City, NJ | 4.0 | 3.0 | 1732 | $7,000 | $4.04 | 44d | 1 | 1.27mi |
| 201 N Coolidge Ave Unit A1 Margate City, NJ | 3.0 | 2.0 | 1258 | $35,000 | $27.82 | 44d | 1 | 1.43mi |
Listing history 12 events
-
2026-06-19days on market $859,000 Active 14 DOM
-
2026-06-18days on market $859,000 Active 13 DOM
-
2026-06-17days on market $859,000 Active 12 DOM
-
2026-06-16days on market $859,000 Active 11 DOM
-
2026-06-15days on market $859,000 Active 10 DOM
-
2026-06-14days on market $859,000 Active 8 DOM
-
2026-06-13days on market $859,000 Active 7 DOM
-
2026-06-10days on market $859,000 Active 5 DOM
-
2026-06-09days on market $859,000 Active 4 DOM
-
2026-06-08days on market $859,000 Active 3 DOM
-
2026-06-07remarks 528-char remark
-
2026-06-07$859,000 Active 2 DOM
ⓘ Source: listings_history table (triggers on properties + properties_extension) + one-shot
backfill from property_details.listing_events for pre-trigger history.
Tax reassessment forecast NJ · Partial reset (capped growth)
- Current annual tax
- $6,303 · $525/mo
- Projected year-2 tax
- $13,846 · $1,154/mo
- Expected delta
- +$7,543/yr (+$629/mo · 119.7%)
ⓘ Screening estimate from a state-policy table — verify with the county assessor before closing.
Climate risk First Street
- Flood 8/10 Severe FEMA zone AE · 97% chance over 30 yrs
- Wildfire 1/10 Low
- Heat 9/10 Extreme 7 d/yr ≥95°F today · 16 d/yr by 30 yrs out
- Wind 8/10 Severe 80% chance of damaging wind over 30 yrs
- Air quality 2/10 Low 1 unhealthy d/yr today · 2 by 30 yrs out
Nearby sold comps map
Loading sold comps map…
Walkable amenities ~0.75 mi
Loading nearby amenities…
Taxation est. · year 1
- Rental income
- $155,949
- − Mortgage interest
- −$48,117
- − Property taxes
- −$6,303
- − Insurance
- −$9,414
- − Repairs & maintenance
- −$12,476
- − Management
- −$12,476
- − Depreciation
- −$24,989
- Taxable income
- $42,175
- Est. tax owed @ 24.0%
- −$10,122
- After-tax cash flow
- $43,305/yr
For passive investors: Depreciation is non-cash, so a rental often shows a tax loss while cash-flowing — sheltering income. Rental losses are passive: they offset passive income freely, and up to $25,000/yr can offset ordinary (W-2) income if you actively participate and your MAGI is under $100k (phasing out to $0 by $150k); unused losses carry forward. On sale, claimed depreciation is recaptured at up to 25%, and gains may owe capital-gains tax (a 1031 exchange can defer both). Figures are a year-1 estimate at your 24.0% rate — not tax advice; consult a CPA.
Schools (NCES district)
- District
- Margate City School District
- NCES district ID
- 3409690
- Math proficiency
- 50% ▼ -26.00%
- Reading proficiency
- 58% ▼ -28.00%
- Median HH income
- $67,112
- Composite
- 47.71/100
- National rank
- #2241
- State rank
- #113 of 472 in NJ
Livability — Margate City
- Score
- 75/100
- State rank
- #149
- US rank
- #3893
Category grades
Schools grade is shown separately in the Schools card above.
Census & demographics
- Census place
- Margate City, NJ
- County
- Atlantic County · 143,611 people
- City population
- 5,234
- Metro
- Atlantic City-Hammonton, NJ
- Population (ZIP)
- 5,234
- Household income
- $121,800
- Rent vs Own
- Severe rent burden
- 23.0
Population outlook (Atlantic County) Hauer SSP2
- Today (2025)
- 268,948 people
- By 2030
- 264,497 · -1.7%
- By 2040
- 252,261 · -6.2%
- By 2050
- 237,846 · -11.6%
- By 2075
- 210,650 · -21.7%
- By 2100
- 180,234 · -33.0%
Race, ethnicity, and origin ACS 2023
- Neighborhood character
- Predominantly White (94%)
- Race & ethnicity
- White 94% Two or more races 3% Asian 2% Hispanic / Latino 2%
- Common ancestry
- Scotch-Irish 9% Romanian 6% Lithuanian 2%
- Foreign-born
- 5% · Canada, Jamaica
- Languages at home
- 92% English-only · Other Indo-European 2% Tagalog/Filipino 2% Spanish 1%
Political lean MEDSL · Atlantic
- 2024 margin
- Toss-up / Even · D 47.7% · R 50.7% · Other 1.6%
- 2008→2024 swing
- -18.1pp toward R · 2008: 15.1pp · 2024: -3.0pp
- All cycles
- 2024: R+3.0 2020: D+6.7 2016: D+6.2 2012: D+17.2 2008: D+15.1
Not yet ingested
- Civics
- —
Market trends
- HPI YoY
- ▼ -625.70%
- Current HPI
- 475.1366
- Rent YoY
- ▲ 8.91%
- Metro
- Atlantic City-Hammonton, NJ
- State GDP YoY
- ▲ 2.05%
- F500 in state
- 34
Industry mix (Fortune 500 HQ in NJ)
| Industry | F500 HQs | Revenue |
|---|---|---|
| Consumer Goods | 3 | $31B |
|
||
| Pharmaceuticals | 2 | $153B |
|
||
| Technology | 2 | $21B |
|
||
| Insurance | 2 | $20B |
|
||
| Healthcare | 2 | $19B |
|
||
| Financial Services | 1 | $70B |
|
||
Price history
+1154.0% since first listed23 events — show timeline
- 2026-06-05 Listed $859,000 SJSRMLS
- 2025-12-01 Listing Removed — SJSRMLS
- 2025-09-18 Listed $885,000 SJSRMLS
- 2025-06-26 Listing Removed — SJSRMLS
- 2025-06-11 Price Changed $984,000 SJSRMLS
- 2025-04-16 Price Changed $985,000 SJSRMLS
- 2025-03-17 Price Changed $995,000 SJSRMLS
- 2025-02-13 Listed $1,050,000 SJSRMLS
- 2023-02-21 Listing Removed — SJSRMLS
- 2023-02-21 Listed $649,000 SJSRMLS
- 2019-01-01 Listing Removed — SJSRMLS
- 2018-06-09 Price Changed $369,000 SJSRMLS
- 2018-05-09 Price Changed $360,000 SJSRMLS
- 2017-12-17 Listed $369,900 SJSRMLS
- 2017-11-08 Listing Removed — SJSRMLS
- 2017-05-09 Listed $389,000 SJSRMLS
- 2017-05-05 Listing Removed — SJSRMLS
- 2016-11-07 Listed $399,000 SJSRMLS
- 2016-03-31 Listing Removed — SJSRMLS
- 2015-09-09 Listed $425,000 SJSRMLS
- 1995-07-21 Sold (Public Records) $147,000 Public Records
- 1985-08-04 Sold (Public Records) $118,000 Public Records
- 1978-08-01 Sold (Public Records) $68,500 Public Records
Property tax history
+1.6%/yrLatest (2025): $6,303 · +4.6% YoY. Source: county tax records.
Cash-flow waterfall
monthlySold comps — $/sqft
last 12 mo · ≤1 miLoading sold comps…