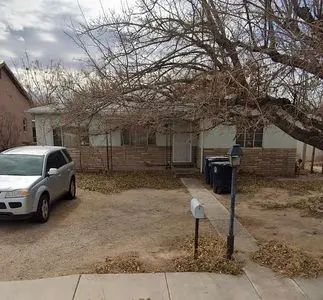
330 Cutler Ave NE · Albuquerque, NM
Flood risk 1/10 · Minimal
- FEMA flood zone
- X (unshaded)
- Chance of flooding over 30 yrs
- 0.0%
- Est. flood insurance / yr
- $507 – $1,088
Fire risk 1/10 · Minimal
- Est. fire insurance / yr
- $706 – $1,312
Heat risk 5/10 · Moderate
- Hot days now (above 95°F)
- 7 days/yr
- Hot days in 30 yrs
- 18 days/yr
Wind risk 1/10 · Minimal
- Chance of severe wind over 30 yrs
- —
Air-quality risk 2/10 · Minimal
- Unhealthy air days now
- 1 days/yr
- Unhealthy air days in 30 yrs
- 3 days/yr
Risk factors via First Street. Map © Google.
Why this score? — see what drove the B grade
The composite is a weighted blend of 9 inputs, each scored 0–100. Each bar is that input's sub-score; the figure is the points it added to the 100-point composite (weight × sub-score).
- Cash flow +25.8/30.0
- ARV discount +15.0/15.0
- DSCR +8.6/10.0
- 1% rule +6.5/10.0
- Schools +5.3/10.0
- Rent growth +3.7/5.0
- Livability +3.6/5.0
- Condition / age +2.5/5.0
- Appreciation +0.0/10.0
$180,000
🖨 Deal sheet 📄 Offer letter ✓ Due diligence
Listing remarks
This spacious 1,820 sq ft home features 4 bedrooms and 2 bathrooms, offering great potential in a convenient central Albuquerque location. All utilities are on and working, and the roof is in good shape. Sold & acirc; & euro; & oelig; as is & acirc; & euro; � Perfect for buyers ready to add their own updates or investors looking for strong upside. Priced well below recent comparable sales in the area (many similar homes selling $250k & acirc; & euro; & ldquo; $350k+), this is an excellent opportunity for sweat equity in a central spot near downtown, Old Town, and major routes.
Key facts
- Built 1956
- Listed 9 days
Property features AI
Exterior
- Home design: Built in 1956
- Exterior features: Living area approximately 1,820 (listed)
Interior
- Interior features: Located in the Santa Barbara–Martineztown neighborhood
Neighborhood map
What this means for you Summary
Snapshot
- This is a 4-bed/2.0-bath single-family listed at $180k.
Deal economics
- At list price, monthly cash flow is $438 ($5k/yr) — positive.
- The deal already cash-flows at list — no discount required.
- Meets the 1% rule at list price ($2k rent vs $180k).
- Cap rate 9.2% vs local median 3.7% in Albuquerque — top-decile yield for the area; either an underpriced asset or a hidden risk that comps aren't pricing in. Stress-test before assuming the spread holds.
Location & tenants
- Location reads 72/100 on livability (#13 in NM) — a middle-class / working-renter tenant base. Strengths: amenities A+, commute A+, cost of living A+; Watch: schools D-, crime F.
- Albuquerque Public Schools (urban): math 51% / reading 75% proficiency, ranked #3 of 29 in NM (top 10%) — acceptable for families but not a draw, mixed tenant base, ~2y average lease; 60% free/reduced lunch — lower-income household profile, screen leases tightly.
- Market conditions: Rents rising fast (+4.9%/yr); 143 active listings in the ZIP; 10 comparable units currently listed for rent nearby; rentals at typical pace (median 24d on market — plan ~3-4 weeks tenant-placement turnaround); 40% of comp listings sitting > 30 days — soft ceiling on asking rent; lower-income renter base — watch delinquency; 1,316 units permitted in Bernalillo County in 2024 (546 in 5+ unit buildings).
- At $2,071/mo this rent would consume 58% of the median local household income ($43k/yr) (locally 1721% of renters already pay >50% of income on rent) — very limited rent-growth headroom before tenants either downsize or default.
Forward outlook
- Local home prices are declining (-3.0%/yr); year-one equity from $1k of loan paydown is wiped out by about $5k of value loss. Plan a longer hold.
- At projected returns (-3.0% appreciation + 4.9% rent growth), your $50k cash investment doubles in ~9 years — after that, you're playing with house money.
Negotiation context
- Only 9 days on market — expect competitive offers; lowballing is unlikely to land.
Risks & watch-outs
- Watch-outs: built in 1956 — expect roof / HVAC / electrical / plumbing capex.
- Climate carrying-cost: extreme-heat days projected 7→18/yr by 2055 (HVAC capex compounding) — expect insurance premiums to compound above CPI over the hold.
Questions for the listing agent
- Built in 1956 — when were the roof, HVAC, electrical panel, plumbing, and water heater last replaced?
- Is there a deadline driving the sale (1031 exchange, divorce, estate, relocation)? That informs how much negotiation room exists.
- Schools are D-rated, which usually means shorter tenancies and higher turnover. Who's the typical renter profile here, and what's been the actual vacancy rate?
- Crime grade is F in this area — have there been break-ins, vandalism, or insurance claims at this property in the last 3 years? What carrier currently insures it and at what premium?
- What's the average days-on-market for RENTAL listings here right now (not sales)? A rising rental-DOM trend means longer vacancies and softer asking-rent achievability than the comps imply.
- What's the recent tenant-quality profile in this submarket — average credit score on applications, eviction rate, late-payment / NSF rate, and stable-employment percentage? A property-management company in the area should have these aggregated.
- How much new for-sale + rental construction is in the pipeline within 1–3 miles? Heavy new supply typically softens prices + rents 12–24 months out; constrained supply supports both.
Investment metrics
- 1% rule
- 1.15% ✓
- Cap rate
- 9.21%
- Cash-on-cash
- 10.43%
- DSCR
- 1.46
- GRM
- 7.2
CMA / ARV
- ARV (on-the-fly)
- $345,800
- Comps found
- 4
Show comp detail 4 sales within ~0.75 mi
| Address | Dist | Beds/Ba | Sqft | Sold | Price | $/sf | Match |
|---|---|---|---|---|---|---|---|
| 308 Prospect Ave NE | 0.07mi | 4/2.0 | 1,702 (-6%) | 6mo | $329,900 | $194 | 81 |
| 348 Cutler Ave NE | 0.05mi | 3/1.5 (-1) | 2,016 (+11%) | 1mo | $318,500 | $158 | 72 |
| 330 Arvada Ave NE | 0.06mi | 4/1.0 | 1,575 (-14%) | 16mo | $237,500 | $151 | 57 |
| 401 Gomez Ave NE | 0.49mi | 3/2.0 (-1) | 1,576 (-13%) | 2mo | $300,000 | $190 | 48 |
Match score weights: distance 35% · size 25% · config 20% · recency 20%. Top-matched comps best support the ARV.
Projected returns pro-forma
-3.0% appreciation · 4.92% rent growth · sell at horizon
- IRR
- 1.4%
- Equity multiple
- 1.06×
- Total profit
- $2,819
- Equity at exit
- $26,839
- IRR
- 12.8%
- Equity multiple
- 2.11×
- Total profit
- $55,803
- Equity at exit
- $15,563
Cash invested: $50,400 (down + closing). Projections, not guarantees.
Landlord ↔ Tenant lean methodology
- Overall (STATE)
- 55 Moderately Landlord-Leaning
- State New Mexico
- 55 Moderately Landlord-Leaning · D+3
- County
- — inherits STATE
- City
- — inherits STATE
ZIP-level market 87102
- Rents YoY
- 4.9%
- Active inventory
- 143
- Price-to-rent
- 7.2×
Monthly cashflow live
- Estimated rent
- $2,071 high interval (Pro) →
- Mortgage (P&I)
- −$944
- Tax from tax record
- −$179 /mo · $2,150/yr
- Insurance
- −$75
- HOA
- −$0
- Vacancy / Maint / Mgmt
- −$435
- Net cashflow
- $438
Break-even live
UW: 25.0% down · 7.5% · 30yr · 1.5% tax · 5.0% vac · 8.0% maint · 8.0% mgmt
Financing live
Cash to close
- Down payment
- $45,000
- Closing costs
- $5,400
- Reserves months
- —
- Total cash needed
- —
Loan-product check · same deal, 3 products live
Conventional
25% down · 7.5% · 30yr
- Down + closing
- —
- Monthly P&I
- —
- Monthly cashflow
- —
- DSCR
- —
- Eligible?
- —
Personal DTI + credit; lowest rate.
DSCR
20% down · 8.5% · 30yr
- Down + closing
- —
- Monthly P&I
- —
- Monthly cashflow
- —
- DSCR
- —
- Eligible?
- —
No personal income docs; deal must DSCR.
Hard money
10% down · 12.0% · 12mo
- Down + closing
- —
- Monthly P&I
- —
- Monthly cashflow
- —
- DSCR
- —
- Eligible?
- —
Short-term bridge; refi at stabilization.
Rent comps 10 comps
| Address | Beds | Baths | Sqft | Rent | $/sqft | DOM | Units | Dist |
|---|---|---|---|---|---|---|---|---|
| 2406 Broadway Blvd NE Apt A Albuquerque, NM | 3.0 | 3.0 | 1800 | $2,150 | $1.19 | 3d | 1 | 0.13mi |
| 506 Phoenix Ave NW Albuquerque, NM | 3.0 | 2.5 | 1780 | $2,300 | $1.29 | 23d | 1 | 0.72mi |
| 326 Mountain Rd NE Albuquerque, NM | 5.0 | 2.0 | 2013 | $2,900 | $1.44 | 43d | 1 | 0.90mi |
| 609 Candelaria Rd NW Albuquerque, NM | 3.0 | 2.0 | 1475 | $1,800 | $1.22 | 43d | 1 | 1.09mi |
| 1020 6th St NW Albuquerque, NM | 3.0 | 2.5 | 1895 | $2,000 | $1.06 | 14d | 1 | 1.12mi |
| 1020 6th St NW Albuquerque, NM | 3.0 | 2.5 | 1895 | $2,000 | $1.06 | 3d | 1 | 1.12mi |
| 1006 Alta Monte Ave NW Albuquerque, NM | 3.0 | 2.0 | 1632 | $2,400 | $1.47 | 43d | 1 | 1.35mi |
| 1700 Violetas Rd NW Albuquerque, NM | 3.0 | 2.5 | 1426 | $1,695 | $1.19 | 18d | 1 | 1.39mi |
| 1911 Girard Blvd NE Albuquerque, NM | 3.0 | 2.0 | 1600 | $2,400 | $1.50 | 23d | 1 | 1.40mi |
| 1321 Lobo Pl NE Albuquerque, NM | 3.0 | 2.0 | 1724 | $2,250 | $1.31 | 44d | 1 | 1.46mi |
Listing history 7 events
-
2026-06-18days on market $180,000 Active 9 DOM
-
2026-06-17days on market $180,000 Active 8 DOM
-
2026-06-16days on market $180,000 Active 7 DOM
-
2026-06-15days on market $180,000 Active 6 DOM
-
2026-06-13days on market $180,000 Active 4 DOM
-
2026-06-10remarks 585-char remark
-
2026-06-10$180,000 Active 1 DOM
ⓘ Source: listings_history table (triggers on properties + properties_extension) + one-shot
backfill from property_details.listing_events for pre-trigger history.
Tax reassessment forecast NM · Resets to sale price
- Current annual tax
- $2,150 · $179/mo
- Projected year-2 tax
- $2,150 · $179/mo
- Expected delta
- $0/yr ($0/mo · 0.0%)
ⓘ Screening estimate from a state-policy table — verify with the county assessor before closing.
Climate risk First Street
- Flood 1/10 Low FEMA zone X (unshaded) · 0% chance over 30 yrs
- Wildfire 1/10 Low
- Heat 5/10 Major 7 d/yr ≥95°F today · 18 d/yr by 30 yrs out
- Wind 1/10 Low
- Air quality 2/10 Low 1 unhealthy d/yr today · 3 by 30 yrs out
Nearby sold comps map
Loading sold comps map…
Walkable amenities ~0.75 mi
Loading nearby amenities…
Taxation est. · year 1
- Rental income
- $24,855
- − Mortgage interest
- −$10,083
- − Property taxes
- −$2,150
- − Insurance
- −$900
- − Repairs & maintenance
- −$1,988
- − Management
- −$1,988
- − Depreciation
- −$5,236
- Taxable income
- $2,509
- Est. tax owed @ 24.0%
- −$602
- After-tax cash flow
- $4,656/yr
For passive investors: Depreciation is non-cash, so a rental often shows a tax loss while cash-flowing — sheltering income. Rental losses are passive: they offset passive income freely, and up to $25,000/yr can offset ordinary (W-2) income if you actively participate and your MAGI is under $100k (phasing out to $0 by $150k); unused losses carry forward. On sale, claimed depreciation is recaptured at up to 25%, and gains may owe capital-gains tax (a 1031 exchange can defer both). Figures are a year-1 estimate at your 24.0% rate — not tax advice; consult a CPA.
Schools (NCES district)
- District
- Albuquerque Public Schools
- NCES district ID
- 3500060
- Math proficiency
- 51% ▲ 30.00%
- Reading proficiency
- 75% ▲ 45.00%
- Median HH income
- $48,151
- Composite
- 53.29/100
- National rank
- #1487
- State rank
- #3 of 29 in NM
Livability — Albuquerque
- Score
- 72/100
- State rank
- #13
- US rank
- #6219
Category grades
Schools grade is shown separately in the Schools card above.
Census & demographics
- Census place
- Albuquerque, NM
- County
- Bernalillo County · 647,165 people
- City population
- 647,165
- Metro
- Albuquerque, NM
- Population (ZIP)
- 20,123
- Household income
- $42,990
- Rent vs Own
- Severe rent burden
- 1721.0
Population outlook (Bernalillo County) Hauer SSP2
- Today (2025)
- 704,528 people
- By 2030
- 711,723 · +1.0%
- By 2040
- 714,522 · +1.4%
- By 2050
- 709,274 · +0.7%
- By 2075
- 680,015 · -3.5%
- By 2100
- 619,879 · -12.0%
Race, ethnicity, and origin ACS 2023
- Neighborhood character
- Diverse neighborhood (Simpson 0.59)
- Race & ethnicity
- Hispanic / Latino 57% Two or more races 30% White 29% Native American 6% Black 4%
- Hispanic origin (detail)
- Mexican 35% Puerto Rican 1%
- Common ancestry
- Lithuanian 2% Slovak 1% Serbian 1%
- Foreign-born
- 12% · Canada
- Languages at home
- 64% English-only · Spanish 30% Korean 1% Other Indo-European 1%
Political lean MEDSL · Bernalillo
- 2024 margin
- Strong D (+21.0) · D 59.2% · R 38.2% · Other 2.6%
- 2008→2024 swing
- -0.3pp no change · 2008: 21.4pp · 2024: 21.0pp
- All cycles
- 2024: D+21.0 2020: D+24.4 2016: D+17.8 2012: D+16.2 2008: D+21.4
Not yet ingested
- Civics
- —
Market trends
- HPI YoY
- ▼ -208.71%
- Current HPI
- 253.8398
- Rent YoY
- ▲ 4.92%
- Metro
- Albuquerque, NM
- State GDP YoY
- —
- F500 in state
- 0
Price history
1 event — show timeline
- 2026-06-10 Listed $180,000 FSBO.com
Property tax history
+3.5%/yrLatest (2025): $2,150 · +3.3% YoY. Source: county tax records.
Cash-flow waterfall
monthlySold comps — $/sqft
last 12 mo · ≤1 miLoading sold comps…