24244 W County Road 74e · Red Feather Lakes, CO
Flood risk 1/10 · Minimal
- FEMA flood zone
- X (unshaded)
- Chance of flooding over 30 yrs
- 0.0%
- Est. flood insurance / yr
- $473 – $860
Fire risk 7/10 · Major
- Est. fire insurance / yr
- $939 – $1,743
Heat risk 1/10 · Minimal
- Hot days now (above 81°F)
- 7 days/yr
- Hot days in 30 yrs
- 19 days/yr
Wind risk 1/10 · Minimal
- Chance of severe wind over 30 yrs
- —
Air-quality risk 10/10 · Severe
- Unhealthy air days now
- 23 days/yr
- Unhealthy air days in 30 yrs
- 26 days/yr
Risk factors via First Street. Map © Google.
Why this score? — see what drove the D- grade
The composite is a weighted blend of 9 inputs, each scored 0–100. Each bar is that input's sub-score; the figure is the points it added to the 100-point composite (weight × sub-score).
- Cash flow +9.8/30.0
- ARV discount +7.5/15.0
- Appreciation +4.7/10.0
- Schools +4.5/10.0
- DSCR +2.8/10.0
- Livability +2.8/5.0
- Rent growth +2.5/5.0
- Condition / age +2.5/5.0
- 1% rule +2.1/10.0
$395,000
🖨 Deal sheet (PDF) 📄 Offer letter ✓ Due diligence
Listing remarks
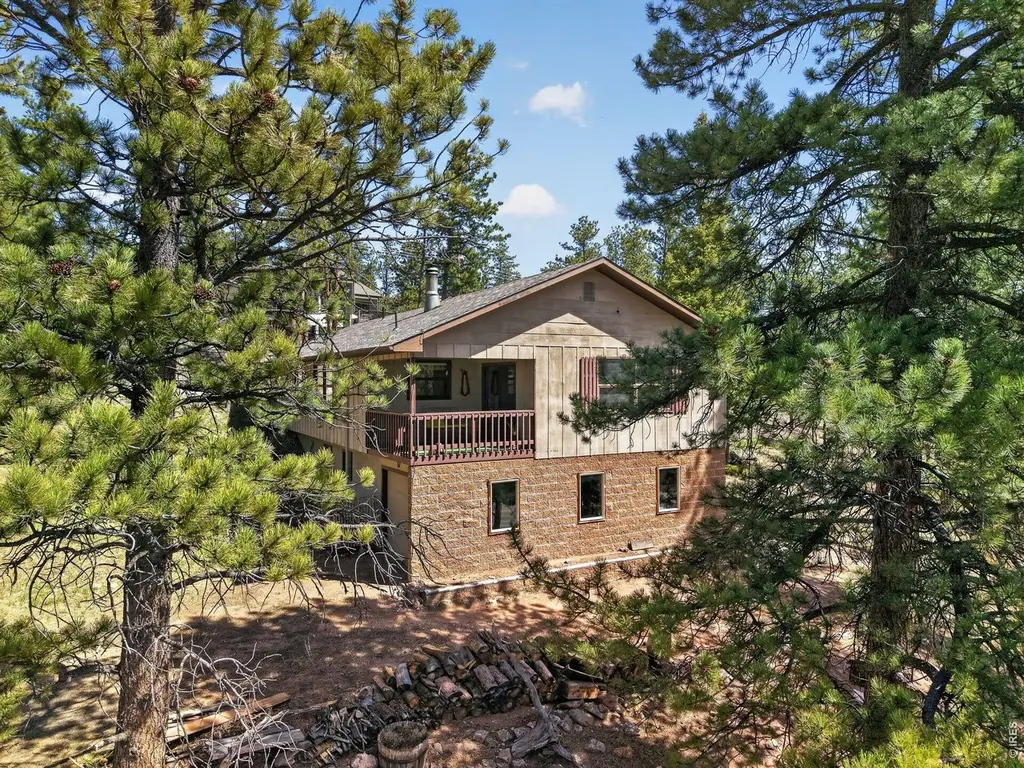
Great opportunity in Red Feather Lakes, CO. This home is located in the Piney Knolls community in Red Feather Lakes. 2 beds, 2baths, great space in the living room, dining and kitchen areas with plenty of windows to enjoy the sun with the southern exposure. Bedrooms have great closet space, primary bedroom offers 3/4 private bath. Walkout basement offers two rooms finished plus the mechanical room with the laundry and water system. 1 car attached garage for small vehicle or store the toys. Great view from deck. Paved road access. Needs some updating has good bones including newer roof. Close to national forest trails to enjoy hiking, riding ATV and 4-wheeler access. Call for your private sh
Key facts
- Walkout basement
- Paved road access
- 0.62 acre lot
Tags
Property features AI
Finance
- HOA & community: No association fees or transfer fees
Exterior
- Parking: Attached garage with garage door opener (1 car)
- Utilities: Well water; Septic tank; Electricity available; Propane; Wood/coal heating option; Satellite available; High-speed internet available; Trash service: Canyon Utilities
- Home design: Raised ranch style; Residential single-family home; Not new construction; Zoned O-open
- Construction: Frame construction; Composition roof; Full basement, partially finished with walk-out access; Below-grade finished area present
- Exterior features: Evergreen trees on the lot; Unincorporated area; County-maintained road frontage; Minimal flood risk or C rating
Interior
- Kitchen: Electric range; Refrigerator
- Bedrooms: 2 bedrooms (all conforming)
- Bathrooms: 1 full bath; 1 three-quarter bath
- Heating & cooling: Heat pump; Baseboard heating; Wood stove
- Interior features: Open floorplan; Pantry; Window coverings
- Laundry & utility: Washer; Dryer
Neighborhood map
What this means for you Summary
Snapshot
- This is a 2-bed/2.0-bath single-family listed at $395k.
Deal economics
- At list price, monthly cash flow is $-255 ($-3k/yr) — negative.
- To cash-flow at today's rent, offer at most $350k (11.4% below list).
- To meet the 1% rule (rent ≥ 1% of price), the offer needs to be $281k (28.9% below list).
- Recommended offer: $281k (28.9% below list) — sets the bar for 1% rule.
- Cap rate 5.5% vs local median 4.2% in Red Feather Lakes — top-decile yield for the area; either an underpriced asset or a hidden risk that comps aren't pricing in. Stress-test before assuming the spread holds.
Location & tenants
- Location reads 55/100 on livability (#344 in CO) — a working-class tenant base; expect higher turnover. Strengths: employment B+, housing B+; Watch: cost of living C-, crime D-, amenities F.
- Poudre School District R-1 (urban): math 45% / reading 60% proficiency, ranked #10 of 86 in CO (top 12%) — acceptable for families but not a draw, mixed tenant base, ~2y average lease.
- Zoned schools: Traut Core Elementary School (math 67% / reading 77%, grade A-, #26 of 966 statewide, top 4%, 502 students, 12% FRL); Kinard Core Knowledge Middle School (math 61% / reading 77%, grade A, #8 of 270 statewide, top 3%, 748 students, 7% FRL); Poudre High School (math 36% / reading 59%, grade D, #131 of 381 statewide, top 34%, 1,663 students, 38% FRL) — zoned schools at 19% FRL track the district average.
- Market conditions: 155 active listings in the ZIP; 1,786 units permitted in Larimer County in 2024 (402 in 5+ unit buildings).
Forward outlook
- In year one you build about $532 of equity ($3k loan paydown + $-2k appreciation (-0.6% local appreciation)).
- Larimer County population projected at +51% by 2050 — long-run rental-demand tailwind backs the buy-and-hold thesis.
Negotiation context
- It's been on market 58 days — a 3% lower offer ($383k) is reasonable based on typical stale-listing flexibility.
- Current owner paid $157k; list at $395k implies a 152% gain — meaningful room to come down on a strong offer.
Risks & watch-outs
- Climate carrying-cost: major wildfire risk — expect insurance premiums to compound above CPI over the hold.
Questions for the listing agent
- What do current leases actually rent for vs. the listed asking? Can we see a recent rent roll and the last 12 months of T-12 income?
- It's been on market 58 days. Have you received any prior offers? Is the seller open to a 29% concession, seller financing, or rate buy-down credit?
- Built in 1976 — when were the roof, HVAC, electrical panel, plumbing, and water heater last replaced?
- Is there a deadline driving the sale (1031 exchange, divorce, estate, relocation)? That informs how much negotiation room exists.
- Crime grade is D in this area — have there been break-ins, vandalism, or insurance claims at this property in the last 3 years? What carrier currently insures it and at what premium?
- The area grade is low — what's the realistic commute time and amenity access for the typical tenant pool here? Any planned neighborhood developments (good or bad) we should know about?
- What's the average days-on-market for RENTAL listings here right now (not sales)? A rising rental-DOM trend means longer vacancies and softer asking-rent achievability than the comps imply.
- What's the recent tenant-quality profile in this submarket — average credit score on applications, eviction rate, late-payment / NSF rate, and stable-employment percentage? A property-management company in the area should have these aggregated.
- How much new for-sale + rental construction is in the pipeline within 1–3 miles? Heavy new supply typically softens prices + rents 12–24 months out; constrained supply supports both.
Investment metrics
- 1% rule
- 0.71% ✗
- Cap rate
- 5.52%
- Cash-on-cash
- -2.76%
- DSCR
- 0.88
- GRM
- 11.7
CMA / ARV
No comps found within radius.
Projected returns pro-forma
-0.56% appreciation · 3.0% rent growth · sell at horizon
- IRR
- -7.7%
- Equity multiple
- 0.66×
- Total profit
- $-38,110
- Equity at exit
- $103,821
- IRR
- -1.3%
- Equity multiple
- 0.87×
- Total profit
- $-13,980
- Equity at exit
- $116,419
Cash invested: $110,600 (down + closing). Projections, not guarantees.
Landlord ↔ Tenant lean methodology
- Overall (STATE)
- 38 Tenant-Leaning
- State Colorado
- 38 Tenant-Leaning · D+4
- County
- — inherits STATE
- City
- — inherits STATE
ZIP-level market 80545
- Home prices YoY
- -0.2%
- Active inventory
- 155
- Price-to-rent
- 11.7×
Monthly cashflow live
- Estimated rent
- $2,807 medium interval (Pro) →
- Mortgage (P&I)
- −$2,071
- Tax from tax record
- −$236 /mo · $2,834/yr
- Insurance
- −$165
- HOA
- −$0
- Vacancy / Maint / Mgmt
- −$589
- Net cashflow
- $-255
Break-even live
Sensitivity live
| Price | -10% $-31 | -5% $-143 | +0% $-255 | +5% $-366 | +10% $-478 |
|---|---|---|---|---|---|
| Rent | -10% $-476 | -5% $-365 | +0% $-255 | +5% $-144 | +10% $-33 |
| Rate | -1.0pp $-56 | -0.5pp $-154 | base $-255 | +0.5pp $-357 | +1.0pp $-461 |
UW: 25.0% down · 7.5% · 30yr · 1.5% tax · 5.0% vac · 8.0% maint · 8.0% mgmt
Financing live
Cash to close
- Down payment
- $98,750
- Closing costs
- $11,850
- Reserves months
- —
- Total cash needed
- —
Loan-product check · same deal, 3 products live
Conventional
25% down · 7.5% · 30yr
- Down + closing
- —
- Monthly P&I
- —
- Monthly cashflow
- —
- DSCR
- —
- Eligible?
- —
Personal DTI + credit; lowest rate.
DSCR
20% down · 8.5% · 30yr
- Down + closing
- —
- Monthly P&I
- —
- Monthly cashflow
- —
- DSCR
- —
- Eligible?
- —
No personal income docs; deal must DSCR.
Hard money
10% down · 12.0% · 12mo
- Down + closing
- —
- Monthly P&I
- —
- Monthly cashflow
- —
- DSCR
- —
- Eligible?
- —
Short-term bridge; refi at stabilization.
Listing history 18 events
-
2026-06-21days on market $395,000 Active 58 DOM
-
2026-06-18days on market $395,000 Active 55 DOM
-
2026-06-17days on market $395,000 Active 54 DOM
-
2026-06-16days on market $395,000 Active 53 DOM
-
2026-06-15days on market $395,000 Active 52 DOM
-
2026-06-14days on market $395,000 Active 50 DOM
-
2026-06-10days on market $395,000 Active 47 DOM
-
2026-06-09days on market $395,000 Active 46 DOM
-
2026-06-08days on market $395,000 Active 45 DOM
-
2026-06-07days on market $395,000 Active 44 DOM
-
2026-06-03days on market $395,000 Active 40 DOM
-
2026-06-02days on market $395,000 Active 39 DOM
-
2026-06-01days on market $395,000 Active 38 DOM
-
2026-05-31days on market $395,000 Active 37 DOM
-
2026-05-30days on market $395,000 Active 36 DOM
-
2026-04-24$395,000 Active
-
2003-04-29soldstatus $157,000
-
1988-11-01soldstatus $57,500
ⓘ Source: listings_history table (triggers on properties + properties_extension) + one-shot
backfill from property_details.listing_events for pre-trigger history.
Tax reassessment forecast CO · Resets to sale price
- Current annual tax
- $2,834 · $236/mo
- Projected year-2 tax
- $2,834 · $236/mo
- Expected delta
- $0/yr ($0/mo · 0.0%)
ⓘ Screening estimate from a state-policy table — verify with the county assessor before closing.
Climate risk First Street
- Flood 1/10 Low FEMA zone X (unshaded) · 0% chance over 30 yrs
- Wildfire 7/10 Severe
- Heat 1/10 Low 7 d/yr ≥81°F today · 19 d/yr by 30 yrs out
- Wind 1/10 Low
- Air quality 10/10 Extreme 23 unhealthy d/yr today · 26 by 30 yrs out
Nearby sold comps map
Loading sold comps map…
Walkable amenities ~0.75 mi
Loading nearby amenities…
Taxation est. · year 1
- Rental income
- $33,684
- − Mortgage interest
- −$22,126
- − Property taxes
- −$2,834
- − Insurance
- −$1,975
- − Repairs & maintenance
- −$2,695
- − Management
- −$2,695
- − Depreciation
- −$11,491
- Taxable loss
- −$10,131
- Est. tax savings @ 24.0%
- +$2,431
- After-tax cash flow
- $-624/yr
For passive investors: Depreciation is non-cash, so a rental often shows a tax loss while cash-flowing — sheltering income. Rental losses are passive: they offset passive income freely, and up to $25,000/yr can offset ordinary (W-2) income if you actively participate and your MAGI is under $100k (phasing out to $0 by $150k); unused losses carry forward. On sale, claimed depreciation is recaptured at up to 25%, and gains may owe capital-gains tax (a 1031 exchange can defer both). Figures are a year-1 estimate at your 24.0% rate — not tax advice; consult a CPA.
Schools (NCES district)
- District
- Poudre School District R-1
- NCES district ID
- 0803990
- Math proficiency
- 45% ▼ -7.00%
- Reading proficiency
- 60% ▼ -2.00%
- Median HH income
- $57,281
- Composite
- 45.5/100
- National rank
- #2610
- State rank
- #10 of 86 in CO
Livability — Red Feather Lakes
- Score
- 55/100
- State rank
- #344
- US rank
- #23247
Category grades
Schools grade is shown separately in the Schools card above.
Census & demographics
- Census place
- Red Feather Lakes, CO
- Population (ZIP)
- 913
Population outlook (Larimer County) Hauer SSP2
- Today (2025)
- 415,361 people
- By 2030
- 457,762 · +10.2%
- By 2040
- 542,310 · +30.6%
- By 2050
- 627,048 · +51.0%
- By 2075
- 833,722 · +100.7%
- By 2100
- 952,590 · +129.3%
Race, ethnicity, and origin ACS 2023
- Neighborhood character
- Predominantly White (97%)
- Race & ethnicity
- White 97% Hispanic / Latino 3%
- Common ancestry
- Portuguese 3% Italian 2% Slovak 1%
- Languages at home
- 98% English-only · Spanish 2%
Political lean MEDSL · Larimer
- 2024 margin
- D (+17.6) · D 57.4% · R 39.8% · Other 2.9%
- 2008→2024 swing
- +7.9pp toward D · 2008: 9.7pp · 2024: 17.6pp
- All cycles
- 2024: D+17.6 2020: D+15.4 2016: D+4.9 2012: D+5.2 2008: D+9.7
Not yet ingested
- Civics
- —
Market trends
- HPI YoY
- ▼ -0.56%
- Current HPI
- 280.4591
- Rent YoY
- —
- Metro
- —
- State GDP YoY
- ▲ 1.95%
- F500 in state
- 14
Industry mix (Fortune 500 HQ in CO)
| Industry | F500 HQs | Revenue |
|---|---|---|
| Technology Distribution | 1 | $31B |
|
||
| Food / Agriculture | 1 | $18B |
|
||
| Packaging | 1 | $14B |
|
||
| Healthcare | 1 | $13B |
|
||
| Energy | 1 | $10B |
|
||
| Technology | 1 | $4B |
|
||
Price history
+587.0% since first listed3 events — show timeline
- 2026-04-24 Listed $395,000 IRES
- 2003-04-29 Sold (Public Records) $157,000 Public Records
- 1988-11-01 Sold (Public Records) $57,500 Public Records
Property tax history
+6.0%/yrLatest (2025): $2,834 · +5.4% YoY. Source: county tax records.
Cash-flow waterfall
monthlySold comps — $/sqft
last 12 mo · ≤1 miLoading sold comps…