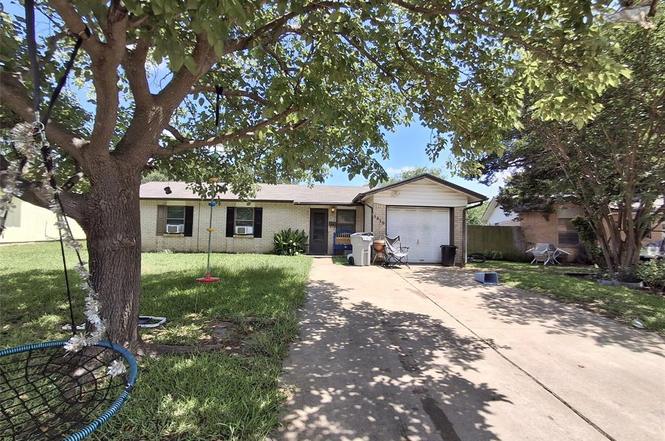
1510 Carson Dr · Mesquite, TX
Flood risk 1/10 · Minimal
- FEMA flood zone
- X (unshaded)
- Chance of flooding over 30 yrs
- 0.0%
- Est. flood insurance / yr
- $507 – $1,088
Fire risk 1/10 · Minimal
- Est. fire insurance / yr
- $1,222 – $2,270
Heat risk 8/10 · Major
- Hot days now (above 111°F)
- 7 days/yr
- Hot days in 30 yrs
- 24 days/yr
Wind risk 6/10 · Moderate
- Chance of severe wind over 30 yrs
- 27.0%
Air-quality risk 2/10 · Minimal
- Unhealthy air days now
- 1 days/yr
- Unhealthy air days in 30 yrs
- 1 days/yr
Risk factors via First Street. Map © Google.
Why this score? — see what drove the D grade
The composite is a weighted blend of 9 inputs, each scored 0–100. Each bar is that input's sub-score; the figure is the points it added to the 100-point composite (weight × sub-score).
- Cash flow +13.0/30.0
- ARV discount +10.2/15.0
- 1% rule +5.4/10.0
- DSCR +3.9/10.0
- Livability +3.5/5.0
- Schools +2.9/10.0
- Rent growth +2.6/5.0
- Condition / age +2.5/5.0
- Appreciation +0.0/10.0
$144,900
🖨 Deal sheet 📄 Offer letter ✓ Due diligence
Listing remarks
Calling all investors, flippers, and buyers looking to build equity! This fixer-upper offers a great opportunity to transform a property into your vision. Situated on a generously sized lot in an established Mesquite neighborhood, this home features endless potential for renovation, updates, or investment purposes. Conveniently located near schools, shopping, dining, and major highways for an easy commute throughout the Dallas-Fort Worth area. Whether you're searching for your next project or a property with room to add value, this home is ready for its next chapter. Property is being sold as-is.
Key facts
- Generously sized lot
- 7,492 sq ft lot
- Garage
Tags
Property features AI
Finance
- Other: Lot: Less than 0.5 acre; Lot features: Other; Subdivision: Edgemont Park; County: Dallas; GPS-friendly directions
- Financial info: Listing terms: Cash or Conventional; Treat as clear loan type; No second mortgage
- HOA & community: No homeowners association
Exterior
- Parking: Converted garage; Has garage (attached); No covered or carport spaces listed
- Utilities: City water; City sewer; Municipal utility district: No
- Home design: Single-family residential property; One story; Built in 1969; Not attached to other properties
- Construction: Slab foundation; Preowned
- Exterior features: Other exterior features; No fencing
Interior
- Kitchen: Appliances: Other
- Bedrooms: 3 bedrooms total; Primary bedroom on level 1
- Flooring: Combination flooring
- Bathrooms: 1 full bathroom; 1 half bathroom (total 2 bathrooms)
- Heating & cooling: Central heating (electric); Central air; Ceiling fan(s); Wall/window unit(s)
- Interior features: Cable TV available; High-speed internet available; One living area; One dining area; Total of 3 rooms; One level
- Laundry & utility: Laundry: Other
Neighborhood map
What this means for you Summary
Snapshot
- This is a 2-bed/1.5-bath single-family listed at $145k.
Deal economics
- At list price, monthly cash flow is $-8 ($-94/yr) — negative.
- To cash-flow at today's rent, offer at most $144k (1.0% below list).
- Meets the 1% rule at list price ($2k rent vs $145k).
- Recommended offer: $144k (1.0% below list) — sets the bar for cash-flow.
- Cap rate 6.2% vs local median 4.4% in Mesquite — top-decile yield for the area; either an underpriced asset or a hidden risk that comps aren't pricing in. Stress-test before assuming the spread holds.
Location & tenants
- Location reads 70/100 on livability (#358 in TX) — a middle-class / working-renter tenant base. Strengths: cost of living A+, housing A+, health & safety A-; Watch: crime F, commute F.
- Mesquite ISD (suburban): math 35% / reading 32% proficiency, ranked #536 of 826 in TX (top 65%) — families likely to look elsewhere, expect single-tenant / working-renter base with shorter leases; 63% free/reduced lunch — lower-income household profile, screen leases tightly.
- Zoned schools: Mcwhorter El (math 40% / reading 36%, grade F, #1,709 of 4,322 statewide, top 40%, 516 students, 93% FRL) — zoned schools average 93% FRL vs 63% district-wide (30 pts higher); higher-poverty schools than district average — tighter screening recommended.
- Market conditions: Rents flat; 340 active listings in the ZIP; 6 comparable units currently listed for rent nearby; rentals at typical pace (median 15d on market — plan ~3-4 weeks tenant-placement turnaround); 12,577 units permitted in Dallas County in 2024 (6,829 in 5+ unit buildings).
Forward outlook
- Local home prices are declining (-3.0%/yr); year-one equity from $1k of loan paydown is wiped out by about $4k of value loss. Plan a longer hold.
- Dallas County population projected at +35% by 2050 — long-run rental-demand tailwind backs the buy-and-hold thesis.
Negotiation context
- Only 7 days on market — expect competitive offers; lowballing is unlikely to land.
Risks & watch-outs
- Watch-outs: property tax is 3.1% of price.
- Climate carrying-cost: major wind risk, 27% chance of damaging wind over 30y; extreme-heat days projected 7→24/yr by 2055 (HVAC capex compounding) — expect insurance premiums to compound above CPI over the hold.
Questions for the listing agent
- What do current leases actually rent for vs. the listed asking? Can we see a recent rent roll and the last 12 months of T-12 income?
- Built in 1969 — when were the roof, HVAC, electrical panel, plumbing, and water heater last replaced?
- Property tax is high relative to price — has the assessment been appealed recently, and will the sale trigger a re-assessment?
- Is there a deadline driving the sale (1031 exchange, divorce, estate, relocation)? That informs how much negotiation room exists.
- Crime grade is F in this area — have there been break-ins, vandalism, or insurance claims at this property in the last 3 years? What carrier currently insures it and at what premium?
- The area grade is low — what's the realistic commute time and amenity access for the typical tenant pool here? Any planned neighborhood developments (good or bad) we should know about?
- What's the average days-on-market for RENTAL listings here right now (not sales)? A rising rental-DOM trend means longer vacancies and softer asking-rent achievability than the comps imply.
- What's the recent tenant-quality profile in this submarket — average credit score on applications, eviction rate, late-payment / NSF rate, and stable-employment percentage? A property-management company in the area should have these aggregated.
- How much new for-sale + rental construction is in the pipeline within 1–3 miles? Heavy new supply typically softens prices + rents 12–24 months out; constrained supply supports both.
Investment metrics
- 1% rule
- 1.04% ✓
- Cap rate
- 6.23%
- Cash-on-cash
- -0.23%
- DSCR
- 0.99
- GRM
- 8.0
CMA / ARV
- ARV (on-the-fly)
- $154,308
- Comps found
- 12
Show comp detail 12 sales within ~0.75 mi
| Address | Dist | Beds/Ba | Sqft | Sold | Price | $/sf | Match |
|---|---|---|---|---|---|---|---|
| 1229 Greenbrier Dr | 0.16mi | 3/1.0 (+1) | 912 (-1%) | 3mo | $179,000 | $196 | 80 |
| 1519 Briarwood Dr | 0.11mi | 3/1.0 (+1) | 930 (+1%) | 10mo | $199,000 | $214 | 79 |
| 2452 Lindale Ln | 0.19mi | 3/2.0 (+1) | 922 (-0%) | 12mo | $225,000 | $244 | 73 |
| 1433 Melanie Ln | 0.03mi | 3/1.5 (+1) | 1,030 (+12%) | 8mo | $215,000 | $209 | 68 |
| 2021 Avis Cir | 0.41mi | 3/1.0 (+1) | 985 (+7%) | 0mo | $149,900 | $152 | 62 |
| 1325 Woodcrest Dr | 0.56mi | 3/1.0 (+1) | 946 (+2%) | 1mo | $130,000 | $137 | 62 |
| 1837 Grove Cir | 0.49mi | 3/1.0 (+1) | 957 (+4%) | 3mo | $125,000 | $131 | 61 |
| 1817 Grove Cir | 0.46mi | 3/1.0 (+1) | 957 (+4%) | 8mo | $138,000 | $144 | 59 |
| 3005 Sherry Ln | 0.59mi | 3/1.0 (+1) | 864 (-6%) | 3mo | $125,000 | $145 | 52 |
| 1825 Grove Cir | 0.46mi | 3/1.0 (+1) | 969 (+5%) | 14mo | $149,999 | $155 | 52 |
| 1634 Evergreen Dr | 0.72mi | 3/2.0 (+1) | 1,020 (+10%) | 8mo | $169,900 | $167 | 36 |
| 3109 Forestdale Ln | 0.75mi | 3/2.0 (+1) | 1,044 (+13%) | 6mo | $215,000 | $206 | 32 |
Match score weights: distance 35% · size 25% · config 20% · recency 20%. Top-matched comps best support the ARV.
Projected returns pro-forma
-3.0% appreciation · 0.22% rent growth · sell at horizon
- IRR
- -20.4%
- Equity multiple
- 0.31×
- Total profit
- $-27,941
- Equity at exit
- $21,605
- IRR
- -23.3%
- Equity multiple
- 0.01×
- Total profit
- $-40,330
- Equity at exit
- $12,528
Cash invested: $40,572 (down + closing). Projections, not guarantees.
Landlord ↔ Tenant lean methodology
- Overall (STATE)
- 87 Strongly Landlord-Friendly
- State Texas
- 87 Strongly Landlord-Friendly · R+5
- County
- — inherits STATE
- City
- — inherits STATE
ZIP-level market 75149
- Home prices YoY
- -27.4%
- Rents YoY
- 0.2%
- Active inventory
- 340
- Price-to-rent
- 8.0×
Monthly cashflow live
- Estimated rent
- $1,510 high interval (Pro) →
- Mortgage (P&I)
- −$760
- Tax from tax record
- −$380 /mo · $4,563/yr
- Insurance
- −$60
- HOA
- −$0
- Vacancy / Maint / Mgmt
- −$317
- Net cashflow
- $-8
Break-even live
UW: 25.0% down · 7.5% · 30yr · 1.5% tax · 5.0% vac · 8.0% maint · 8.0% mgmt
Financing live
Cash to close
- Down payment
- $36,225
- Closing costs
- $4,347
- Reserves months
- —
- Total cash needed
- —
Loan-product check · same deal, 3 products live
Conventional
25% down · 7.5% · 30yr
- Down + closing
- —
- Monthly P&I
- —
- Monthly cashflow
- —
- DSCR
- —
- Eligible?
- —
Personal DTI + credit; lowest rate.
DSCR
20% down · 8.5% · 30yr
- Down + closing
- —
- Monthly P&I
- —
- Monthly cashflow
- —
- DSCR
- —
- Eligible?
- —
No personal income docs; deal must DSCR.
Hard money
10% down · 12.0% · 12mo
- Down + closing
- —
- Monthly P&I
- —
- Monthly cashflow
- —
- DSCR
- —
- Eligible?
- —
Short-term bridge; refi at stabilization.
Rent comps 6 comps
| Address | Beds | Baths | Sqft | Rent | $/sqft | DOM | Units | Dist |
|---|---|---|---|---|---|---|---|---|
| 2045 Avis Cir Mesquite, TX | 3.0 | 1.0 | 912 | $1,600 | $1.75 | 24d | 1 | 0.33mi |
| 2005 Mount Pleasant Dr Mesquite, TX | 3.0 | 1.0 | 939 | $1,545 | $1.65 | 7d | 1 | 0.33mi |
| 12227 Quail Dr Balch Springs, TX | 1.0–2.0 | 1.0 | 729 | $1,200 | $1.65 | 15d | 1 | 0.71mi |
| 11405 S Blossom Cir Balch Springs, TX | 2.0 | 1.0 | 920 | $1,500 | $1.63 | 1d | 1 | 0.81mi |
| 3212 Balch Springs Rd Balch Springs, TX | 1.0–2.0 | 1.0–2.0 | 825 | $1,245 | $1.51 | 7d | 1 | 0.94mi |
| 2255 W Bruton Rd Mesquite, TX | 1.0–3.0 | 1.0–2.0 | 957 | $1,568 | $1.64 | 43d | 12 | 1.20mi |
Listing history 7 events
-
2026-06-18days on market $144,900 Active 7 DOM
-
2026-06-17pricedays on market $144,900 Active 6 DOM
-
2026-06-16days on market $149,000 Active 5 DOM
-
2026-06-15days on market $149,000 Active 4 DOM
-
2026-06-13days on market $149,000 Active 2 DOM
-
2026-06-13remarks 603-char remark
-
2026-06-13$149,000 Active 1 DOM
ⓘ Source: listings_history table (triggers on properties + properties_extension) + one-shot
backfill from property_details.listing_events for pre-trigger history.
Tax reassessment forecast TX · Resets to sale price
- Current annual tax
- $4,563 · $380/mo
- Projected year-2 tax
- $4,563 · $380/mo
- Expected delta
- $0/yr ($0/mo · 0.0%)
ⓘ Screening estimate from a state-policy table — verify with the county assessor before closing.
Climate risk First Street
- Flood 1/10 Low FEMA zone X (unshaded) · 0% chance over 30 yrs
- Wildfire 1/10 Low
- Heat 8/10 Severe 7 d/yr ≥111°F today · 24 d/yr by 30 yrs out
- Wind 6/10 Major 27% chance of damaging wind over 30 yrs
- Air quality 2/10 Low 1 unhealthy d/yr today · 1 by 30 yrs out
Nearby sold comps map
Loading sold comps map…
Walkable amenities ~0.75 mi
Loading nearby amenities…
Taxation est. · year 1
- Rental income
- $18,117
- − Mortgage interest
- −$8,117
- − Property taxes
- −$4,563
- − Insurance
- −$724
- − Repairs & maintenance
- −$1,449
- − Management
- −$1,449
- − Depreciation
- −$4,215
- Taxable loss
- −$2,401
- Est. tax savings @ 24.0%
- +$576
- After-tax cash flow
- $483/yr
For passive investors: Depreciation is non-cash, so a rental often shows a tax loss while cash-flowing — sheltering income. Rental losses are passive: they offset passive income freely, and up to $25,000/yr can offset ordinary (W-2) income if you actively participate and your MAGI is under $100k (phasing out to $0 by $150k); unused losses carry forward. On sale, claimed depreciation is recaptured at up to 25%, and gains may owe capital-gains tax (a 1031 exchange can defer both). Figures are a year-1 estimate at your 24.0% rate — not tax advice; consult a CPA.
Schools (NCES district)
- District
- Mesquite ISD
- NCES district ID
- 4830390
- Math proficiency
- 35% ▼ -11.00%
- Reading proficiency
- 32% ▼ -7.00%
- Median HH income
- $49,372
- Composite
- 29.06/100
- National rank
- #6606
- State rank
- #536 of 826 in TX
Livability — Mesquite
- Score
- 70/100
- State rank
- #358
- US rank
- #7743
Category grades
Schools grade is shown separately in the Schools card above.
Census & demographics
- Census place
- Mesquite, TX
- County
- Dallas County · 2,612,404 people
- City population
- 150,788
- Metro
- Dallas-Fort Worth-Arlington, TX
- Population (ZIP)
- 58,262
- Household income
- $70,774
- Rent vs Own
- Severe rent burden
- 2266.0
Population outlook (Dallas County) Hauer SSP2
- Today (2025)
- 2,979,839 people
- By 2030
- 3,191,823 · +7.1%
- By 2040
- 3,619,611 · +21.5%
- By 2050
- 4,026,915 · +35.1%
- By 2075
- 4,957,073 · +66.4%
- By 2100
- 5,508,725 · +84.9%
Race, ethnicity, and origin ACS 2023
- Neighborhood character
- Diverse neighborhood (Simpson 0.65)
- Race & ethnicity
- Hispanic / Latino 49% White 25% Two or more races 21% Black 20% Asian 2% Native American 1%
- Hispanic origin (detail)
- Mexican 42% Cuban 1%
- Common ancestry
- Italian 1% Iranian 1% Serbian 1%
- Foreign-born
- 22% · Canada, Vietnam
- Languages at home
- 58% English-only · Spanish 39% Other Asian/Pacific 1% Vietnamese 1%
Political lean MEDSL · Dallas
- 2024 margin
- Strong D (+22.2) · D 60.2% · R 38.0% · Other 1.8%
- 2008→2024 swing
- +6.9pp toward D · 2008: 15.3pp · 2024: 22.2pp
- All cycles
- 2024: D+22.2 2020: D+31.6 2016: D+26.2 2012: D+15.4 2008: D+15.3
Not yet ingested
- Civics
- —
Market trends
- HPI YoY
- ▼ -130.12%
- Current HPI
- 345.6606
- Rent YoY
- ▲ 0.22%
- Metro
- Dallas-Fort Worth-Arlington, TX
- State GDP YoY
- ▲ 3.95%
- F500 in state
- 110
Industry mix (Fortune 500 HQ in TX)
| Industry | F500 HQs | Revenue |
|---|---|---|
| Energy | 16 | $1,198B |
|
||
| Technology | 5 | $198B |
|
||
| Engineering / Construction | 4 | $72B |
|
||
| Energy Services | 3 | $60B |
|
||
| Utilities | 3 | $41B |
|
||
| Healthcare | 2 | $330B |
|
||
Price history
1 event — show timeline
- 2026-06-11 Listed $149,000 NTREIS
Property tax history
+6.8%/yrLatest (2025): $4,563 · +1.1% YoY. Source: county tax records.
Cash-flow waterfall
monthlySold comps — $/sqft
last 12 mo · ≤1 miLoading sold comps…