 Fourplex
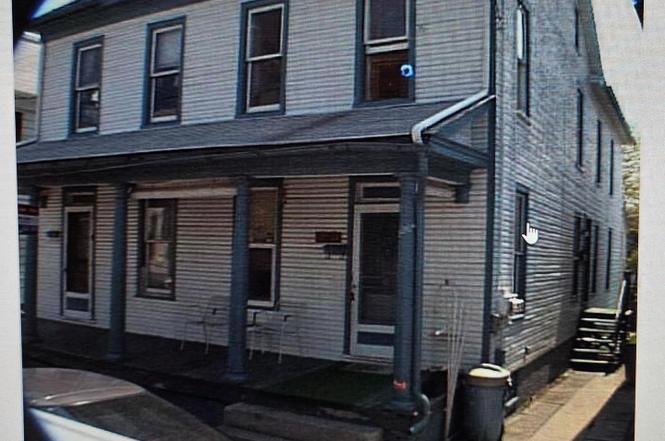
226-2261/2 E Poplar St · Hanover, PA
Flood risk 1/10 · Minimal
- FEMA flood zone
- X (unshaded)
- Chance of flooding over 30 yrs
- 0.0%
- Est. flood insurance / yr
- $473 – $860
Fire risk 1/10 · Minimal
- Est. fire insurance / yr
- $511 – $949
Heat risk 6/10 · Moderate
- Hot days now (above 102°F)
- 7 days/yr
- Hot days in 30 yrs
- 15 days/yr
Wind risk 3/10 · Minor
- Chance of severe wind over 30 yrs
- 7.0%
Air-quality risk 2/10 · Minimal
- Unhealthy air days now
- 1 days/yr
- Unhealthy air days in 30 yrs
- 3 days/yr
Risk factors via First Street. Map © Google.
Why this score? — see what drove the D+ grade
The composite is a weighted blend of 9 inputs, each scored 0–100. Each bar is that input's sub-score; the figure is the points it added to the 100-point composite (weight × sub-score).
- Cash flow +22.0/30.0
- DSCR +7.0/10.0
- 1% rule +5.8/10.0
- Livability +3.8/5.0
- Rent growth +3.7/5.0
- Schools +3.7/10.0
- Condition / age +2.5/5.0
- ARV discount +0.0/15.0
- Appreciation +0.0/10.0
$445,000
🖨 Deal sheet 📄 Offer letter ✓ Due diligence
Multi-family units
County records classify this as Multi-Family (2-4 Unit). Listing-text estimate: 4 units. confirmed
Listing remarks
4-Unit Investment Property – Prime Location Near Downtown Hanover, PA Discover an exceptional investment opportunity just steps from vibrant downtown Hanover! This well-maintained 4-unit multifamily property features four spacious 2-bedroom apartments, each offering comfortable living with central heating and cooling—a strong draw for quality long-term tenants. Situated on a generous lot, the property includes 8 dedicated parking spaces, providing convenience rarely found this close to town. Residents will appreciate the easy walking-distance access to downtown Hanover, including shops, restaurants, parks, and local amenities. Whether you’re expanding your portfolio or see
Key facts
- 5,027 sq ft lot
- Built 1920
- Listed 144 days
Tags
Neighborhood map
What this means for you Summary
Snapshot
- This is a 4 × 2-bed/1.5-bath units multifamily listed at $445k.
Deal economics
- At list price, monthly cash flow is $706 ($8k/yr) — positive. Per door: $176/mo.
- The deal already cash-flows at list — no discount required.
- Meets the 1% rule at list price ($5k rent vs $445k).
- Recommended offer: $392k (12.0% below list) — sets the bar for market timing.
- Cap rate 8.2% vs local median 3.9% in Hanover — top-decile yield for the area; either an underpriced asset or a hidden risk that comps aren't pricing in. Stress-test before assuming the spread holds.
Location & tenants
- Location reads 76/100 on livability (#373 in PA, #3,295 nationally) — a middle-class / working-renter tenant base. Strengths: cost of living A+, housing A+, health & safety A+; Watch: amenities C-, employment D, commute F.
- Hanover Public SD (urban): math 34% / reading 54% proficiency, ranked #294 of 539 in PA (top 54%) — families likely to look elsewhere, expect single-tenant / working-renter base with shorter leases.
- Market conditions: Rents rising fast (+4.7%/yr); 386 active listings in the ZIP; solid renter incomes; 1,328 units permitted in York County in 2024 (338 in 5+ unit buildings).
- At $4,786/mo this rent would consume 72% of the median local household income ($79k/yr) (locally 1076% of renters already pay >50% of income on rent) — very limited rent-growth headroom before tenants either downsize or default.
Forward outlook
- Local home prices are declining (-3.0%/yr); year-one equity from $3k of loan paydown is wiped out by about $13k of value loss. Plan a longer hold.
Negotiation context
- It's been on market 144 days — a 12% lower offer ($392k) is reasonable based on typical stale-listing flexibility.
Risks & watch-outs
- Watch-outs: built in 1920 — expect roof / HVAC / electrical / plumbing capex.
- Climate carrying-cost: extreme-heat days projected 7→15/yr by 2055 (HVAC capex compounding) — expect insurance premiums to compound above CPI over the hold.
Questions for the listing agent
- It's been on market 144 days. Have you received any prior offers? Is the seller open to a 12% concession, seller financing, or rate buy-down credit?
- Can we see the unit-by-unit rent roll, current vacancy, and any below-market leases? What's the average tenancy length?
- What capital expenditures (roof, boiler, parking lot, exteriors) have been made in the last 5 years, and what's planned in the next 2?
- Built in 1920 — when were the roof, HVAC, electrical panel, plumbing, and water heater last replaced?
- Why hasn't it sold? Are there any deal-killer items the seller is aware of (foundation, flood, title, zoning, code violations)?
- Is there a deadline driving the sale (1031 exchange, divorce, estate, relocation)? That informs how much negotiation room exists.
- The area grade is low — what's the realistic commute time and amenity access for the typical tenant pool here? Any planned neighborhood developments (good or bad) we should know about?
- What's the average days-on-market for RENTAL listings here right now (not sales)? A rising rental-DOM trend means longer vacancies and softer asking-rent achievability than the comps imply.
- What's the recent tenant-quality profile in this submarket — average credit score on applications, eviction rate, late-payment / NSF rate, and stable-employment percentage? A property-management company in the area should have these aggregated.
- How much new apartment / multifamily construction is in the pipeline within 1–3 miles? Heavy new supply (>2% of stock underway) typically softens rents 12–24 months out; light construction supports rent growth.
Investment metrics
- 1% rule
- 1.08% ✓
- Cap rate
- 8.20%
- Cash-on-cash
- 6.80%
- DSCR
- 1.30
- GRM
- 7.7
CMA / ARV
- ARV (on-the-fly)
- $366,240
- Comps found
- 1
Show comp detail 1 sale within ~0.75 mi
| Address | Dist | Beds/Ba | Sqft | Sold | Price | $/sf | Match |
|---|---|---|---|---|---|---|---|
| 226-2261/2 E Poplar St | 0.00mi | 8/— | 3,360 (0%) | 1mo | $365,000 | $109 | 99 |
Match score weights: distance 35% · size 25% · config 20% · recency 20%. Top-matched comps best support the ARV.
Projected returns pro-forma
-3.0% appreciation · 4.67% rent growth · sell at horizon
- IRR
- -4.0%
- Equity multiple
- 0.85×
- Total profit
- $-18,919
- Equity at exit
- $66,351
- IRR
- 7.5%
- Equity multiple
- 1.61×
- Total profit
- $76,402
- Equity at exit
- $38,475
Cash invested: $124,600 (down + closing). Projections, not guarantees.
Landlord ↔ Tenant lean methodology
- Overall (STATE)
- 62 Landlord-Friendly
- State Pennsylvania
- 62 Landlord-Friendly · EVEN
- County
- — inherits STATE
- City
- — inherits STATE
ZIP-level market 17331
- Home prices YoY
- -33.8%
- Rents YoY
- 4.7%
- Active inventory
- 386
- Price-to-rent
- 31.0×
Monthly cashflow live
- Estimated rent
- $4,786 high interval (Pro) →
- Mortgage (P&I)
- −$2,334
- Tax est. 1.5%
- −$556 /mo · $6,675/yr
- Insurance
- −$185
- HOA
- −$0
- Vacancy / Maint / Mgmt
- −$1,005
- Net cashflow
- $706
Break-even live
4-unit breakdown (identical units grouped — click to expand)
| Units | Beds | Baths | Est. rent |
|---|---|---|---|
| 4× units | 2 | 1.5 | $4,784 |
| #1 | 2 | 1.5 | $1,196 |
| #2 | 2 | 1.5 | $1,196 |
| #3 | 2 | 1.5 | $1,196 |
| #4 | 2 | 1.5 | $1,196 |
| Total (4 units) | $4,786 | ||
UW: 25.0% down · 7.5% · 30yr · 1.5% tax · 5.0% vac · 8.0% maint · 8.0% mgmt
Financing live
Cash to close
- Down payment
- $111,250
- Closing costs
- $13,350
- Reserves months
- —
- Total cash needed
- —
Loan-product check · same deal, 3 products live
Conventional
25% down · 7.5% · 30yr
- Down + closing
- —
- Monthly P&I
- —
- Monthly cashflow
- —
- DSCR
- —
- Eligible?
- —
Personal DTI + credit; lowest rate.
DSCR
20% down · 8.5% · 30yr
- Down + closing
- —
- Monthly P&I
- —
- Monthly cashflow
- —
- DSCR
- —
- Eligible?
- —
No personal income docs; deal must DSCR.
Hard money
10% down · 12.0% · 12mo
- Down + closing
- —
- Monthly P&I
- —
- Monthly cashflow
- —
- DSCR
- —
- Eligible?
- —
Short-term bridge; refi at stabilization.
Listing history 2 events
-
2026-04-14status Pending
-
2025-11-21$445,000 Active
ⓘ Source: listings_history table (triggers on properties + properties_extension) + one-shot
backfill from property_details.listing_events for pre-trigger history.
Climate risk First Street
- Flood 1/10 Low FEMA zone X (unshaded) · 0% chance over 30 yrs
- Wildfire 1/10 Low
- Heat 6/10 Major 7 d/yr ≥102°F today · 15 d/yr by 30 yrs out
- Wind 3/10 Moderate 7% chance of damaging wind over 30 yrs
- Air quality 2/10 Low 1 unhealthy d/yr today · 3 by 30 yrs out
Nearby sold comps map
Loading sold comps map…
Walkable amenities ~0.75 mi
Loading nearby amenities…
Taxation est. · year 1
- Rental income
- $57,432
- − Mortgage interest
- −$24,927
- − Property taxes
- −$6,675
- − Insurance
- −$2,225
- − Repairs & maintenance
- −$4,595
- − Management
- −$4,595
- − Depreciation
- −$12,945
- Taxable income
- $1,471
- Est. tax owed @ 24.0%
- −$353
- After-tax cash flow
- $8,115/yr
For passive investors: Depreciation is non-cash, so a rental often shows a tax loss while cash-flowing — sheltering income. Rental losses are passive: they offset passive income freely, and up to $25,000/yr can offset ordinary (W-2) income if you actively participate and your MAGI is under $100k (phasing out to $0 by $150k); unused losses carry forward. On sale, claimed depreciation is recaptured at up to 25%, and gains may owe capital-gains tax (a 1031 exchange can defer both). Figures are a year-1 estimate at your 24.0% rate — not tax advice; consult a CPA.
Schools (NCES district)
- District
- Hanover Public SD
- NCES district ID
- 4211450
- Math proficiency
- 34% ▼ -11.00%
- Reading proficiency
- 54% ▼ -8.00%
- Median HH income
- $45,022
- Composite
- 37.26/100
- National rank
- #4457
- State rank
- #294 of 539 in PA
Livability — Hanover
- Score
- 76/100
- State rank
- #373
- US rank
- #3295
Category grades
Schools grade is shown separately in the Schools card above.
Census & demographics
- Census place
- Hanover, PA
- County
- York County · 278,806 people
- City population
- 56,443
- Metro
- York-Hanover, PA
- Population (ZIP)
- 56,443
- Household income
- $79,488
- Rent vs Own
- Severe rent burden
- 1076.0
Population outlook (York County) Hauer SSP2
- Today (2025)
- 454,205 people
- By 2030
- 457,407 · +0.7%
- By 2040
- 457,529 · +0.7%
- By 2050
- 448,261 · -1.3%
- By 2075
- 427,388 · -5.9%
- By 2100
- 384,218 · -15.4%
Race, ethnicity, and origin ACS 2023
- Neighborhood character
- Predominantly White (86%)
- Race & ethnicity
- White 86% Hispanic / Latino 7% Two or more races 7% Black 3% Asian 1%
- Hispanic origin (detail)
- Mexican 3% Puerto Rican 2%
- Common ancestry
- Romanian 3% Lithuanian 2% Slovak 2%
- Foreign-born
- 4% · Canada
- Languages at home
- 95% English-only · Spanish 3%
Political lean MEDSL · York
- 2024 margin
- Strong R (+25.3) · D 36.9% · R 62.1%
- 2008→2024 swing
- -11.7pp toward R · 2008: -13.6pp · 2024: -25.3pp
- All cycles
- 2024: R+25.3 2020: R+24.6 2016: R+29.3 2012: R+21.2 2008: R+13.6
Not yet ingested
- Civics
- —
Market trends
- HPI YoY
- ▼ -128.48%
- Current HPI
- 251.8974
- Rent YoY
- ▲ 4.67%
- Metro
- York-Hanover, PA
- State GDP YoY
- ▲ 1.68%
- F500 in state
- 34
Industry mix (Fortune 500 HQ in PA)
| Industry | F500 HQs | Revenue |
|---|---|---|
| Healthcare | 2 | $309B |
|
||
| Insurance | 2 | $27B |
|
||
| Telecommunications / Media | 1 | $124B |
|
||
| Industrial Distribution | 1 | $22B |
|
||
| Financial Services | 1 | $20B |
|
||
| Chemicals / Materials | 1 | $18B |
|
||
Price history
2 events — show timeline
- 2026-04-14 Pending — BRIGHT MLS
- 2025-11-21 Listed $445,000 BRIGHT MLS
Cash-flow waterfall
monthlySold comps — $/sqft
last 12 mo · ≤1 miLoading sold comps…