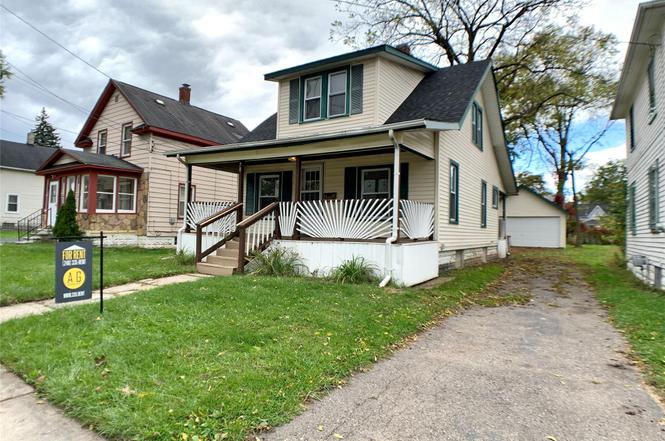
70 S Jessie St · Pontiac, MI
Flood risk 1/10 · Minimal
- FEMA flood zone
- X (unshaded)
- Chance of flooding over 30 yrs
- 0.0%
- Est. flood insurance / yr
- $507 – $1,088
Fire risk 1/10 · Minimal
- Est. fire insurance / yr
- $784 – $1,456
Heat risk 2/10 · Minimal
- Hot days now (above 96°F)
- 7 days/yr
- Hot days in 30 yrs
- 15 days/yr
Wind risk 2/10 · Minimal
- Chance of severe wind over 30 yrs
- —
Air-quality risk 3/10 · Minor
- Unhealthy air days now
- 2 days/yr
- Unhealthy air days in 30 yrs
- 4 days/yr
Risk factors via First Street. Map © Google.
Why this score? — see what drove the B grade
The composite is a weighted blend of 9 inputs, each scored 0–100. Each bar is that input's sub-score; the figure is the points it added to the 100-point composite (weight × sub-score).
- Cash flow +30.0/30.0
- ARV discount +15.0/15.0
- DSCR +10.0/10.0
- 1% rule +7.9/10.0
- Livability +3.2/5.0
- Rent growth +2.5/5.0
- Condition / age +2.5/5.0
- Schools +1.0/10.0
- Appreciation +0.0/10.0
$110,000
🖨 Deal sheet (PDF) 📄 Offer letter ✓ Due diligence
Listing remarks MLS
Investor opportunity! 70 S. Jessie is being sold as part of a package with 1198 Neafie (MLS#20261044988), offering the chance to add two income-producing properties to your portfolio. This 3-bedroom, 1-bath bungalow features a detached 2-car garage and an unfinished basement, providing additional storage and value-add potential. The property has been well maintained and offers strong rental appeal. Whether you're looking to expand your existing portfolio or secure your next investment, this package presents an excellent opportunity to generate cash flow and build long-term wealth.
Key facts
- Value-add potential
- Unfinished basement
- Additional storage
Tags
Property features AI
Exterior
- Parking: Detached 2-car garage
- Utilities: Public water; Public sewer
- Home design: Single-family residence; One-and-one-half story; Ground-level entry with steps
- Construction: Aluminum siding; Block foundation
- Exterior features: Paved road access; Lot approximately 0.17 acres (50 x 150.73)
Interior
- Kitchen: Dishwasher; Disposal; Free-standing gas range; Free-standing refrigerator; Microwave
- Bedrooms: 6 total rooms (includes bedroom spaces)
- Bathrooms: 1 full bathroom
- Heating & cooling: Forced air heating (natural gas); No central cooling
- Interior features: Dishwasher; Disposal; Free-standing gas range; Free-standing refrigerator; Microwave; Unfinished basement
Neighborhood map
What this means for you Summary
Snapshot
- This is a 3-bed/1.0-bath single-family listed at $110k.
Deal economics
- At list price, monthly cash flow is $415 ($5k/yr) — positive.
- The deal already cash-flows at list — no discount required.
- Meets the 1% rule at list price ($1k rent vs $110k).
- Cap rate 10.8% vs local median 6.7% in Pontiac — top-decile yield for the area; either an underpriced asset or a hidden risk that comps aren't pricing in. Stress-test before assuming the spread holds.
Location & tenants
- Location reads 64/100 on livability (#499 in MI) — a middle-class / working-renter tenant base. Strengths: commute A+, cost of living A+, housing A+; Watch: health & safety D, schools F, crime F.
- Pontiac City School District (urban): math 8% / reading 17% proficiency, ranked #514 of 540 in MI (top 95%) — low school quality limits family demand, transient renter base, plan for 1-2y turnover; 81% free/reduced lunch — lower-income household profile, screen leases tightly.
- Market conditions: 87 active listings in the ZIP; 20 comparable units currently listed for rent nearby; rentals at typical pace (median 25d on market — plan ~3-4 weeks tenant-placement turnaround); 45% of comp listings sitting > 30 days — soft ceiling on asking rent; 2,614 units permitted in Oakland County in 2024 (721 in 5+ unit buildings).
Forward outlook
- Local home prices are declining (-3.0%/yr); year-one equity from $761 of loan paydown is wiped out by about $3k of value loss. Plan a longer hold.
- Oakland County population projected at +10% by 2050 — modest demand growth; plan on rents tracking national, not racing it.
- At projected returns (-3.0% appreciation + 3.0% rent growth), your $31k cash investment doubles in ~8 years — after that, you're playing with house money.
Negotiation context
- Only 3 days on market — expect competitive offers; lowballing is unlikely to land.
- 13 sale attempts since 19y ago with the ask held roughly flat each time — persistent listings suggest the price (not the market) is what's stuck; bring a comps-based counter.
Risks & watch-outs
- Watch-outs: built in 1920 — expect roof / HVAC / electrical / plumbing capex.
Questions for the listing agent
- Built in 1920 — when were the roof, HVAC, electrical panel, plumbing, and water heater last replaced?
- Is there a deadline driving the sale (1031 exchange, divorce, estate, relocation)? That informs how much negotiation room exists.
- Schools are F-rated, which usually means shorter tenancies and higher turnover. Who's the typical renter profile here, and what's been the actual vacancy rate?
- Crime grade is F in this area — have there been break-ins, vandalism, or insurance claims at this property in the last 3 years? What carrier currently insures it and at what premium?
- What's the average days-on-market for RENTAL listings here right now (not sales)? A rising rental-DOM trend means longer vacancies and softer asking-rent achievability than the comps imply.
- What's the recent tenant-quality profile in this submarket — average credit score on applications, eviction rate, late-payment / NSF rate, and stable-employment percentage? A property-management company in the area should have these aggregated.
- How much new for-sale + rental construction is in the pipeline within 1–3 miles? Heavy new supply typically softens prices + rents 12–24 months out; constrained supply supports both.
Investment metrics
- 1% rule
- 1.29% ✓
- Cap rate
- 10.82%
- Cash-on-cash
- 16.16%
- DSCR
- 1.72
- GRM
- 6.5
CMA / ARV
- ARV (on-the-fly)
- $175,680
- Comps found
- 12
Show comp detail 12 sales within ~0.75 mi
| Address | Dist | Beds/Ba | Sqft | Sold | Price | $/sf | Match |
|---|---|---|---|---|---|---|---|
| 53 N Roselawn St | 0.24mi | 3/2.5 | 1,400 (-3%) | 8mo | $180,000 | $129 | 71 |
| 55 N Roselawn Street St | 0.25mi | 3/2.5 | 1,400 (-3%) | 8mo | $180,000 | $129 | 71 |
| 103 N Roselawn St | 0.35mi | 3/2.0 | 1,487 (+3%) | 10mo | $105,000 | $71 | 66 |
| 75 S Jessie St | 0.02mi | 3/1.0 | 1,240 (-14%) | 13mo | $115,000 | $93 | 65 |
| 32 S Marshall St | 0.49mi | 3/1.0 | 1,491 (+4%) | 11mo | $81,000 | $54 | 62 |
| 161 Perkins St | 0.46mi | 3/2.5 | 1,471 (+2%) | 12mo | $180,000 | $122 | 59 |
| 291 Michigan Ave | 0.56mi | 2/1.5 (-1) | 1,400 (-3%) | 5mo | $108,000 | $77 | 58 |
| 23 Martin Luther King JR Blvd N | 0.57mi | 3/1.5 | 1,412 (-2%) | 13mo | $205,000 | $145 | 58 |
| 21 Bellevue St | 0.29mi | 4/2.0 (+1) | 1,344 (-7%) | 12mo | $69,900 | $52 | 56 |
| 234 Chandler St | 0.16mi | 4/2.5 (+1) | 1,593 (+11%) | 11mo | $234,000 | $147 | 54 |
| 135 Osmun St | 0.50mi | 3/2.5 | 1,368 (-5%) | 10mo | $210,000 | $154 | 54 |
| 200 Prospect St | 0.75mi | 3/1.0 | 1,350 (-6%) | 9mo | $63,000 | $47 | 47 |
Match score weights: distance 35% · size 25% · config 20% · recency 20%. Top-matched comps best support the ARV.
Projected returns pro-forma
-3.0% appreciation · 3.0% rent growth · sell at horizon
- IRR
- 7.1%
- Equity multiple
- 1.28×
- Total profit
- $8,584
- Equity at exit
- $16,401
- IRR
- 16.4%
- Equity multiple
- 2.35×
- Total profit
- $41,449
- Equity at exit
- $9,511
Cash invested: $30,800 (down + closing). Projections, not guarantees.
Landlord ↔ Tenant lean methodology
- Overall (STATE)
- 62 Landlord-Friendly
- State Michigan
- 62 Landlord-Friendly · EVEN
- County
- — inherits STATE
- City
- — inherits STATE
ZIP-level market 48342
- Home prices YoY
- -33.8%
- Active inventory
- 87
- Price-to-rent
- 6.5×
Monthly cashflow live
- Estimated rent
- $1,420 high interval (Pro) →
- Mortgage (P&I)
- −$577
- Tax from tax record
- −$84 /mo · $1,011/yr
- Insurance
- −$46
- HOA
- −$0
- Vacancy / Maint / Mgmt
- −$298
- Net cashflow
- $415
Break-even live
Sensitivity live
| Price | -10% $477 | -5% $446 | +0% $415 | +5% $384 | +10% $353 |
|---|---|---|---|---|---|
| Rent | -10% $303 | -5% $359 | +0% $415 | +5% $471 | +10% $527 |
| Rate | -1.0pp $470 | -0.5pp $443 | base $415 | +0.5pp $386 | +1.0pp $357 |
UW: 25.0% down · 7.5% · 30yr · 1.5% tax · 5.0% vac · 8.0% maint · 8.0% mgmt
Financing live
Cash to close
- Down payment
- $27,500
- Closing costs
- $3,300
- Reserves months
- —
- Total cash needed
- —
Loan-product check · same deal, 3 products live
Conventional
25% down · 7.5% · 30yr
- Down + closing
- —
- Monthly P&I
- —
- Monthly cashflow
- —
- DSCR
- —
- Eligible?
- —
Personal DTI + credit; lowest rate.
DSCR
20% down · 8.5% · 30yr
- Down + closing
- —
- Monthly P&I
- —
- Monthly cashflow
- —
- DSCR
- —
- Eligible?
- —
No personal income docs; deal must DSCR.
Hard money
10% down · 12.0% · 12mo
- Down + closing
- —
- Monthly P&I
- —
- Monthly cashflow
- —
- DSCR
- —
- Eligible?
- —
Short-term bridge; refi at stabilization.
Rent comps 20 comps
| Address | Beds | Baths | Sqft | Rent | $/sqft | DOM | Units | Dist |
|---|---|---|---|---|---|---|---|---|
| 38 N Shirley St Pontiac, MI | 3.0 | 1.0 | 1174 | $1,425 | $1.21 | 44d | 1 | 0.26mi |
| 68 N Shirley St Pontiac, MI | 3.0 | 1.0 | 950 | $1,395 | $1.47 | 18d | 1 | 0.30mi |
| 4000 Winston Dr Pontiac, MI | 2.0 | 1.5 | 952 | $1,182 | $1.24 | 0d | 1 | 0.36mi |
| 107 N Sanford St Pontiac, MI | 4.0 | 1.5 | 1467 | $1,750 | $1.19 | 44d | 1 | 0.41mi |
| 128 S Edith St Pontiac, MI | 2.0–3.0 | 2.0 | 1155 | $1,700 | $1.47 | 18d | 1 | 0.43mi |
| 90 Martin Luther King Jr Blvd S Pontiac, MI | 2.0 | 1.0 | 900 | $1,000 | $1.11 | 44d | 1 | 0.55mi |
| 49 Oakhill St Pontiac, MI | 3.0 | 1.0 | 1200 | $1,575 | $1.31 | 25d | 1 | 0.75mi |
| 16 Victory Dr Unit 18 Pontiac, MI | 2.0 | 1.0 | 1114 | $1,150 | $1.03 | 25d | 1 | 0.78mi |
| 16 Victory Dr Unit 18 Pontiac, MI | 2.0 | 1.0 | 1118 | $1,150 | $1.03 | 44d | 1 | 0.78mi |
| 188 Vernon Dr Pontiac, MI | 3.0 | 1.0 | 1100 | $1,500 | $1.36 | 25d | 1 | 1.09mi |
| 442 Central Ave Unit 1 Pontiac, MI | 2.0 | 1.0 | 1500 | $1,500 | $1.00 | 5d | 1 | 1.10mi |
| 442 Central Ave Pontiac, MI | 2.0 | 1.0 | 1500 | $1,250 | $0.83 | 17d | 1 | 1.10mi |
| 249 W Wilson Ave Unit 1 Pontiac, MI | 3.0 | 1.0 | 900 | $1,540 | $1.71 | 44d | 1 | 1.11mi |
| 489 Central Ave Pontiac, MI | 2.0 | 1.0 | 1140 | $1,195 | $1.05 | 5d | 1 | 1.11mi |
| 23 Henry Clay Ave Unit 1 Pontiac, MI | 3.0 | 1.0 | 1200 | $1,450 | $1.21 | 18d | 1 | 1.21mi |
| 264 Nelson St Pontiac, MI | 3.0 | 1.0 | 1478 | $1,590 | $1.08 | 44d | 1 | 1.23mi |
| 672 Linda Vista Dr Pontiac, MI | 3.0 | 1.0 | 900 | $1,500 | $1.67 | 4d | 1 | 1.25mi |
| 65 Whitfield St Pontiac, MI | 3.0 | 1.0 | 924 | $1,175 | $1.27 | 44d | 1 | 1.25mi |
| 471 Montana Ave Pontiac, MI | 3.0 | 1.0 | 1017 | $1,599 | $1.57 | 44d | 1 | 1.31mi |
| 611 Montana Ave Pontiac, MI | 3.0 | 1.0 | 1112 | $1,350 | $1.21 | 44d | 1 | 1.43mi |
Listing history 4 events
-
2026-06-18days on market $110,000 Active 3 DOM
-
2026-06-17days on market $110,000 Active 2 DOM
-
2026-06-16remarks 587-char remark
-
2026-06-16$110,000 Active 1 DOM
ⓘ Source: listings_history table (triggers on properties + properties_extension) + one-shot
backfill from property_details.listing_events for pre-trigger history.
Tax reassessment forecast MI · Partial reset (capped growth)
- Current annual tax
- $1,011 · $84/mo
- Projected year-2 tax
- $1,352 · $113/mo
- Expected delta
- +$342/yr (+$28/mo · 33.8%)
ⓘ Screening estimate from a state-policy table — verify with the county assessor before closing.
Climate risk First Street
- Flood 1/10 Low FEMA zone X (unshaded) · 0% chance over 30 yrs
- Wildfire 1/10 Low
- Heat 2/10 Low 7 d/yr ≥96°F today · 15 d/yr by 30 yrs out
- Wind 2/10 Low
- Air quality 3/10 Moderate 2 unhealthy d/yr today · 4 by 30 yrs out
Nearby sold comps map
Loading sold comps map…
Walkable amenities ~0.75 mi
Loading nearby amenities…
Taxation est. · year 1
- Rental income
- $17,039
- − Mortgage interest
- −$6,162
- − Property taxes
- −$1,011
- − Insurance
- −$550
- − Repairs & maintenance
- −$1,363
- − Management
- −$1,363
- − Depreciation
- −$3,200
- Taxable income
- $3,390
- Est. tax owed @ 24.0%
- −$814
- After-tax cash flow
- $4,164/yr
For passive investors: Depreciation is non-cash, so a rental often shows a tax loss while cash-flowing — sheltering income. Rental losses are passive: they offset passive income freely, and up to $25,000/yr can offset ordinary (W-2) income if you actively participate and your MAGI is under $100k (phasing out to $0 by $150k); unused losses carry forward. On sale, claimed depreciation is recaptured at up to 25%, and gains may owe capital-gains tax (a 1031 exchange can defer both). Figures are a year-1 estimate at your 24.0% rate — not tax advice; consult a CPA.
Schools (NCES district)
- District
- Pontiac City School District
- NCES district ID
- 2628740
- Math proficiency
- 8% ▼ -5.00%
- Reading proficiency
- 17% ▼ -3.00%
- Median HH income
- $33,888
- Composite
- 10.12/100
- National rank
- #9802
- State rank
- #514 of 540 in MI
Livability — Pontiac
- Score
- 64/100
- State rank
- #499
- US rank
- #14703
Category grades
Schools grade is shown separately in the Schools card above.
Census & demographics
- Census place
- Pontiac, MI
- City population
- 44,593
- Population (ZIP)
- 17,227
Population outlook (Oakland County) Hauer SSP2
- Today (2025)
- 1,335,747 people
- By 2030
- 1,375,100 · +2.9%
- By 2040
- 1,435,385 · +7.5%
- By 2050
- 1,469,250 · +10.0%
- By 2075
- 1,531,946 · +14.7%
- By 2100
- 1,450,485 · +8.6%
Race, ethnicity, and origin ACS 2023
- Neighborhood character
- Diverse neighborhood (Simpson 0.62)
- Race & ethnicity
- Black 57% Hispanic / Latino 19% White 13% Two or more races 13% Asian 4%
- Hispanic origin (detail)
- Mexican 11% Puerto Rican 2%
- Common ancestry
- Romanian 1% Lithuanian 1% Italian 1%
- Foreign-born
- 10% · Canada, Vietnam
- Languages at home
- 79% English-only · Spanish 15% Other Asian/Pacific 4% Other Indo-European 1%
Political lean MEDSL · Oakland
- 2024 margin
- D (+10.6) · D 54.4% · R 43.8% · Other 1.9%
- 2008→2024 swing
- -3.9pp toward R · 2008: 14.5pp · 2024: 10.6pp
- All cycles
- 2024: D+10.6 2020: D+14.1 2016: D+8.1 2012: D+8.1 2008: D+14.5
Not yet ingested
- Civics
- —
Market trends
- HPI YoY
- ▼ -109.18%
- Current HPI
- 214.3258
- Rent YoY
- —
- Metro
- —
- State GDP YoY
- ▲ 1.37%
- F500 in state
- 28
Industry mix (Fortune 500 HQ in MI)
| Industry | F500 HQs | Revenue |
|---|---|---|
| Automotive Parts | 3 | $48B |
|
||
| Automotive | 2 | $372B |
|
||
| Chemicals | 1 | $45B |
|
||
| Automotive Retail | 1 | $29B |
|
||
| Healthcare / Medical Devices | 1 | $23B |
|
||
| Automotive Technology | 1 | $20B |
|
||
Price history
+562.7% since first listed27 events — show timeline
- 2026-06-15 Listed $110,000 REALCOMP
- 2026-06-15 Listed $110,000 MiRealSource-MiMLS
- 2025-06-20 Listing Removed — MiRealSource-MiMLS
- 2025-06-11 Listed $105,000 REALCOMP
- 2025-06-11 Listed $105,000 MiRealSource-MiMLS
- 2014-05-02 Sold (Public Records) $106,069 Public Records
- 2008-01-08 Sold (MLS) $12,500 REALCOMP
- 2008-01-08 Sold (MLS) $12,500 MiRealSource-MiMLS
- 2008-01-03 Listing Removed — MiRealSource-MiMLS
- 2007-12-26 Listing Removed — REALCOMP
- 2007-12-26 Listed $14,900 REALCOMP
- 2007-12-17 Listing Removed — REALCOMP
- 2007-12-17 Listed $24,900 REALCOMP
- 2007-11-28 Listing Removed — REALCOMP
- 2007-11-28 Listed $24,900 REALCOMP
- 2007-10-31 Listing Removed — REALCOMP
- 2007-10-31 Listed $29,900 REALCOMP
- 2007-10-03 Listing Removed — REALCOMP
- 2007-10-03 Listed $34,900 REALCOMP
- 2007-09-13 Listing Removed — REALCOMP
- 2007-09-12 Listed $39,900 REALCOMP
- 2007-08-08 Listing Removed — REALCOMP
- 2007-08-08 Listed $44,900 REALCOMP
- 2007-07-12 Listed $49,900 REALCOMP
- 2007-07-12 Listed $14,900 MiRealSource-MiMLS
- 2002-05-30 Sold (Public Records) $74,900 Public Records
- 1971-05-12 Sold (Public Records) $16,600 Public Records
Property tax history
+3.0%/yrLatest (2025): $1,011 · +2.7% YoY. Source: county tax records.
Cash-flow waterfall
monthlySold comps — $/sqft
last 12 mo · ≤1 miLoading sold comps…