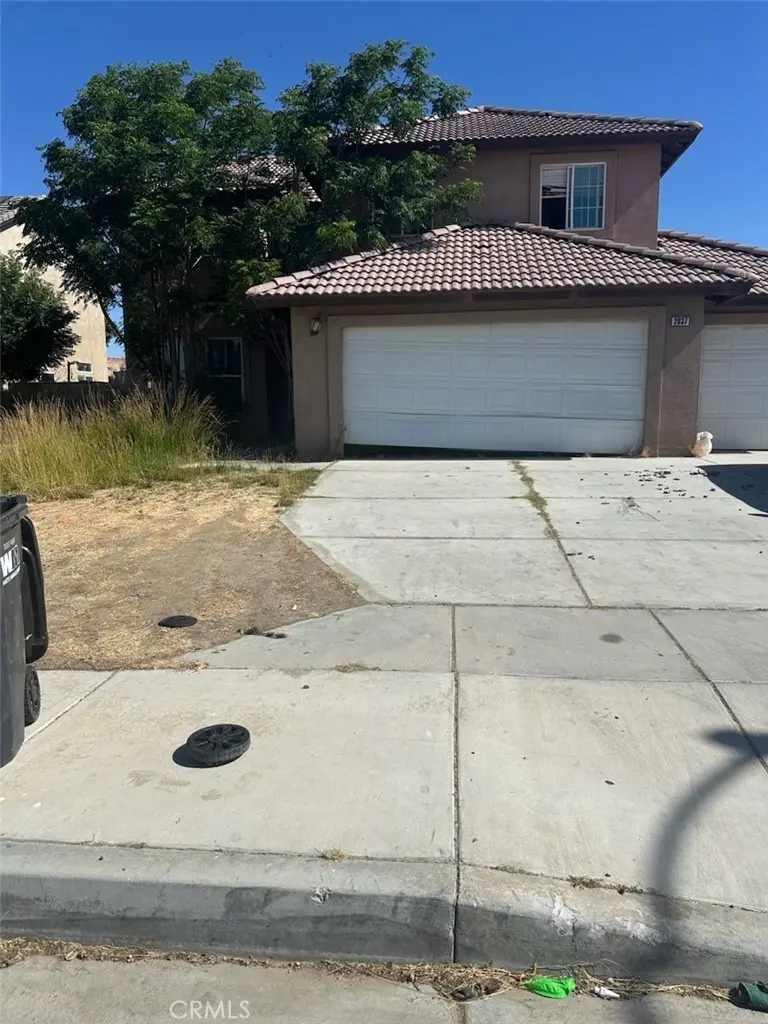
2037 E Kettering St · Lancaster, CA
Flood risk 1/10 · Minimal
- FEMA flood zone
- X (shaded)
- Chance of flooding over 30 yrs
- 0.0%
- Est. flood insurance / yr
- $507 – $1,088
Fire risk 5/10 · Moderate
- Est. fire insurance / yr
- $659 – $1,223
Heat risk 7/10 · Major
- Hot days now (above 101°F)
- 7 days/yr
- Hot days in 30 yrs
- 19 days/yr
Wind risk 1/10 · Minimal
- Chance of severe wind over 30 yrs
- —
Air-quality risk 8/10 · Major
- Unhealthy air days now
- 16 days/yr
- Unhealthy air days in 30 yrs
- 21 days/yr
Risk factors via First Street. Map © Google.
Why this score? — see what drove the C+ grade
The composite is a weighted blend of 9 inputs, each scored 0–100. Each bar is that input's sub-score; the figure is the points it added to the 100-point composite (weight × sub-score).
- Cash flow +25.8/30.0
- DSCR +8.6/10.0
- 1% rule +7.8/10.0
- ARV discount +7.5/15.0
- Livability +3.4/5.0
- Rent growth +2.5/5.0
- Condition / age +2.5/5.0
- Schools +2.1/10.0
- Appreciation +0.0/10.0
$250,000
🖨 Deal sheet 📄 Offer letter ✓ Due diligence
Listing remarks MLS
GREAT OPPORTUNITY! Beautiful ready to move in two story home! 4 beds, 3 full baths, with a huge backyard! Downstairs bedroom and full bathroom. Kitchen offers stainless steel appliances, new granite counter top , and opens up to the large family room w/ fireplace. New Laminated wood floor and tile. The spacious master suite showcases his and her sinks and a giant walk-in closet, ceiling fans, 3 car garage, washable interior paint, & more!.
Key facts
- 6,960 sq ft lot
- 3 garage spots
- Built 2007
Property features AI
Exterior
- Parking: Attached garage; Driveway; Three parking spaces (garage total 3)
- Utilities: Public/district water; Public sewer; Standard electricity; Natural gas available; Cable available; Telephone to the street
- Home design: Two-story house; Entry on main floor; No ADU
- Construction: Property listed as fixer condition; Year built source: assessor
- Exterior features: House structure; Patio present; No pool; Property has a view; Lot characterized as 0–1 unit/acre; Paved road frontage with access via city streets; Street lighting and sidewalks in the community
Interior
- Kitchen: Microwave; Gas range; Dishwasher
- Bedrooms: Main floor primary bedroom; Additional main floor bedroom
- Bathrooms: Three full bathrooms; Bathrooms include bathtub and shower; at least one has shower-in-tub
- Heating & cooling: Central furnace heating; Central air conditioning
- Interior features: Double-pane windows; Home has two levels; Main-floor entry; Main floor includes a primary bedroom; Main level has one bathroom; Kitchen open to family room; Loft; No accessibility features specified
- Laundry & utility: Laundry area located in the garage
Neighborhood map
What this means for you Summary
Snapshot
- This is a 3-bed/3.0-bath single-family listed at $250k.
Deal economics
- At list price, monthly cash flow is $605 ($7k/yr) — positive.
- The deal already cash-flows at list — no discount required.
- Meets the 1% rule at list price ($3k rent vs $250k).
- Recommended offer: $246k (1.5% below list) — sets the bar for market timing.
- Cap rate 9.2% vs local median 4.3% in Lancaster — top-decile yield for the area; either an underpriced asset or a hidden risk that comps aren't pricing in. Stress-test before assuming the spread holds.
Location & tenants
- Location reads 68/100 on livability (#282 in CA) — a middle-class / working-renter tenant base. Strengths: commute A+, housing A+, amenities B+; Watch: health & safety C-, schools F, crime F.
- Eastside Union Elementary (suburban): math 15% / reading 27% proficiency, ranked #1,226 of 1,400 in CA (top 88%) — low school quality limits family demand, transient renter base, plan for 1-2y turnover; 76% free/reduced lunch — lower-income household profile, screen leases tightly.
- Market conditions: Rents flat; 1169 active listings in the ZIP; 11 comparable units currently listed for rent nearby; rentals leasing fast (median 3d on market — plan ~1-2 weeks tenant-placement turnaround); 19,697 units permitted in Los Angeles County in 2024 (9,426 in 5+ unit buildings).
- At $3,206/mo this rent would consume 55% of the median local household income ($70k/yr) (locally 2494% of renters already pay >50% of income on rent) — very limited rent-growth headroom before tenants either downsize or default.
Forward outlook
- Local home prices are declining (-3.0%/yr); year-one equity from $2k of loan paydown is wiped out by about $8k of value loss. Plan a longer hold.
- Los Angeles County population projected at +9% by 2050 — modest demand growth; plan on rents tracking national, not racing it.
Negotiation context
- It's been on market 16 days — a 2% lower offer ($246k) is reasonable based on typical stale-listing flexibility.
- 10 sale attempts since 19y ago with the ask held roughly flat each time — persistent listings suggest the price (not the market) is what's stuck; bring a comps-based counter.
Risks & watch-outs
- Climate carrying-cost: moderate wildfire risk; extreme-heat days projected 7→19/yr by 2055 (HVAC capex compounding) — expect insurance premiums to compound above CPI over the hold.
Questions for the listing agent
- Is there a deadline driving the sale (1031 exchange, divorce, estate, relocation)? That informs how much negotiation room exists.
- Schools are F-rated, which usually means shorter tenancies and higher turnover. Who's the typical renter profile here, and what's been the actual vacancy rate?
- Crime grade is F in this area — have there been break-ins, vandalism, or insurance claims at this property in the last 3 years? What carrier currently insures it and at what premium?
- What's the average days-on-market for RENTAL listings here right now (not sales)? A rising rental-DOM trend means longer vacancies and softer asking-rent achievability than the comps imply.
- What's the recent tenant-quality profile in this submarket — average credit score on applications, eviction rate, late-payment / NSF rate, and stable-employment percentage? A property-management company in the area should have these aggregated.
- How much new for-sale + rental construction is in the pipeline within 1–3 miles? Heavy new supply typically softens prices + rents 12–24 months out; constrained supply supports both.
Investment metrics
- 1% rule
- 1.28% ✓
- Cap rate
- 9.20%
- Cash-on-cash
- 10.38%
- DSCR
- 1.46
- GRM
- 6.5
CMA / ARV
- ARV (on-the-fly)
- $531,702
- Comps found
- 12
Show comp detail 12 sales within ~0.75 mi
| Address | Dist | Beds/Ba | Sqft | Sold | Price | $/sf | Match |
|---|---|---|---|---|---|---|---|
| 2133 Kettering St | 0.07mi | 4/3.0 (+1) | 2,667 (+9%) | 2mo | $605,000 | $227 | 74 |
| 45116 Price Ln | 0.15mi | 4/3.0 (+1) | 2,167 (-11%) | 5mo | $459,000 | $212 | 65 |
| 45056 Price Ln | 0.10mi | 4/3.0 (+1) | 2,167 (-11%) | 11mo | $479,900 | $221 | 63 |
| 45111 25th St E Unit E | 0.41mi | 4/2.5 (+1) | 2,346 (-4%) | 7mo | $288,000 | $123 | 62 |
| 2159 E Newgrove St | 0.39mi | 4/2.0 (+1) | 2,336 (-4%) | 6mo | $500,000 | $214 | 61 |
| 44755 22nd St E | 0.33mi | 3/2.0 | 2,179 (-11%) | 6mo | $411,000 | $189 | 58 |
| 44559 Aspen St | 0.53mi | 4/4.0 (+1) | 2,375 (-3%) | 5mo | $499,000 | $210 | 57 |
| 44641 Driftwood St | 0.46mi | 4/2.5 (+1) | 2,249 (-8%) | 8mo | $490,000 | $218 | 52 |
| 45015 Bevington | 0.52mi | 4/3.0 (+1) | 2,160 (-11%) | 6mo | $500,000 | $231 | 47 |
| 45117 Loma Vista Dr | 0.59mi | 4/3.0 (+1) | 2,160 (-11%) | 7mo | $400,000 | $185 | 43 |
| 1818 E Newgrove St | 0.44mi | 4/3.0 (+1) | 2,094 (-14%) | 13mo | $475,000 | $227 | 40 |
| 2307 E Nugent St | 0.59mi | 4/3.0 (+1) | 2,100 (-14%) | 15mo | $472,000 | $225 | 32 |
Match score weights: distance 35% · size 25% · config 20% · recency 20%. Top-matched comps best support the ARV.
Projected returns pro-forma
-3.0% appreciation · 0.14% rent growth · sell at horizon
- IRR
- -4.2%
- Equity multiple
- 0.85×
- Total profit
- $-10,749
- Equity at exit
- $37,276
- IRR
- 1.5%
- Equity multiple
- 1.09×
- Total profit
- $6,228
- Equity at exit
- $21,615
Cash invested: $70,000 (down + closing). Projections, not guarantees.
Landlord ↔ Tenant lean methodology
- Overall (STATE)
- 18 Strongly Tenant-Friendly
- State California
- 18 Strongly Tenant-Friendly · D+13
- County
- — inherits STATE
- City
- — inherits STATE
ZIP-level market 93535
- Home prices YoY
- -24.3%
- Rents YoY
- 0.1%
- Active inventory
- 1169
- Price-to-rent
- 6.5×
Monthly cashflow live
- Estimated rent
- $3,206 high interval (Pro) →
- Mortgage (P&I)
- −$1,311
- Tax from tax record
- −$512 /mo · $6,145/yr
- Insurance
- −$104
- HOA
- −$0
- Vacancy / Maint / Mgmt
- −$673
- Net cashflow
- $605
Break-even live
UW: 25.0% down · 7.5% · 30yr · 1.5% tax · 5.0% vac · 8.0% maint · 8.0% mgmt
Financing live
Cash to close
- Down payment
- $62,500
- Closing costs
- $7,500
- Reserves months
- —
- Total cash needed
- —
Loan-product check · same deal, 3 products live
Conventional
25% down · 7.5% · 30yr
- Down + closing
- —
- Monthly P&I
- —
- Monthly cashflow
- —
- DSCR
- —
- Eligible?
- —
Personal DTI + credit; lowest rate.
DSCR
20% down · 8.5% · 30yr
- Down + closing
- —
- Monthly P&I
- —
- Monthly cashflow
- —
- DSCR
- —
- Eligible?
- —
No personal income docs; deal must DSCR.
Hard money
10% down · 12.0% · 12mo
- Down + closing
- —
- Monthly P&I
- —
- Monthly cashflow
- —
- DSCR
- —
- Eligible?
- —
Short-term bridge; refi at stabilization.
Rent comps 11 comps
| Address | Beds | Baths | Sqft | Rent | $/sqft | DOM | Units | Dist |
|---|---|---|---|---|---|---|---|---|
| 2141 E Nugent St Lancaster, CA | 4.0 | 3.0 | 2260 | $3,200 | $1.42 | 18d | 1 | 0.53mi |
| 44559 Aspen St Lancaster, CA | 4.0 | 4.0 | 2375 | $3,495 | $1.47 | 4d | 1 | 0.55mi |
| 44707 Cerisa St Lancaster, CA | 4.0 | 2.0 | 1714 | $3,000 | $1.75 | 10d | 1 | 0.62mi |
| 2634 Avoca St Lancaster, CA | 4.0 | 3.0 | 1722 | $3,200 | $1.86 | 1d | 1 | 0.64mi |
| 45465 25th St E Spc 10 Lancaster, CA | 3.0 | 2.0 | 1690 | $825 | $0.49 | 2d | 1 | 0.67mi |
| 1253 Morven St Lancaster, CA | 4.0 | 2.0 | 1813 | $2,995 | $1.65 | 15d | 1 | 0.97mi |
| 1545 E Avenue J5 Lancaster, CA | 3.0 | 2.0 | 1741 | $2,899 | $1.67 | 1d | 1 | 1.19mi |
| 2739 Garnet Ln Lancaster, CA | 3.0 | 2.5 | 2548 | $3,100 | $1.22 | 1d | 1 | 1.21mi |
| 3060 Emerald Ln Lancaster, CA | 4.0 | 2.0 | 2540 | $3,500 | $1.38 | 1d | 1 | 1.31mi |
| 3344 E Avenue H14 Lancaster, CA | 3.0 | 2.0 | 2032 | $3,200 | $1.57 | 2d | 1 | 1.39mi |
| 4364 East Avenue J6 Unit J6 Lancaster, CA | 4.0 | 3.0 | 2020 | $3,000 | $1.49 | 5d | 1 | 1.41mi |
Listing history 12 events
-
2026-06-18days on market $250,000 Active 16 DOM
-
2026-06-17days on market $250,000 Active 15 DOM
-
2026-06-15days on market $250,000 Active 14 DOM
-
2026-06-13days on market $250,000 Active 12 DOM
-
2026-06-13days on market $250,000 Active 11 DOM
-
2026-06-09days on market $250,000 Active 8 DOM
-
2026-06-08days on market $250,000 Active 7 DOM
-
2026-06-07days on market $250,000 Active 6 DOM
-
2026-06-04days on market $250,000 Active 3 DOM
-
2026-06-03days on market $250,000 Active 2 DOM
-
2026-06-02remarks 158-char remark
-
2026-06-02$250,000 Active 1 DOM
ⓘ Source: listings_history table (triggers on properties + properties_extension) + one-shot
backfill from property_details.listing_events for pre-trigger history.
Tax reassessment forecast CA · Resets to sale price
- Current annual tax
- $6,145 · $512/mo
- Projected year-2 tax
- $6,145 · $512/mo
- Expected delta
- $0/yr ($0/mo · 0.0%)
ⓘ Screening estimate from a state-policy table — verify with the county assessor before closing.
Climate risk First Street
- Flood 1/10 Low FEMA zone X (shaded) · 0% chance over 30 yrs
- Wildfire 5/10 Major
- Heat 7/10 Severe 7 d/yr ≥101°F today · 19 d/yr by 30 yrs out
- Wind 1/10 Low
- Air quality 8/10 Severe 16 unhealthy d/yr today · 21 by 30 yrs out
Nearby sold comps map
Loading sold comps map…
Walkable amenities ~0.75 mi
Loading nearby amenities…
Taxation est. · year 1
- Rental income
- $38,471
- − Mortgage interest
- −$14,004
- − Property taxes
- −$6,145
- − Insurance
- −$1,250
- − Repairs & maintenance
- −$3,078
- − Management
- −$3,078
- − Depreciation
- −$7,273
- Taxable income
- $3,644
- Est. tax owed @ 24.0%
- −$875
- After-tax cash flow
- $6,390/yr
For passive investors: Depreciation is non-cash, so a rental often shows a tax loss while cash-flowing — sheltering income. Rental losses are passive: they offset passive income freely, and up to $25,000/yr can offset ordinary (W-2) income if you actively participate and your MAGI is under $100k (phasing out to $0 by $150k); unused losses carry forward. On sale, claimed depreciation is recaptured at up to 25%, and gains may owe capital-gains tax (a 1031 exchange can defer both). Figures are a year-1 estimate at your 24.0% rate — not tax advice; consult a CPA.
Schools (NCES district)
- District
- Eastside Union Elementary
- NCES district ID
- 0611910
- Math proficiency
- 15% ▲ 1.00%
- Reading proficiency
- 27% ▲ 3.00%
- Median HH income
- $44,840
- Composite
- 21.43/100
- National rank
- #13636
- State rank
- #1226 of 1400 in CA
Livability — Lancaster
- Score
- 68/100
- State rank
- #282
- US rank
- #9504
Category grades
Schools grade is shown separately in the Schools card above.
Census & demographics
- Census place
- Lancaster, CA
- County
- Los Angeles County · 9,444,647 people
- City population
- 194,251
- Metro
- Los Angeles-Long Beach-Anaheim, CA
- Population (ZIP)
- 79,409
- Household income
- $70,360
- Rent vs Own
- Severe rent burden
- 2494.0
Population outlook (Los Angeles County) Hauer SSP2
- Today (2025)
- 10,940,515 people
- By 2030
- 11,256,481 · +2.9%
- By 2040
- 11,729,929 · +7.2%
- By 2050
- 11,948,407 · +9.2%
- By 2075
- 11,818,114 · +8.0%
- By 2100
- 10,842,928 · -0.9%
Race, ethnicity, and origin ACS 2023
- Neighborhood character
- Diverse neighborhood (Simpson 0.63)
- Race & ethnicity
- Hispanic / Latino 55% Two or more races 25% Black 21% White 17% Asian 2% Native American 1%
- Hispanic origin (detail)
- Mexican 42%
- Common ancestry
- Romanian 1% Italian 1% Lithuanian 1%
- Foreign-born
- 13% · Canada
- Languages at home
- 60% English-only · Spanish 37% Tagalog/Filipino 1% Other Indo-European 1%
Political lean MEDSL · Los Angeles
- 2024 margin
- Solid D (+32.9) · D 64.8% · R 31.9% · Other 3.3%
- 2008→2024 swing
- -7.4pp toward R · 2008: 40.4pp · 2024: 32.9pp
- All cycles
- 2024: D+32.9 2020: D+44.2 2016: D+48.0 2012: D+40.0 2008: D+40.4
Not yet ingested
- Civics
- —
Market trends
- HPI YoY
- ▼ -144.13%
- Current HPI
- 449.4494
- Rent YoY
- ▲ 0.14%
- Metro
- Los Angeles-Long Beach-Anaheim, CA
- State GDP YoY
- ▲ 3.21%
- F500 in state
- 116
Industry mix (Fortune 500 HQ in CA)
| Industry | F500 HQs | Revenue |
|---|---|---|
| Technology | 27 | $1,492B |
|
||
| Financial Services | 3 | $174B |
|
||
| Retail | 3 | $44B |
|
||
| Insurance | 3 | $26B |
|
||
| Media / Entertainment | 2 | $115B |
|
||
| Pharmaceuticals / Biotech | 2 | $62B |
|
||
Price history
-25.6% since first listed30 events — show timeline
- 2026-06-01 Listed $250,000 CRMLS
- 2018-10-26 Sold (Public Records) $325,000 Public Records
- 2018-10-26 Sold (MLS) $325,000 CRMLS
- 2018-10-26 Sold (MLS) $325,000 AVMLS
- 2018-09-27 Pending — CRMLS
- 2018-09-27 Pending — AVMLS
- 2018-09-20 Price Changed $314,999 AVMLS
- 2018-09-20 Price Changed $314,999 CRMLS
- 2018-08-21 Listed $329,999 CRMLS
- 2018-08-21 Listed $329,999 AVMLS
- 2015-03-27 Listing Removed — AVMLS
- 2010-12-24 Sold (MLS) $123,500 AVMLS
- 2010-06-02 Listed $164,900 AVMLS
- 2010-03-17 Listing Removed — CRMLS
- 2010-02-23 Price Changed $155,000 CRMLS
- 2010-01-18 Relisted — CRMLS
- 2009-10-23 Pending — CRMLS
- 2009-10-23 Price Changed $130,000 CRMLS
- 2009-07-25 Listing Removed — CRMLS
- 2009-06-03 Listed $79,000 CRMLS
- 2009-06-03 Listed $79,000 AVMLS
- 2009-02-25 Listing Removed — CRMLS
- 2009-02-20 Listed $250,000 CRMLS
- 2008-06-06 Sold (MLS) $336,000 AVMLS
- 2008-05-15 Sold (MLS) $324,990 CRMLS
- 2008-04-13 Listing Removed — CRMLS
- 2008-02-20 Price Changed $315,900 CRMLS
- 2007-12-01 Price Changed $349,990 CRMLS
- 2007-09-08 Listed $379,990 CRMLS
- 2007-03-13 Listed $336,000 AVMLS
Property tax history
+12.5%/yrLatest (2025): $6,145 · +5.2% YoY. Source: county tax records.
Cash-flow waterfall
monthlySold comps — $/sqft
last 12 mo · ≤1 miLoading sold comps…