4418 Tiger Oak Ct · Pace, FL
Flood risk 1/10 · Minimal
- FEMA flood zone
- X (unshaded)
- Chance of flooding over 30 yrs
- 0.0%
- Est. flood insurance / yr
- $507 – $1,088
Fire risk 4/10 · Minor
- Est. fire insurance / yr
- $947 – $1,759
Heat risk 9/10 · Severe
- Hot days now (above 105°F)
- 6 days/yr
- Hot days in 30 yrs
- 19 days/yr
Wind risk 9/10 · Severe
- Chance of severe wind over 30 yrs
- 99.0%
Air-quality risk 1/10 · Minimal
- Unhealthy air days now
- 0 days/yr
- Unhealthy air days in 30 yrs
- 0 days/yr
Risk factors via First Street. Map © Google.
Why this score? — see what drove the D grade
The composite is a weighted blend of 9 inputs, each scored 0–100. Each bar is that input's sub-score; the figure is the points it added to the 100-point composite (weight × sub-score).
- Cash flow +11.6/30.0
- ARV discount +8.0/15.0
- Schools +5.3/10.0
- Livability +3.5/5.0
- DSCR +3.4/10.0
- Rent growth +3.2/5.0
- 1% rule +2.9/10.0
- Condition / age +2.5/5.0
- Appreciation +0.0/10.0
$274,900
🖨 Deal sheet (PDF) 📄 Offer letter ✓ Due diligence
Listing remarks MLS
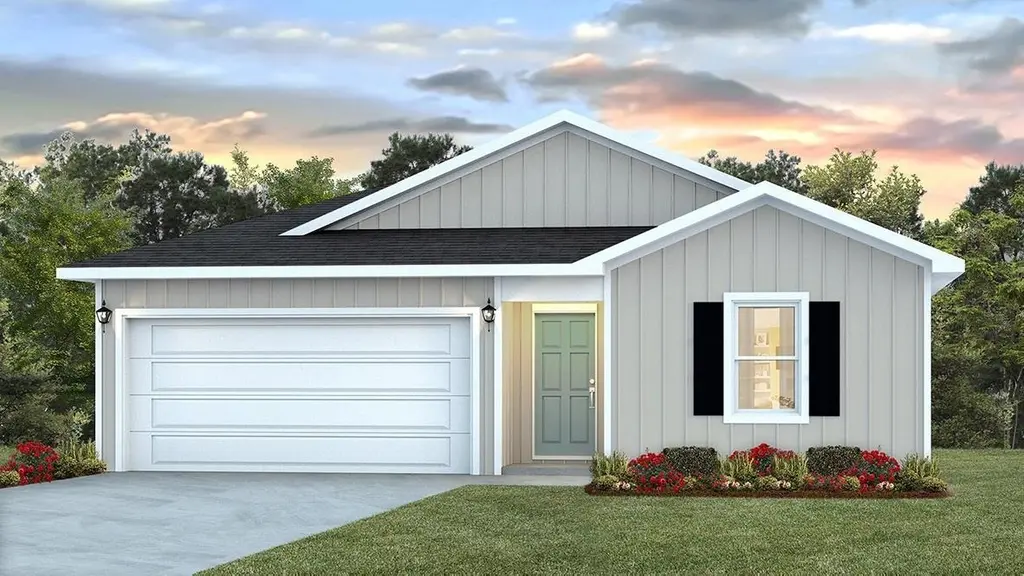
Welcome to Woodlands! The Freeport is a cozy 4 bed, 2 bath open floorplan with 2 car garage. The kitchen overlooks the spacious living room and features a large island, pantry, beautiful countertops, and all stainless-steel appliances. Bedroom 1 is situated just off the living room with a bath and walk-in closet. This home comes standard with a Smart Home Technology package which includes a KwikSet keyless entry, Skybell doorbell, automated front porch lighting, an Echo Dot device, and Quolsys touch panel which can be used to control your lighting, thermostat, front door and so much more. Woodland's proximity to I-10 will give you quick access to Pace's neighboring cities, Pensacola and Crestview.
Key facts
- 5,662 sq ft lot
- 2 garage spots
- Built 2023
Property features AI
Finance
- Other: Directions: Bell Ln to Red Cedar Rd, west on Red Cedar Rd, right on Tiger Oak Ct for 0.1 mile; home will be on the right
- HOA & community: Homeowners association with an annual fee of $350 (covers association services)
Exterior
- Parking: Total of 4 parking spaces; 2-car attached garage; 2 covered parking spaces; Front entrance and garage door opener
- Security: Smoke detectors
- Utilities: Public sewer; Copper wiring with circuit breakers; Cable available; Underground utilities
- Home design: Single-story home; Resale property; Not attached to other properties; Green features include insulation, insulated walls, and energy-efficient appliances
- Construction: Frame construction; Shingle gable roof; Slab foundation; Built as a one-level structure
- Exterior features: Privacy fencing in the backyard; Cul-de-sac location; Interior lot; Paved, county-maintained road; Picnic area and sidewalks in the community
Interior
- Kitchen: Built-in microwave; Dishwasher (ENERGY STAR qualified); Disposal; Refrigerator (ENERGY STAR qualified); Electric water heater
- Bedrooms: Primary bedroom on the first floor (approx. 12 x 13)
- Bathrooms: 2 full bathrooms; Bathrooms not updated
- Heating & cooling: Central heating; Central air; Ceiling fans for additional cooling; ENERGY STAR qualified equipment
- Interior features: Baseboards; Ceiling fan(s); High ceilings; High-speed internet; Smart thermostat; Insulated doors; Storm door(s); Double-pane windows; Blinds; Shutters; Smoke detector(s)
- Laundry & utility: Washer and dryer included; Inside laundry with washer/dryer hookups
Neighborhood map
What this means for you Summary
Snapshot
- This is a 4-bed/2.0-bath single-family listed at $275k.
Deal economics
- At list price, monthly cash flow is $-85 ($-1k/yr) — negative.
- To cash-flow at today's rent, offer at most $260k (5.4% below list).
- To meet the 1% rule (rent ≥ 1% of price), the offer needs to be $218k (20.5% below list).
- Recommended offer: $218k (20.5% below list) — sets the bar for 1% rule.
- Cap rate 5.9% vs local median 4.4% in Pace — top-decile yield for the area; either an underpriced asset or a hidden risk that comps aren't pricing in. Stress-test before assuming the spread holds.
Location & tenants
- Location reads 69/100 on livability (#475 in FL) — a middle-class / working-renter tenant base. Strengths: cost of living A+, housing A+, crime B; Watch: amenities F, commute F, health & safety F.
- Santa Rosa (suburban): math 63% / reading 60% proficiency, ranked #8 of 73 in FL (top 11%) — acceptable for families but not a draw, mixed tenant base, ~2y average lease.
- Zoned schools: Pea Ridge Elementary School (math 57% / reading 55%, grade C+, #832 of 2,144 statewide, top 40%, 837 students, 60% FRL); Pace High School (math 63% / reading 62%, grade B-, #93 of 667 statewide, top 14%, 2,240 students, 34% FRL).
- Market conditions: Rents rising (+2.7%/yr); 674 active listings in the ZIP; 16 comparable units currently listed for rent nearby; rentals at typical pace (median 25d on market — plan ~3-4 weeks tenant-placement turnaround); solid renter incomes; 1,983 units permitted in Santa Rosa County in 2024 (128 in 5+ unit buildings).
Forward outlook
- Local home prices are declining (-3.0%/yr); year-one equity from $2k of loan paydown is wiped out by about $8k of value loss. Plan a longer hold.
- Santa Rosa County population projected at +31% by 2050 — long-run rental-demand tailwind backs the buy-and-hold thesis.
Negotiation context
- It's been on market 15 days — a 2% lower offer ($271k) is reasonable based on typical stale-listing flexibility.
Risks & watch-outs
- Climate carrying-cost: severe wind risk, 99% chance of damaging wind over 30y; extreme-heat days projected 6→19/yr by 2055 (HVAC capex compounding) — expect insurance premiums to compound above CPI over the hold.
Questions for the listing agent
- What do current leases actually rent for vs. the listed asking? Can we see a recent rent roll and the last 12 months of T-12 income?
- What does the HOA fee cover, when was the last increase, and are there any pending special assessments or reserve-fund shortfalls?
- Is there a deadline driving the sale (1031 exchange, divorce, estate, relocation)? That informs how much negotiation room exists.
- Schools are B-rated — typically a magnet for longer-tenancy family renters. What's the average tenant stay here, and is there a school-zone premium baked into asking?
- The area grade is low — what's the realistic commute time and amenity access for the typical tenant pool here? Any planned neighborhood developments (good or bad) we should know about?
- What's the average days-on-market for RENTAL listings here right now (not sales)? A rising rental-DOM trend means longer vacancies and softer asking-rent achievability than the comps imply.
- What's the recent tenant-quality profile in this submarket — average credit score on applications, eviction rate, late-payment / NSF rate, and stable-employment percentage? A property-management company in the area should have these aggregated.
- How much new for-sale + rental construction is in the pipeline within 1–3 miles? Heavy new supply typically softens prices + rents 12–24 months out; constrained supply supports both.
Investment metrics
- 1% rule
- 0.79% ✗
- Cap rate
- 5.92%
- Cash-on-cash
- -1.32%
- DSCR
- 0.94
- GRM
- 10.5
CMA / ARV
- ARV (on-the-fly)
- $277,780
- Comps found
- 12
Show comp detail 12 sales within ~0.75 mi
| Address | Dist | Beds/Ba | Sqft | Sold | Price | $/sf | Match |
|---|---|---|---|---|---|---|---|
| 5746 Peach Dr | 0.22mi | 3/2.0 (-1) | 1,475 (+1%) | 12mo | $283,000 | $192 | 73 |
| 5684 Peach Dr | 0.22mi | 3/2.0 (-1) | 1,555 (+6%) | 2mo | $280,000 | $180 | 72 |
| 4335 Redbay Ct | 0.21mi | 4/2.0 | 1,387 (-5%) | 15mo | $267,000 | $193 | 69 |
| 4356 Thistle Pine Ct | 0.31mi | 3/2.0 (-1) | 1,475 (+1%) | 15mo | $291,000 | $197 | 67 |
| 4806 Landmark Ln | 0.34mi | 3/2.0 (-1) | 1,454 (-0%) | 15mo | $175,000 | $120 | 66 |
| 5451 Peach Dr | 0.21mi | 3/2.0 (-1) | 1,633 (+12%) | 2mo | $294,900 | $181 | 64 |
| 5612 Peach Dr | 0.29mi | 3/2.0 (-1) | 1,318 (-10%) | 2mo | $250,000 | $190 | 63 |
| 5051 Hartley Dr | 0.56mi | 3/2.0 (-1) | 1,500 (+3%) | 3mo | $320,000 | $213 | 62 |
| 5081 Covington Dr | 0.61mi | 3/2.0 (-1) | 1,496 (+2%) | 2mo | $245,000 | $164 | 61 |
| 5045 Hartley Dr | 0.55mi | 3/2.0 (-1) | 1,500 (+3%) | 6mo | $320,000 | $213 | 60 |
| 5003 Covenant Cir | 0.51mi | 3/2.0 (-1) | 1,490 (+2%) | 13mo | $278,000 | $187 | 57 |
| 5535 Peach Dr | 0.29mi | 3/2.0 (-1) | 1,318 (-10%) | 11mo | $249,000 | $189 | 56 |
Match score weights: distance 35% · size 25% · config 20% · recency 20%. Top-matched comps best support the ARV.
Projected returns pro-forma
-3.0% appreciation · 2.72% rent growth · sell at horizon
- IRR
- -18.8%
- Equity multiple
- 0.34×
- Total profit
- $-50,566
- Equity at exit
- $40,988
- IRR
- -11.8%
- Equity multiple
- 0.30×
- Total profit
- $-53,558
- Equity at exit
- $23,768
Cash invested: $76,972 (down + closing). Projections, not guarantees.
Landlord ↔ Tenant lean methodology
- Overall (STATE)
- 87 Strongly Landlord-Friendly
- State Florida
- 87 Strongly Landlord-Friendly · R+3
- County
- — inherits STATE
- City
- — inherits STATE
ZIP-level market 32571
- Home prices YoY
- -17.7%
- Rents YoY
- 2.7%
- Active inventory
- 674
- Price-to-rent
- 10.5×
Monthly cashflow live
- Estimated rent
- $2,185 high interval (Pro) →
- Mortgage (P&I)
- −$1,442
- Tax from tax record
- −$225 /mo · $2,705/yr
- Insurance
- −$115
- HOA
- −$29
- Vacancy / Maint / Mgmt
- −$459
- Net cashflow
- $-85
Break-even live
Sensitivity live
| Price | -10% $71 | -5% $-7 | +0% $-85 | +5% $-162 | +10% $-240 |
|---|---|---|---|---|---|
| Rent | -10% $-257 | -5% $-171 | +0% $-85 | +5% $2 | +10% $88 |
| Rate | -1.0pp $54 | -0.5pp $-15 | base $-85 | +0.5pp $-156 | +1.0pp $-228 |
UW: 25.0% down · 7.5% · 30yr · 1.5% tax · 5.0% vac · 8.0% maint · 8.0% mgmt
Financing live
Cash to close
- Down payment
- $68,725
- Closing costs
- $8,247
- Reserves months
- —
- Total cash needed
- —
Loan-product check · same deal, 3 products live
Conventional
25% down · 7.5% · 30yr
- Down + closing
- —
- Monthly P&I
- —
- Monthly cashflow
- —
- DSCR
- —
- Eligible?
- —
Personal DTI + credit; lowest rate.
DSCR
20% down · 8.5% · 30yr
- Down + closing
- —
- Monthly P&I
- —
- Monthly cashflow
- —
- DSCR
- —
- Eligible?
- —
No personal income docs; deal must DSCR.
Hard money
10% down · 12.0% · 12mo
- Down + closing
- —
- Monthly P&I
- —
- Monthly cashflow
- —
- DSCR
- —
- Eligible?
- —
Short-term bridge; refi at stabilization.
Rent comps 16 comps
| Address | Beds | Baths | Sqft | Rent | $/sqft | DOM | Units | Dist |
|---|---|---|---|---|---|---|---|---|
| 4328 Tiger Oak Ct Milton, FL | 4.0 | 2.0 | 1347 | $1,850 | $1.37 | 25d | 1 | 0.07mi |
| 4407 White Cedar Ct Milton, FL | 4.0 | 2.0 | 1827 | $1,925 | $1.05 | 25d | 1 | 0.10mi |
| 4384 White Cedar Ct Milton, FL | 4.0 | 2.0 | 1827 | $2,100 | $1.15 | 25d | 1 | 0.11mi |
| 4383 Winged Elm Ct Milton, FL | 4.0 | 2.0 | 1787 | $2,050 | $1.15 | 25d | 1 | 0.11mi |
| 5240 Peach Dr Unit NA Milton, FL | 4.0 | 2.0 | 1800 | $2,175 | $1.21 | 25d | 1 | 0.13mi |
| 5418 Peach Dr Milton, FL | 3.0 | 2.0 | 1611 | $2,100 | $1.30 | 25d | 1 | 0.15mi |
| 5574 Peach Dr Milton, FL | 3.0 | 2.0 | 1475 | $1,900 | $1.29 | 25d | 1 | 0.27mi |
| 5508 Peach Dr Milton, FL | 3.0 | 2.0 | 1764 | $2,500 | $1.42 | 25d | 1 | 0.30mi |
| 4025 Brittany Ln Milton, FL | 3.0 | 2.0 | 1405 | $1,725 | $1.23 | 23d | 1 | 0.31mi |
| 5157 Peach Dr Milton, FL | 3.0 | 2.0 | 1788 | $2,100 | $1.17 | 15d | 1 | 0.32mi |
| 4836 Covenant Cir Milton, FL | 3.0 | 2.0 | 1590 | $1,875 | $1.18 | 15d | 1 | 0.46mi |
| 4413 Oak Vista Ln Milton, FL | 1.0–3.0 | 1.0–2.0 | 992 | $2,354 | $2.37 | 15d | 18 | 0.49mi |
| 5061 Peach Dr Milton, FL | 3.0 | 2.5 | 1581 | $1,850 | $1.17 | 25d | 1 | 0.55mi |
| 5320 Cornwall Dr Milton, FL | 3.0 | 2.0 | 1703 | $2,200 | $1.29 | 15d | 1 | 1.22mi |
| 4933 Bell Ridge Ln Milton, FL | 1.0–3.0 | 1.0–2.0 | 865 | $1,437 | $1.66 | 15d | 8 | 1.30mi |
| 4496 Fiske St Milton, FL | 3.0 | 2.0 | 1418 | $1,850 | $1.30 | 15d | 1 | 1.33mi |
HOA detail
- Monthly dues
- $29 · $348/yr
Listing history 13 events
-
2026-06-22days on market $274,900 Active 15 DOM
-
2026-06-18days on market $274,900 Active 12 DOM
-
2026-06-17days on market $274,900 Active 11 DOM
-
2026-06-16remarks 699-char remark
-
2026-06-16days on market $274,900 Active 10 DOM
-
2026-06-15days on market $274,900 Active 9 DOM
-
2026-06-14days on market $274,900 Active 7 DOM
-
2026-06-10days on market $274,900 Active 4 DOM
-
2026-06-09days on market $274,900 Active 3 DOM
-
2026-06-08days on market $274,900 Active 2 DOM
-
2026-06-07status $274,900 Active 1 DOM
-
2026-06-05remarks 693-char remark
-
2026-06-05$274,900 Coming Soon 1 DOM
ⓘ Source: listings_history table (triggers on properties + properties_extension) + one-shot
backfill from property_details.listing_events for pre-trigger history.
Tax reassessment forecast FL · Resets to sale price
- Current annual tax
- $2,705 · $225/mo
- Projected year-2 tax
- $2,705 · $225/mo
- Expected delta
- $0/yr ($0/mo · 0.0%)
ⓘ Screening estimate from a state-policy table — verify with the county assessor before closing.
Climate risk First Street
- Flood 1/10 Low FEMA zone X (unshaded) · 0% chance over 30 yrs
- Wildfire 4/10 Moderate
- Heat 9/10 Extreme 6 d/yr ≥105°F today · 19 d/yr by 30 yrs out
- Wind 9/10 Extreme 99% chance of damaging wind over 30 yrs
- Air quality 1/10 Low 0 unhealthy d/yr today · 0 by 30 yrs out
Nearby sold comps map
Loading sold comps map…
Walkable amenities ~0.75 mi
Loading nearby amenities…
Taxation est. · year 1
- Rental income
- $26,218
- − Mortgage interest
- −$15,399
- − Property taxes
- −$2,705
- − Insurance
- −$1,374
- − Repairs & maintenance
- −$2,097
- − Management
- −$2,097
- − HOA
- −$348
- − Depreciation
- −$7,997
- Taxable loss
- −$5,800
- Est. tax savings @ 24.0%
- +$1,392
- After-tax cash flow
- $378/yr
For passive investors: Depreciation is non-cash, so a rental often shows a tax loss while cash-flowing — sheltering income. Rental losses are passive: they offset passive income freely, and up to $25,000/yr can offset ordinary (W-2) income if you actively participate and your MAGI is under $100k (phasing out to $0 by $150k); unused losses carry forward. On sale, claimed depreciation is recaptured at up to 25%, and gains may owe capital-gains tax (a 1031 exchange can defer both). Figures are a year-1 estimate at your 24.0% rate — not tax advice; consult a CPA.
Schools (NCES district)
- District
- Santa Rosa
- NCES district ID
- 1201650
- Math proficiency
- 63% ▼ -6.00%
- Reading proficiency
- 60% ▼ -5.00%
- Median HH income
- $58,161
- Composite
- 53.12/100
- National rank
- #1511
- State rank
- #8 of 73 in FL
Livability — Pace
- Score
- 69/100
- State rank
- #475
- US rank
- #8593
Category grades
Schools grade is shown separately in the Schools card above.
Census & demographics
- County
- Santa Rosa County · 194,764 people
- City population
- 42,171
- Metro
- Pensacola-Ferry Pass-Brent, FL
- Population (ZIP)
- 42,171
- Household income
- $87,617
- Rent vs Own
- Severe rent burden
- 301.0
Population outlook (Santa Rosa County) Hauer SSP2
- Today (2025)
- 195,978 people
- By 2030
- 209,782 · +7.0%
- By 2040
- 235,293 · +20.1%
- By 2050
- 256,408 · +30.8%
- By 2075
- 298,074 · +52.1%
- By 2100
- 303,216 · +54.7%
Race, ethnicity, and origin ACS 2023
- Neighborhood character
- Predominantly White (80%)
- Race & ethnicity
- White 80% Two or more races 9% Hispanic / Latino 6% Black 4% Asian 2%
- Hispanic origin (detail)
- Mexican 3%
- Common ancestry
- Lithuanian 4% Italian 3% Slovak 2%
- Foreign-born
- 6% · Canada, South Korea
- Languages at home
- 93% English-only · Spanish 2% Other Indo-European 1% Russian/Polish/Slavic 1%
Political lean MEDSL · Santa Rosa
- 2024 margin
- Solid R (+51.0) · D 24.1% · R 75.0%
- 2008→2024 swing
- -3.0pp toward R · 2008: -47.9pp · 2024: -51.0pp
- All cycles
- 2024: R+51.0 2020: R+46.5 2016: R+53.5 2012: R+52.6 2008: R+47.9
Not yet ingested
- Civics
- —
Market trends
- HPI YoY
- ▼ -62.39%
- Current HPI
- 290.2953
- Rent YoY
- ▲ 2.72%
- Metro
- Pensacola-Ferry Pass-Brent, FL
- State GDP YoY
- ▲ 3.28%
- F500 in state
- 36
Industry mix (Fortune 500 HQ in FL)
| Industry | F500 HQs | Revenue |
|---|---|---|
| Industrial Technology | 2 | $29B |
|
||
| Insurance | 2 | $17B |
|
||
| Retail | 1 | $60B |
|
||
| Technology Distribution | 1 | $58B |
|
||
| Homebuilding | 1 | $35B |
|
||
| Technology Manufacturing | 1 | $35B |
|
||
Price history
-7.7% since first listed5 events — show timeline
- 2026-06-03 Coming Soon $274,900 PARMLS
- 2023-07-31 Sold (MLS) $296,325 PARMLS
- 2023-06-07 Pending — PARMLS
- 2023-06-04 Price Changed $298,900 PARMLS
- 2023-04-12 Listed $297,900 PARMLS
Property tax history
+146.5%/yrLatest (2025): $2,705 · -2.8% YoY. Source: county tax records.
Cash-flow waterfall
monthlySold comps — $/sqft
last 12 mo · ≤1 miLoading sold comps…