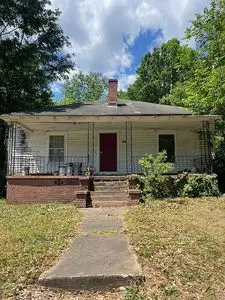
238 Guy Ave NW · Concord, NC
Flood risk 4/10 · Minor
- FEMA flood zone
- X (unshaded)
- Chance of flooding over 30 yrs
- 0.22%
- Est. flood insurance / yr
- $507 – $1,088
Fire risk 1/10 · Minimal
- Est. fire insurance / yr
- $906 – $1,684
Heat risk 6/10 · Moderate
- Hot days now (above 106°F)
- 7 days/yr
- Hot days in 30 yrs
- 17 days/yr
Wind risk 4/10 · Minor
- Chance of severe wind over 30 yrs
- 20.0%
Air-quality risk 3/10 · Minor
- Unhealthy air days now
- 2 days/yr
- Unhealthy air days in 30 yrs
- 5 days/yr
Risk factors via First Street. Map © Google.
Why this score? — see what drove the B grade
The composite is a weighted blend of 9 inputs, each scored 0–100. Each bar is that input's sub-score; the figure is the points it added to the 100-point composite (weight × sub-score).
- Cash flow +30.0/30.0
- DSCR +10.0/10.0
- 1% rule +9.9/10.0
- ARV discount +7.5/15.0
- Schools +4.7/10.0
- Livability +4.0/5.0
- Rent growth +3.3/5.0
- Condition / age +2.5/5.0
- Appreciation +0.0/10.0
$119,999
🖨 Deal sheet 📄 Offer letter ✓ Due diligence
Listing remarks
A true piece of history, this home was originally built in the 1900s. It is in need of some love, care, and repairs. The neighborhood is centrally located, with downtown being less than a 5 minute drive. The backyard includes a screened in porch and privacy from natural growth around the edges of the yard. For sale by owner as is. Property is part of an estate and has been unoccupied for 12 months.
Key facts
- Screened in porch
- Centrally located
- Built 1965
Tags
Neighborhood map
What this means for you Summary
Snapshot
- This is a 2-bed/1.0-bath single-family listed at $120k.
Deal economics
- At list price, monthly cash flow is $622 ($7k/yr) — positive.
- The deal already cash-flows at list — no discount required.
- Meets the 1% rule at list price ($2k rent vs $120k).
- Cap rate 12.5% vs local median 3.3% in Concord — top-decile yield for the area; either an underpriced asset or a hidden risk that comps aren't pricing in. Stress-test before assuming the spread holds.
Location & tenants
- Location reads 81/100 on livability (#18 in NC, #1,595 nationally) — a professional / high-income tenant draw. Strengths: cost of living A+, housing A+, health & safety A+; Watch: schools C-, commute F.
- Cabarrus County Schools (rural): math 54% / reading 55% proficiency, ranked #44 of 178 in NC (top 25%) — acceptable for families but not a draw, mixed tenant base, ~2y average lease.
- Market conditions: Rents rising (+3.2%/yr); 303 active listings in the ZIP; 22 comparable units currently listed for rent nearby; rentals leasing fast (median 12d on market — plan ~1-2 weeks tenant-placement turnaround); solid renter incomes; 2,485 units permitted in Cabarrus County in 2024 (677 in 5+ unit buildings).
Forward outlook
- Local home prices are declining (-3.0%/yr); year-one equity from $829 of loan paydown is wiped out by about $4k of value loss. Plan a longer hold.
- Cabarrus County population projected at +44% by 2050 — long-run rental-demand tailwind backs the buy-and-hold thesis.
- At projected returns (-3.0% appreciation + 3.2% rent growth), your $34k cash investment doubles in ~6 years — after that, you're playing with house money.
Negotiation context
- Only 1 days on market — expect competitive offers; lowballing is unlikely to land.
Risks & watch-outs
- Climate carrying-cost: extreme-heat days projected 7→17/yr by 2055 (HVAC capex compounding) — expect insurance premiums to compound above CPI over the hold.
Questions for the listing agent
- Built in 1965 — when were the roof, HVAC, electrical panel, plumbing, and water heater last replaced?
- Is there a deadline driving the sale (1031 exchange, divorce, estate, relocation)? That informs how much negotiation room exists.
- What's the average days-on-market for RENTAL listings here right now (not sales)? A rising rental-DOM trend means longer vacancies and softer asking-rent achievability than the comps imply.
- What's the recent tenant-quality profile in this submarket — average credit score on applications, eviction rate, late-payment / NSF rate, and stable-employment percentage? A property-management company in the area should have these aggregated.
- How much new for-sale + rental construction is in the pipeline within 1–3 miles? Heavy new supply typically softens prices + rents 12–24 months out; constrained supply supports both.
Investment metrics
- 1% rule
- 1.49% ✓
- Cap rate
- 12.51%
- Cash-on-cash
- 22.21%
- DSCR
- 1.99
- GRM
- 5.6
CMA / ARV
- ARV (on-the-fly)
- $304,220
- Comps found
- 12
Show comp detail 12 sales within ~0.75 mi
| Address | Dist | Beds/Ba | Sqft | Sold | Price | $/sf | Match |
|---|---|---|---|---|---|---|---|
| 52 Fenix Dr SW | 0.26mi | 3/2.0 (+1) | 1,355 (-6%) | 4mo | $207,000 | $153 | 66 |
| 304 Cabarrus Ave W | 0.25mi | 3/3.0 (+1) | 1,476 (+3%) | 9mo | $299,000 | $203 | 63 |
| 58 Creswell Dr NE | 0.67mi | 2/1.0 | 1,399 (-2%) | 5mo | $265,000 | $189 | 60 |
| 353 Ann St NW | 0.66mi | 2/2.0 | 1,464 (+2%) | 3mo | $289,000 | $197 | 59 |
| 241 Booker Dr SW | 0.68mi | 3/2.0 (+1) | 1,460 (+2%) | 3mo | $310,000 | $212 | 54 |
| 127 Cedar Dr NW | 0.31mi | 2/1.0 | 1,231 (-14%) | 10mo | $155,000 | $126 | 54 |
| 199 Mahan St SW | 0.66mi | 3/2.0 (+1) | 1,391 (-3%) | 4mo | $307,000 | $221 | 52 |
| 109 Cypress St SW | 0.44mi | 3/2.0 (+1) | 1,229 (-14%) | 7mo | $290,000 | $236 | 40 |
| 359 Ann St NW | 0.68mi | 3/2.0 (+1) | 1,607 (+12%) | 0mo | $335,000 | $208 | 39 |
| 293 Misenheimer Dr NW #42 | 0.74mi | 3/2.0 (+1) | 1,308 (-9%) | 9mo | $287,000 | $219 | 35 |
| 269 Misenheimer Dr NW | 0.73mi | 3/2.0 (+1) | 1,234 (-14%) | 1mo | $283,000 | $229 | 33 |
| 279 Melrose Dr SW | 0.75mi | 3/2.0 (+1) | 1,232 (-14%) | 8mo | $280,000 | $227 | 26 |
Match score weights: distance 35% · size 25% · config 20% · recency 20%. Top-matched comps best support the ARV.
Projected returns pro-forma
-3.0% appreciation · 3.23% rent growth · sell at horizon
- IRR
- 15.2%
- Equity multiple
- 1.61×
- Total profit
- $20,585
- Equity at exit
- $17,892
- IRR
- 24.1%
- Equity multiple
- 3.10×
- Total profit
- $70,657
- Equity at exit
- $10,375
Cash invested: $33,600 (down + closing). Projections, not guarantees.
Landlord ↔ Tenant lean methodology
- Overall (STATE)
- 85 Strongly Landlord-Friendly
- State North Carolina
- 85 Strongly Landlord-Friendly · R+3
- County
- — inherits STATE
- City
- — inherits STATE
ZIP-level market 28025
- Rents YoY
- 3.2%
- Active inventory
- 303
- Price-to-rent
- 5.6×
Monthly cashflow live
- Estimated rent
- $1,789 high interval (Pro) →
- Mortgage (P&I)
- −$629
- Tax from tax record
- −$112 /mo · $1,344/yr
- Insurance
- −$50
- HOA
- −$0
- Vacancy / Maint / Mgmt
- −$376
- Net cashflow
- $622
Break-even live
UW: 25.0% down · 7.5% · 30yr · 1.5% tax · 5.0% vac · 8.0% maint · 8.0% mgmt
Financing live
Cash to close
- Down payment
- $30,000
- Closing costs
- $3,600
- Reserves months
- —
- Total cash needed
- —
Loan-product check · same deal, 3 products live
Conventional
25% down · 7.5% · 30yr
- Down + closing
- —
- Monthly P&I
- —
- Monthly cashflow
- —
- DSCR
- —
- Eligible?
- —
Personal DTI + credit; lowest rate.
DSCR
20% down · 8.5% · 30yr
- Down + closing
- —
- Monthly P&I
- —
- Monthly cashflow
- —
- DSCR
- —
- Eligible?
- —
No personal income docs; deal must DSCR.
Hard money
10% down · 12.0% · 12mo
- Down + closing
- —
- Monthly P&I
- —
- Monthly cashflow
- —
- DSCR
- —
- Eligible?
- —
Short-term bridge; refi at stabilization.
Rent comps 22 comps
| Address | Beds | Baths | Sqft | Rent | $/sqft | DOM | Units | Dist |
|---|---|---|---|---|---|---|---|---|
| 204 Corban Ave SW Concord, NC | 3.0 | 2.0 | 1487 | $1,600 | $1.08 | 1d | 1 | 0.28mi |
| 23 Market St SW Concord, NC | 2.0 | 1.0–2.0 | 940 | $2,470 | $2.63 | 10d | 118 | 0.53mi |
| 337 Pecan Ct SW Concord, NC | 3.0 | 2.0 | 1254 | $1,610 | $1.28 | 12d | 1 | 0.58mi |
| 6 Meadowview Ave SW Concord, NC | 3.0 | 2.0 | 1176 | $1,750 | $1.49 | 12d | 1 | 0.66mi |
| 393 Kerr St NW Concord, NC | 1.0 | 1.0 | 1050 | $650 | $0.62 | 23d | 1 | 0.73mi |
| 100 Ash Ave NW Concord, NC | 3.0 | 2.0 | 1170 | $1,845 | $1.58 | 4d | 1 | 0.74mi |
| 228 Tournament Dr SW Concord, NC | 3.0 | 2.0 | 1161 | $1,650 | $1.42 | 20d | 1 | 0.74mi |
| 116 Cabarrus Ave E Concord, NC | 3.0 | 1.0 | 1495 | $2,300 | $1.54 | 3d | 1 | 0.82mi |
| 1 Buffalo Ave NW Concord, NC | 2.0–3.0 | 1.5–2.0 | 1179 | $1,200 | $1.02 | 10d | 6 | 0.82mi |
| 435 Saint James St NW Concord, NC | 1.0 | 1.0 | 1376 | $790 | $0.57 | 23d | 1 | 0.85mi |
| 193 Freeze Ave NW Concord, NC | 1.0 | 1.0 | 1378 | $665 | $0.48 | 23d | 1 | 0.86mi |
| 283 Houston St NE Concord, NC | 3.0 | 2.0 | 1176 | $1,702 | $1.45 | 17d | 1 | 0.92mi |
| 71 Woodsdale Pl SE Concord, NC | 3.0 | 2.5 | 1315 | $1,900 | $1.44 | 4d | 1 | 0.92mi |
| 393 Church St N Unit 1 Concord, NC | 3.0 | 3.0 | 1370 | $1,950 | $1.42 | 23d | 1 | 0.99mi |
| 13 Douglas Ave NW Concord, NC | 2.0 | 1.0 | 980 | $1,650 | $1.68 | 23d | 1 | 1.00mi |
| 219 Green Dr SW Concord, NC | 3.0 | 2.0 | 1278 | $1,900 | $1.49 | 4d | 1 | 1.13mi |
| 219 Green Dr SW Concord, NC | 3.0 | 2.0 | 1278 | $1,900 | $1.49 | 2d | 1 | 1.13mi |
| 83 American Ave NE Unit 83 Concord, NC | 3.0 | 2.0 | 1150 | $1,350 | $1.17 | 23d | 1 | 1.14mi |
| 25 Todd Dr NE Concord, NC | 2.0 | 2.0 | 936 | $1,650 | $1.76 | 23d | 1 | 1.27mi |
| 260 Brookwood Ave NE Unit 1E Concord, NC | 2.0 | 1.5 | 940 | $1,350 | $1.44 | 12d | 1 | 1.37mi |
| 641 Central Dr NW Concord, NC | 3.0 | 2.0 | 1601 | $2,295 | $1.43 | 23d | 1 | 1.38mi |
| 538 Hillandale St NE Concord, NC | 2.0 | 1.0 | 915 | $1,350 | $1.48 | 4d | 1 | 1.40mi |
Listing history 2 events
-
2026-05-13status Under Contract
-
2026-05-12$119,999 Active
ⓘ Source: listings_history table (triggers on properties + properties_extension) + one-shot
backfill from property_details.listing_events for pre-trigger history.
Tax reassessment forecast NC · Resets to sale price
- Current annual tax
- $1,344 · $112/mo
- Projected year-2 tax
- $1,344 · $112/mo
- Expected delta
- $0/yr ($0/mo · 0.0%)
ⓘ Screening estimate from a state-policy table — verify with the county assessor before closing.
Climate risk First Street
- Flood 4/10 Moderate FEMA zone X (unshaded) · 22% chance over 30 yrs
- Wildfire 1/10 Low
- Heat 6/10 Major 7 d/yr ≥106°F today · 17 d/yr by 30 yrs out
- Wind 4/10 Moderate 20% chance of damaging wind over 30 yrs
- Air quality 3/10 Moderate 2 unhealthy d/yr today · 5 by 30 yrs out
Nearby sold comps map
Loading sold comps map…
Walkable amenities ~0.75 mi
Loading nearby amenities…
Taxation est. · year 1
- Rental income
- $21,466
- − Mortgage interest
- −$6,722
- − Property taxes
- −$1,344
- − Insurance
- −$600
- − Repairs & maintenance
- −$1,717
- − Management
- −$1,717
- − Depreciation
- −$3,491
- Taxable income
- $5,875
- Est. tax owed @ 24.0%
- −$1,410
- After-tax cash flow
- $6,053/yr
For passive investors: Depreciation is non-cash, so a rental often shows a tax loss while cash-flowing — sheltering income. Rental losses are passive: they offset passive income freely, and up to $25,000/yr can offset ordinary (W-2) income if you actively participate and your MAGI is under $100k (phasing out to $0 by $150k); unused losses carry forward. On sale, claimed depreciation is recaptured at up to 25%, and gains may owe capital-gains tax (a 1031 exchange can defer both). Figures are a year-1 estimate at your 24.0% rate — not tax advice; consult a CPA.
Schools (NCES district)
- District
- Cabarrus County Schools
- NCES district ID
- 3700530
- Math proficiency
- 54% ▲ 4.00%
- Reading proficiency
- 55% ▲ 3.00%
- Median HH income
- $59,442
- Composite
- 47.42/100
- National rank
- #2282
- State rank
- #44 of 178 in NC
Livability — Concord
- Score
- 81/100
- State rank
- #18
- US rank
- #1595
Category grades
Schools grade is shown separately in the Schools card above.
Census & demographics
- Census place
- Concord, NC
- County
- Cabarrus County · 218,793 people
- City population
- 140,106
- Metro
- Charlotte-Concord-Gastonia, NC-SC
- Population (ZIP)
- 58,334
- Household income
- $79,545
- Rent vs Own
- Severe rent burden
- 1852.0
Population outlook (Cabarrus County) Hauer SSP2
- Today (2025)
- 239,273 people
- By 2030
- 260,754 · +9.0%
- By 2040
- 303,953 · +27.0%
- By 2050
- 344,827 · +44.1%
- By 2075
- 435,623 · +82.1%
- By 2100
- 490,119 · +104.8%
Race, ethnicity, and origin ACS 2023
- Neighborhood character
- Diverse neighborhood (Simpson 0.57)
- Race & ethnicity
- White 61% Black 21% Hispanic / Latino 13% Two or more races 8% Asian 1%
- Hispanic origin (detail)
- Mexican 7% Puerto Rican 1%
- Common ancestry
- Serbian 2% Italian 2% Slovak 1%
- Foreign-born
- 7% · Canada
- Languages at home
- 89% English-only · Spanish 9%
Political lean MEDSL · Cabarrus
- 2024 margin
- Lean R (+7.7) · D 45.5% · R 53.2% · Other 1.3%
- 2008→2024 swing
- +10.7pp toward D · 2008: -18.4pp · 2024: -7.7pp
- All cycles
- 2024: R+7.7 2020: R+9.4 2016: R+20.0 2012: R+20.2 2008: R+18.4
Not yet ingested
- Civics
- —
Market trends
- HPI YoY
- ▼ -282.07%
- Current HPI
- 258.1615
- Rent YoY
- ▲ 3.23%
- Metro
- Charlotte-Concord-Gastonia, NC-SC
- State GDP YoY
- ▲ 3.28%
- F500 in state
- 26
Industry mix (Fortune 500 HQ in NC)
| Industry | F500 HQs | Revenue |
|---|---|---|
| Financial Services | 2 | $213B |
|
||
| Retail | 2 | $95B |
|
||
| Industrial Conglomerate | 1 | $38B |
|
||
| Metals / Steel | 1 | $35B |
|
||
| Utilities | 1 | $30B |
|
||
| Industrial Machinery | 1 | $19B |
|
||
Price history
2 events — show timeline
- 2026-05-13 Pending — FSBO.com
- 2026-05-12 Listed $119,999 FSBO.com
Property tax history
+7.6%/yrLatest (2025): $1,344 · +0.0% YoY. Source: county tax records.
Cash-flow waterfall
monthlySold comps — $/sqft
last 12 mo · ≤1 miLoading sold comps…