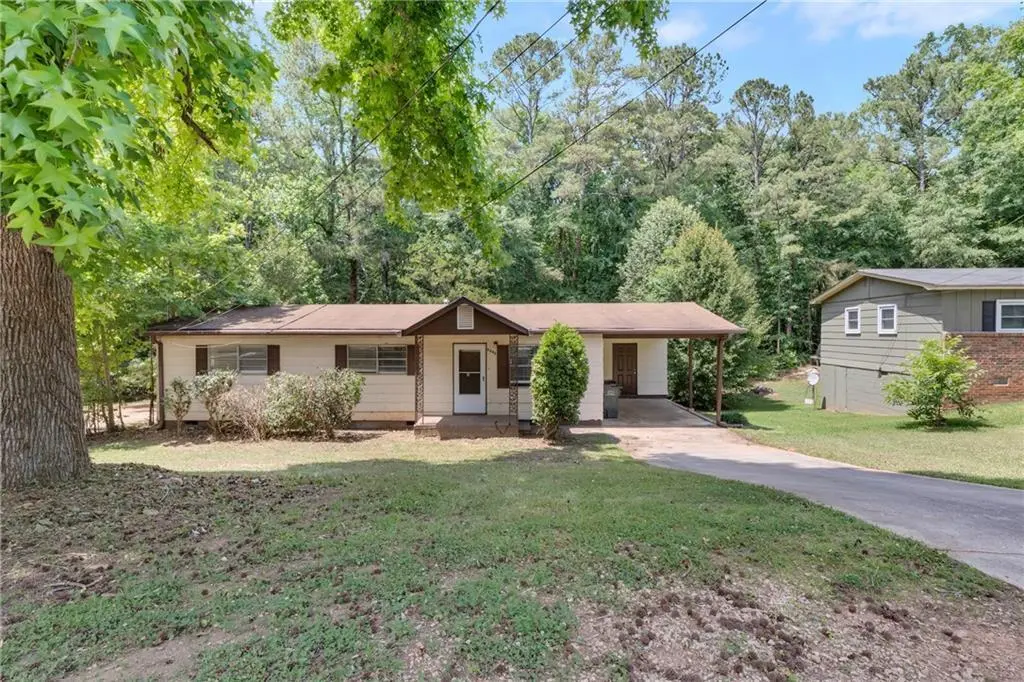
6242 Green Acres Dr SW · Covington, GA
Flood risk 1/10 · Minimal
- FEMA flood zone
- X (unshaded)
- Chance of flooding over 30 yrs
- 0.0%
- Est. flood insurance / yr
- $507 – $1,088
Fire risk 3/10 · Minor
- Est. fire insurance / yr
- $963 – $1,789
Heat risk 6/10 · Moderate
- Hot days now (above 106°F)
- 7 days/yr
- Hot days in 30 yrs
- 18 days/yr
Wind risk 6/10 · Moderate
- Chance of severe wind over 30 yrs
- 27.0%
Air-quality risk 4/10 · Minor
- Unhealthy air days now
- 5 days/yr
- Unhealthy air days in 30 yrs
- 6 days/yr
Risk factors via First Street. Map © Google.
Why this score? — see what drove the D+ grade
The composite is a weighted blend of 9 inputs, each scored 0–100. Each bar is that input's sub-score; the figure is the points it added to the 100-point composite (weight × sub-score).
- Cash flow +22.8/30.0
- DSCR +7.3/10.0
- 1% rule +6.1/10.0
- Livability +3.0/5.0
- Rent growth +2.6/5.0
- Condition / age +2.5/5.0
- Schools +1.9/10.0
- ARV discount +0.0/15.0
- Appreciation +0.0/10.0
$155,000
🖨 Deal sheet 📄 Offer letter ✓ Due diligence
Listing remarks MLS
Charming and move-in ready home in Covington! This home offers a functional layout, spacious yard, and an affordable opportunity for first-time buyers, downsizers, or investors. Conveniently located near shopping, dining, and major roadways with easy access to everyday essentials. A great opportunity to own at an attractive price point with plenty of potential to make it your own. Schedule your showing today!
Key facts
- Spacious yard
- Easy access
- Functional layout
Tags
Property features AI
Exterior
- Parking: 3 total parking spaces; 1 carport space; Carport
- Utilities: Public water; Septic tank sewer; Cable available; Electricity available
- Home design: One-level home; Resale property; Fee simple ownership
- Construction: Vinyl siding exterior; Composition roof; Brick/mortar foundation; Built above grade (finished area listed)
- Exterior features: Front porch; Concrete road frontage on a private road
Interior
- Kitchen: Breakfast bar; Electric cooktop; Electric oven; Microwave
- Bedrooms: 3 bedrooms with the primary suite on the main level
- Flooring: Carpet; Laminate
- Bathrooms: 1 full bathroom on the main level; Master bath has no special features
- Heating & cooling: Central heating; Central air conditioning
- Interior features: High speed internet; No shared/common walls
- Laundry & utility: Mud room laundry area
Neighborhood map
What this means for you Summary
Snapshot
- This is a 3-bed/1.0-bath single-family listed at $155k.
Deal economics
- At list price, monthly cash flow is $271 ($3k/yr) — positive.
- The deal already cash-flows at list — no discount required.
- Meets the 1% rule at list price ($2k rent vs $155k).
- Recommended offer: $153k (1.5% below list) — sets the bar for market timing.
- Cap rate 8.4% vs local median 3.8% in Covington — top-decile yield for the area; either an underpriced asset or a hidden risk that comps aren't pricing in. Stress-test before assuming the spread holds.
Location & tenants
- Location reads 59/100 on livability (#396 in GA) — a working-class tenant base; expect higher turnover. Strengths: cost of living A+, housing A+, health & safety B+; Watch: crime F, amenities F, commute F.
- Newton County (suburban): math 17% / reading 26% proficiency, ranked #137 of 174 in GA (top 79%) — low school quality limits family demand, transient renter base, plan for 1-2y turnover.
- Zoned schools: East Newton Elementary School (math 32% / reading 36%, grade F, #554 of 1,228 statewide, top 46%, 565 students, 53% FRL); Eastside High School (math 7% / reading 17%, grade F, #342 of 424 statewide, top 81%, 1,621 students, 46% FRL).
- Market conditions: Rents flat; 479 active listings in the ZIP; 14 comparable units currently listed for rent nearby; rentals at typical pace (median 18d on market — plan ~3-4 weeks tenant-placement turnaround); 1,480 units permitted in Newton County in 2024 (702 in 5+ unit buildings).
Forward outlook
- Local home prices are declining (-3.0%/yr); year-one equity from $1k of loan paydown is wiped out by about $5k of value loss. Plan a longer hold.
- Newton County population projected at +23% by 2050 — long-run rental-demand tailwind backs the buy-and-hold thesis.
Negotiation context
- It's been on market 28 days — a 2% lower offer ($153k) is reasonable based on typical stale-listing flexibility.
- 2 sale attempts with the ask held roughly flat each time — persistent listings suggest the price (not the market) is what's stuck; bring a comps-based counter.
- Current owner paid $115k; 35% above their basis — modest negotiation headroom, anchor on the comps not their cost.
Risks & watch-outs
- Climate carrying-cost: major wind risk, 27% chance of damaging wind over 30y; extreme-heat days projected 7→18/yr by 2055 (HVAC capex compounding) — expect insurance premiums to compound above CPI over the hold.
Questions for the listing agent
- Built in 1972 — when were the roof, HVAC, electrical panel, plumbing, and water heater last replaced?
- Is there a deadline driving the sale (1031 exchange, divorce, estate, relocation)? That informs how much negotiation room exists.
- Schools are F-rated, which usually means shorter tenancies and higher turnover. Who's the typical renter profile here, and what's been the actual vacancy rate?
- Crime grade is F in this area — have there been break-ins, vandalism, or insurance claims at this property in the last 3 years? What carrier currently insures it and at what premium?
- The area grade is low — what's the realistic commute time and amenity access for the typical tenant pool here? Any planned neighborhood developments (good or bad) we should know about?
- What's the average days-on-market for RENTAL listings here right now (not sales)? A rising rental-DOM trend means longer vacancies and softer asking-rent achievability than the comps imply.
- What's the recent tenant-quality profile in this submarket — average credit score on applications, eviction rate, late-payment / NSF rate, and stable-employment percentage? A property-management company in the area should have these aggregated.
- How much new for-sale + rental construction is in the pipeline within 1–3 miles? Heavy new supply typically softens prices + rents 12–24 months out; constrained supply supports both.
Investment metrics
- 1% rule
- 1.11% ✓
- Cap rate
- 8.39%
- Cash-on-cash
- 7.49%
- DSCR
- 1.33
- GRM
- 7.5
CMA / ARV
- ARV (on-the-fly)
- $120,384
- Comps found
- 12
Show comp detail 12 sales within ~0.75 mi
| Address | Dist | Beds/Ba | Sqft | Sold | Price | $/sf | Match |
|---|---|---|---|---|---|---|---|
| 6286 Green Acres Dr SW | 0.09mi | 3/1.0 | 1,056 (0%) | 0mo | $90,000 | $85 | 96 |
| 6109 Oakwood Cir SW | 0.11mi | 3/1.0 | 1,056 (0%) | 8mo | $82,000 | $78 | 89 |
| 6186 Green Acres Dr SW | 0.10mi | 3/1.0 | 1,080 (+2%) | 4mo | $75,000 | $69 | 88 |
| 6250 Green Acres Dr | 0.02mi | 4/2.0 (+1) | 1,056 (0%) | 6mo | $106,000 | $100 | 85 |
| 6154 Green Acres Dr SW | 0.16mi | 3/1.0 | 1,040 (-2%) | 6mo | $75,000 | $72 | 85 |
| 7127 Greenway Cv SW | 0.29mi | 3/2.0 | 1,065 (+1%) | 6mo | $165,000 | $155 | 76 |
| 7120 Chaney Dr SW | 0.35mi | 3/2.0 | 1,000 (-5%) | 4mo | $130,000 | $130 | 68 |
| 9160 Puckett St SW | 0.65mi | 3/1.0 | 1,053 (-0%) | 6mo | $93,900 | $89 | 64 |
| 6175 Petty St SW | 0.30mi | 2/1.0 (-1) | 966 (-8%) | 3mo | $130,000 | $135 | 64 |
| 3148 Rebecca St SW | 0.43mi | 2/1.0 (-1) | 960 (-9%) | 2mo | $215,500 | $224 | 58 |
| 5152 Petty St SW | 0.28mi | 2/1.0 (-1) | 1,214 (+15%) | 3mo | $205,000 | $169 | 55 |
| 9186 Puckett St | 0.70mi | 2/2.0 (-1) | 1,101 (+4%) | 5mo | $125,000 | $114 | 47 |
Match score weights: distance 35% · size 25% · config 20% · recency 20%. Top-matched comps best support the ARV.
Projected returns pro-forma
-3.0% appreciation · 0.52% rent growth · sell at horizon
- IRR
- -7.7%
- Equity multiple
- 0.72×
- Total profit
- $-12,015
- Equity at exit
- $23,111
- IRR
- -1.7%
- Equity multiple
- 0.90×
- Total profit
- $-4,447
- Equity at exit
- $13,402
Cash invested: $43,400 (down + closing). Projections, not guarantees.
Landlord ↔ Tenant lean methodology
- Overall (STATE)
- 90 Strongly Landlord-Friendly
- State Georgia
- 90 Strongly Landlord-Friendly · R+3
- County
- — inherits STATE
- City
- — inherits STATE
ZIP-level market 30014
- Home prices YoY
- -19.2%
- Rents YoY
- 0.5%
- Active inventory
- 479
- Price-to-rent
- 7.5×
Monthly cashflow live
- Estimated rent
- $1,719 high interval (Pro) →
- Mortgage (P&I)
- −$813
- Tax from tax record
- −$210 /mo · $2,518/yr
- Insurance
- −$65
- HOA
- −$0
- Vacancy / Maint / Mgmt
- −$361
- Net cashflow
- $271
Break-even live
UW: 25.0% down · 7.5% · 30yr · 1.5% tax · 5.0% vac · 8.0% maint · 8.0% mgmt
Financing live
Cash to close
- Down payment
- $38,750
- Closing costs
- $4,650
- Reserves months
- —
- Total cash needed
- —
Loan-product check · same deal, 3 products live
Conventional
25% down · 7.5% · 30yr
- Down + closing
- —
- Monthly P&I
- —
- Monthly cashflow
- —
- DSCR
- —
- Eligible?
- —
Personal DTI + credit; lowest rate.
DSCR
20% down · 8.5% · 30yr
- Down + closing
- —
- Monthly P&I
- —
- Monthly cashflow
- —
- DSCR
- —
- Eligible?
- —
No personal income docs; deal must DSCR.
Hard money
10% down · 12.0% · 12mo
- Down + closing
- —
- Monthly P&I
- —
- Monthly cashflow
- —
- DSCR
- —
- Eligible?
- —
Short-term bridge; refi at stabilization.
Rent comps 14 comps
| Address | Beds | Baths | Sqft | Rent | $/sqft | DOM | Units | Dist |
|---|---|---|---|---|---|---|---|---|
| 6100 Greenleaf Ct SW Covington, GA | 3.0 | 1.0 | 1000 | $1,400 | $1.40 | 16d | 1 | 0.08mi |
| 6103 Oakwood Cir SW Covington, GA | 3.0 | 2.0 | 1372 | $900 | $0.66 | 17d | 1 | 0.12mi |
| 6154 Green Acres Dr SW Covington, GA | 3.0 | 1.0 | 1040 | $1,900 | $1.83 | 24d | 1 | 0.16mi |
| 8246 Collier St SW Covington, GA | 3.0 | 1.0 | 1225 | $1,300 | $1.06 | 43d | 1 | 0.45mi |
| 9123 Jefferson Village Dr SW Covington, GA | 3.0 | 2.0 | 1220 | $1,750 | $1.43 | 22d | 1 | 0.66mi |
| 9135 Jefferson Village Dr SW Covington, GA | 3.0 | 2.5 | 1126 | $1,736 | $1.54 | 5d | 1 | 0.68mi |
| 9161 Thrash St SW Covington, GA | 4.0 | 2.0 | 1272 | $1,481 | $1.16 | 43d | 1 | 0.78mi |
| 3233 West St Covington, GA | 2.0 | 1.0 | 833 | $1,195 | $1.43 | 43d | 1 | 0.81mi |
| 8000 Revolution WAY Covington, GA | 2.0 | 2.0 | 1170 | $1,692 | $1.45 | 1d | 15 | 0.95mi |
| 10154 Allen Dr SW Covington, GA | 3.0 | 2.0 | 1056 | $1,800 | $1.70 | 5d | 1 | 0.98mi |
| 10154 Allen Dr SW Covington, GA | 3.0 | 2.0 | 1056 | $1,800 | $1.70 | 20d | 1 | 0.98mi |
| 5132 Avery St SW Unit A (APT 101) Covington, GA | 2.0 | 2.0 | 900 | $1,600 | $1.78 | 5d | 1 | 0.99mi |
| 8189 Spillers Dr SW Covington, GA | 2.0 | 2.5 | 1080 | $1,395 | $1.29 | 5d | 1 | 1.27mi |
| 100 Fleeta Dr Covington, GA | 3.0 | 2.0 | 1379 | $1,550 | $1.12 | 5d | 1 | 1.49mi |
Listing history 18 events
-
2026-06-18days on market $155,000 Active 28 DOM
-
2026-06-17days on market $155,000 Active 27 DOM
-
2026-06-16days on market $155,000 Active 26 DOM
-
2026-06-15days on market $155,000 Active 25 DOM
-
2026-06-13days on market $155,000 Active 23 DOM
-
2026-06-13days on market $155,000 Active 22 DOM
-
2026-06-09days on market $155,000 Active 19 DOM
-
2026-06-08days on market $155,000 Active 18 DOM
-
2026-06-07days on market $155,000 Active 17 DOM
-
2026-06-04days on market $155,000 Active 14 DOM
-
2026-06-03days on market $155,000 Active 13 DOM
-
2026-06-02days on market $155,000 Active 12 DOM
-
2026-06-01days on market $155,000 Active 11 DOM
-
2026-05-31days on market $155,000 Active 10 DOM
-
2026-05-18$155,000 New 412-char remark
Show marketing remark (412 chars)
Charming and move-in ready home in Covington! This home offers a functional layout, spacious yard, and an affordable opportunity for first-time buyers, downsizers, or investors. Conveniently located near shopping, dining, and major roadways with easy access to everyday essentials. A great opportunity to own at an attractive price point with plenty of potential to make it your own. Schedule your showing today!
-
2026-05-18$155,000 Active
Show marketing remark (412 chars)
Charming and move-in ready home in Covington! This home offers a functional layout, spacious yard, and an affordable opportunity for first-time buyers, downsizers, or investors. Conveniently located near shopping, dining, and major roadways with easy access to everyday essentials. A great opportunity to own at an attractive price point with plenty of potential to make it your own. Schedule your showing today!
-
2020-01-28soldstatus $115,000
-
1977-06-25soldstatus $21,000
ⓘ Source: listings_history table (triggers on properties + properties_extension) + one-shot
backfill from property_details.listing_events for pre-trigger history.
Tax reassessment forecast GA · Resets to sale price
- Current annual tax
- $2,518 · $210/mo
- Projected year-2 tax
- $2,518 · $210/mo
- Expected delta
- $0/yr ($0/mo · 0.0%)
ⓘ Screening estimate from a state-policy table — verify with the county assessor before closing.
Climate risk First Street
- Flood 1/10 Low FEMA zone X (unshaded) · 0% chance over 30 yrs
- Wildfire 3/10 Moderate
- Heat 6/10 Major 7 d/yr ≥106°F today · 18 d/yr by 30 yrs out
- Wind 6/10 Major 27% chance of damaging wind over 30 yrs
- Air quality 4/10 Moderate 5 unhealthy d/yr today · 6 by 30 yrs out
Nearby sold comps map
Loading sold comps map…
Walkable amenities ~0.75 mi
Loading nearby amenities…
Taxation est. · year 1
- Rental income
- $20,630
- − Mortgage interest
- −$8,682
- − Property taxes
- −$2,518
- − Insurance
- −$775
- − Repairs & maintenance
- −$1,650
- − Management
- −$1,650
- − Depreciation
- −$4,509
- Taxable income
- $845
- Est. tax owed @ 24.0%
- −$203
- After-tax cash flow
- $3,048/yr
For passive investors: Depreciation is non-cash, so a rental often shows a tax loss while cash-flowing — sheltering income. Rental losses are passive: they offset passive income freely, and up to $25,000/yr can offset ordinary (W-2) income if you actively participate and your MAGI is under $100k (phasing out to $0 by $150k); unused losses carry forward. On sale, claimed depreciation is recaptured at up to 25%, and gains may owe capital-gains tax (a 1031 exchange can defer both). Figures are a year-1 estimate at your 24.0% rate — not tax advice; consult a CPA.
Schools (NCES district)
- District
- Newton County
- NCES district ID
- 1303930
- Math proficiency
- 17% ▼ -13.00%
- Reading proficiency
- 26% ▼ -8.00%
- Median HH income
- $50,768
- Composite
- 19.2/100
- National rank
- #8816
- State rank
- #137 of 174 in GA
Livability — Covington
- Score
- 59/100
- State rank
- #396
- US rank
- #19602
Category grades
Schools grade is shown separately in the Schools card above.
Census & demographics
- Census place
- Covington, GA
- County
- Newton County · 104,393 people
- City population
- 104,393
- Metro
- Atlanta-Sandy Springs-Alpharetta, GA
- Population (ZIP)
- 41,425
- Household income
- $72,254
- Rent vs Own
- Severe rent burden
- 1934.0
Population outlook (Newton County) Hauer SSP2
- Today (2025)
- 118,372 people
- By 2030
- 124,234 · +5.0%
- By 2040
- 135,550 · +14.5%
- By 2050
- 145,309 · +22.8%
- By 2075
- 166,843 · +40.9%
- By 2100
- 175,800 · +48.5%
Race, ethnicity, and origin ACS 2023
- Neighborhood character
- Diverse neighborhood (Simpson 0.59)
- Race & ethnicity
- White 53% Black 35% Hispanic / Latino 7% Two or more races 6% Asian 2%
- Hispanic origin (detail)
- Mexican 3%
- Common ancestry
- Italian 2% Slovak 2% Serbian 1%
- Foreign-born
- 7% · Canada
- Languages at home
- 93% English-only · Spanish 5% Other Indo-European 1%
Political lean MEDSL · Newton
- 2024 margin
- D (+15.1) · D 57.3% · R 42.2%
- 2008→2024 swing
- +14.0pp toward D · 2008: 1.2pp · 2024: 15.1pp
- All cycles
- 2024: D+15.1 2020: D+10.9 2016: D+2.4 2012: D+2.0 2008: D+1.2
Not yet ingested
- Civics
- —
Market trends
- HPI YoY
- ▼ -64.50%
- Current HPI
- 270.9868
- Rent YoY
- ▲ 0.52%
- Metro
- Atlanta-Sandy Springs-Alpharetta, GA
- State GDP YoY
- ▲ 2.66%
- F500 in state
- 28
Industry mix (Fortune 500 HQ in GA)
| Industry | F500 HQs | Revenue |
|---|---|---|
| Paper / Packaging | 2 | $29B |
|
||
| Retail | 1 | $160B |
|
||
| Transportation / Logistics | 1 | $91B |
|
||
| Airlines | 1 | $62B |
|
||
| Consumer Goods | 1 | $47B |
|
||
| Utilities | 1 | $25B |
|
||
Price history
+638.1% since first listed4 events — show timeline
- 2026-05-18 Listed $155,000 FMLS
- 2026-05-18 Listed $155,000 GAMLS
- 2020-01-28 Sold (Public Records) $115,000 Public Records
- 1977-06-25 Sold (Public Records) $21,000 Public Records
Property tax history
+16.2%/yrLatest (2025): $2,518 · +4.5% YoY. Source: county tax records.
Cash-flow waterfall
monthlySold comps — $/sqft
last 12 mo · ≤1 miLoading sold comps…