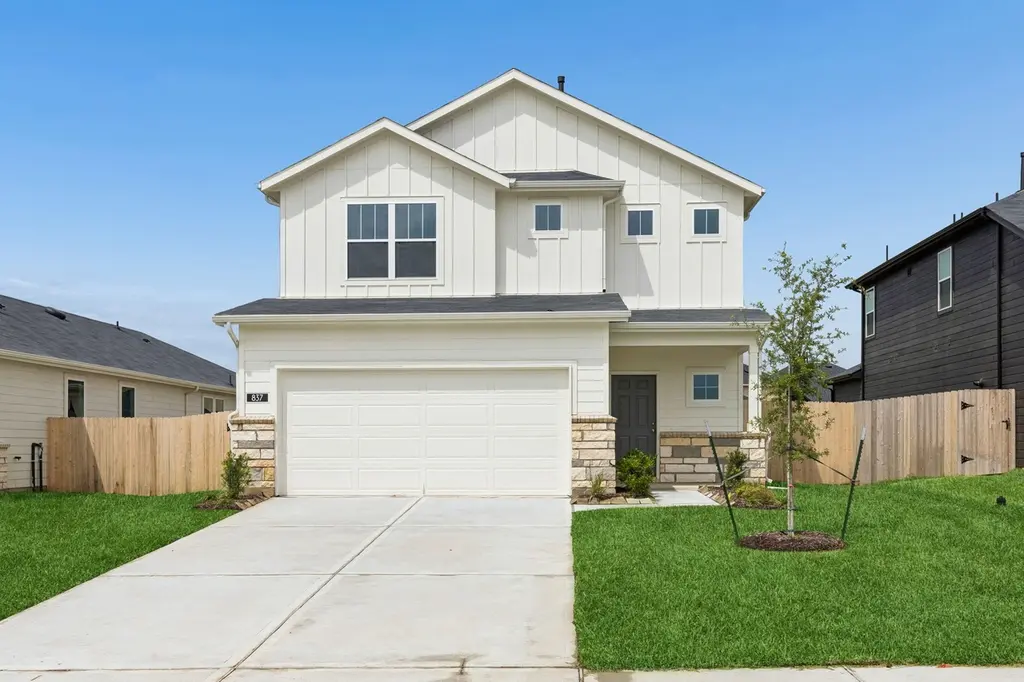
837 High Mesa Ln · Montgomery, TX
Flood risk No data
- FEMA flood zone
- —
- Chance of flooding over 30 yrs
- —
- Est. flood insurance / yr
- —
Fire risk No data
- Est. fire insurance / yr
- —
Heat risk No data
- Hot days now (above threshold)
- —
- Hot days in 30 yrs
- —
Wind risk No data
- Chance of severe wind over 30 yrs
- —
Air-quality risk No data
- Unhealthy air days now
- —
- Unhealthy air days in 30 yrs
- —
Risk factors via First Street. Map © Google.
Why this score? — see what drove the D grade
The composite is a weighted blend of 9 inputs, each scored 0–100. Each bar is that input's sub-score; the figure is the points it added to the 100-point composite (weight × sub-score).
- Cash flow +14.2/30.0
- ARV discount +6.9/15.0
- Schools +5.4/10.0
- DSCR +4.3/10.0
- Livability +3.5/5.0
- 1% rule +3.1/10.0
- Condition / age +2.5/5.0
- Rent growth +1.7/5.0
- Appreciation +0.0/10.0
$289,720
🖨 Deal sheet 📄 Offer letter ✓ Due diligence
Listing remarks MLS
Contact Sales for Details
Key facts
- Open-concept design
- Secondary bedroom
- Full bath
Tags
Neighborhood map
What this means for you Summary
Snapshot
- This is a 4-bed/3.0-bath land listed at $290k.
Deal economics
- At list price, monthly cash flow is $50 ($600/yr) — positive.
- The deal already cash-flows at list — no discount required.
- To meet the 1% rule (rent ≥ 1% of price), the offer needs to be $234k (19.1% below list).
- Recommended offer: $234k (19.1% below list) — sets the bar for 1% rule.
- Cap rate 6.5% vs local median 2.0% in Montgomery — top-decile yield for the area; either an underpriced asset or a hidden risk that comps aren't pricing in. Stress-test before assuming the spread holds.
Location & tenants
- Location reads 70/100 on livability (#372 in TX) — a middle-class / working-renter tenant base. Strengths: crime A+, employment A+, housing A+; Watch: amenities F, commute F, health & safety F.
- Montgomery ISD (rural): math 63% / reading 57% proficiency, ranked #49 of 826 in TX (top 6%) — acceptable for families but not a draw, mixed tenant base, ~2y average lease.
- Market conditions: Rents falling (-3.3%/yr); 1056 active listings in the ZIP; solid renter incomes; 13,259 units permitted in Montgomery County in 2024 (1,402 in 5+ unit buildings).
Forward outlook
- Local home prices are declining (-3.0%/yr); year-one equity from $2k of loan paydown is wiped out by about $9k of value loss. Plan a longer hold.
- Montgomery County population projected at +65% by 2050 — long-run rental-demand tailwind backs the buy-and-hold thesis.
Negotiation context
- It's been on market 69 days — a 6% lower offer ($272k) is reasonable based on typical stale-listing flexibility.
- 2 sale attempts; this cycle's ask has dropped $40k (12%) from the opening price — seller is motivated, your offer sets the floor, not the list.
Questions for the listing agent
- It's been on market 69 days. Have you received any prior offers? Is the seller open to a 19% concession, seller financing, or rate buy-down credit?
- What does the HOA fee cover, when was the last increase, and are there any pending special assessments or reserve-fund shortfalls?
- Why hasn't it sold? Are there any deal-killer items the seller is aware of (foundation, flood, title, zoning, code violations)?
- Is there a deadline driving the sale (1031 exchange, divorce, estate, relocation)? That informs how much negotiation room exists.
- Schools are B-rated — typically a magnet for longer-tenancy family renters. What's the average tenant stay here, and is there a school-zone premium baked into asking?
- The area grade is low — what's the realistic commute time and amenity access for the typical tenant pool here? Any planned neighborhood developments (good or bad) we should know about?
- What's the average days-on-market for RENTAL listings here right now (not sales)? A rising rental-DOM trend means longer vacancies and softer asking-rent achievability than the comps imply.
- What's the recent tenant-quality profile in this submarket — average credit score on applications, eviction rate, late-payment / NSF rate, and stable-employment percentage? A property-management company in the area should have these aggregated.
- How much new for-sale + rental construction is in the pipeline within 1–3 miles? Heavy new supply typically softens prices + rents 12–24 months out; constrained supply supports both.
Investment metrics
- 1% rule
- 0.81% ✗
- Cap rate
- 6.50%
- Cash-on-cash
- 0.74%
- DSCR
- 1.03
- GRM
- 10.3
CMA / ARV
- ARV (median comp)
- $285,708
- List price
- $289,720
- Delta
- 1.40%
- Verdict
- FAIR
- Comps
- 20 within 1.0 mi
Projected returns pro-forma
-3.0% appreciation · 0.0% rent growth · sell at horizon
- IRR
- -18.2%
- Equity multiple
- 0.37×
- Total profit
- $-50,718
- Equity at exit
- $43,198
- IRR
- -17.1%
- Equity multiple
- 0.17×
- Total profit
- $-66,969
- Equity at exit
- $25,050
Cash invested: $81,122 (down + closing). Projections, not guarantees.
Landlord ↔ Tenant lean methodology
- Overall (STATE)
- 87 Strongly Landlord-Friendly
- State Texas
- 87 Strongly Landlord-Friendly · R+5
- County
- — inherits STATE
- City
- — inherits STATE
ZIP-level market 77356
- Home prices YoY
- -30.3%
- Rents YoY
- -3.3%
- Active inventory
- 1056
- Price-to-rent
- 10.3×
Monthly cashflow live
- Estimated rent
- $2,344 medium interval (Pro) →
- Mortgage (P&I)
- −$1,519
- Tax from tax record
- −$79 /mo · $948/yr
- Insurance
- −$121
- HOA
- −$83
- Vacancy / Maint / Mgmt
- −$492
- Net cashflow
- $50
Break-even live
UW: 25.0% down · 7.5% · 30yr · 1.5% tax · 5.0% vac · 8.0% maint · 8.0% mgmt
Financing live
Cash to close
- Down payment
- $72,430
- Closing costs
- $8,692
- Reserves months
- —
- Total cash needed
- —
Loan-product check · same deal, 3 products live
Conventional
25% down · 7.5% · 30yr
- Down + closing
- —
- Monthly P&I
- —
- Monthly cashflow
- —
- DSCR
- —
- Eligible?
- —
Personal DTI + credit; lowest rate.
DSCR
20% down · 8.5% · 30yr
- Down + closing
- —
- Monthly P&I
- —
- Monthly cashflow
- —
- DSCR
- —
- Eligible?
- —
No personal income docs; deal must DSCR.
Hard money
10% down · 12.0% · 12mo
- Down + closing
- —
- Monthly P&I
- —
- Monthly cashflow
- —
- DSCR
- —
- Eligible?
- —
Short-term bridge; refi at stabilization.
HOA detail
- Monthly dues
- $83 · $996/yr
Listing history 15 events
-
2026-06-07status $289,720 Pending 69 DOM
-
2026-06-04days on market $289,720 Active 69 DOM
-
2026-06-03days on market $289,720 Active 68 DOM
-
2026-06-02days on market $289,720 Active 67 DOM
-
2026-06-01days on market $289,720 Active 66 DOM
-
2026-06-01price $289,720 Active 65 DOM
-
2026-05-31days on market $299,720 Active 65 DOM
-
2026-05-09price $309,720 25-char remark
Show marketing remark (25 chars)
Contact Sales for Details
-
2026-05-08price $309,720 739-char remark
Show marketing remark (739 chars)
New construction by Centex in Montgomery Bend! The popular Monroe plan offers 4 bedrooms and 3 full baths with an open-concept design ideal for modern living. The main floor includes a secondary bedroom and full bath, perfect for guests or multi-generational living. The spacious gathering room flows into the kitchen featuring gas cooking and soft-close cabinets and drawers, creating an inviting space for entertaining. Upstairs, enjoy a large game room, a private owner’s suite, and two additional bedrooms. Step outside to relax on the covered patio overlooking an oversized backyard complete with a full irrigation system and gutters. Located in an amenity-rich community with pool, park, walking trails, and recreational areas.
-
2026-04-27price $314,010 25-char remark
Show marketing remark (25 chars)
Contact Sales for Details
-
2026-04-22price $329,710 25-char remark
Show marketing remark (25 chars)
Contact Sales for Details
-
2026-04-13price $314,010 739-char remark
Show marketing remark (739 chars)
New construction by Centex in Montgomery Bend! The popular Monroe plan offers 4 bedrooms and 3 full baths with an open-concept design ideal for modern living. The main floor includes a secondary bedroom and full bath, perfect for guests or multi-generational living. The spacious gathering room flows into the kitchen featuring gas cooking and soft-close cabinets and drawers, creating an inviting space for entertaining. Upstairs, enjoy a large game room, a private owner’s suite, and two additional bedrooms. Step outside to relax on the covered patio overlooking an oversized backyard complete with a full irrigation system and gutters. Located in an amenity-rich community with pool, park, walking trails, and recreational areas.
-
2026-04-06price $331,000 25-char remark
Show marketing remark (25 chars)
Contact Sales for Details
-
2026-03-27$329,250 Active 739-char remark
Show marketing remark (739 chars)
New construction by Centex in Montgomery Bend! The popular Monroe plan offers 4 bedrooms and 3 full baths with an open-concept design ideal for modern living. The main floor includes a secondary bedroom and full bath, perfect for guests or multi-generational living. The spacious gathering room flows into the kitchen featuring gas cooking and soft-close cabinets and drawers, creating an inviting space for entertaining. Upstairs, enjoy a large game room, a private owner’s suite, and two additional bedrooms. Step outside to relax on the covered patio overlooking an oversized backyard complete with a full irrigation system and gutters. Located in an amenity-rich community with pool, park, walking trails, and recreational areas.
-
2026-03-25$329,250 Active 25-char remark
Show marketing remark (25 chars)
Contact Sales for Details
ⓘ Source: listings_history table (triggers on properties + properties_extension) + one-shot
backfill from property_details.listing_events for pre-trigger history.
Tax reassessment forecast TX · Resets to sale price
- Current annual tax
- $948 · $79/mo
- Projected year-2 tax
- $5,302 · $442/mo
- Expected delta
- +$4,353/yr (+$363/mo · 459.0%)
ⓘ Screening estimate from a state-policy table — verify with the county assessor before closing.
Nearby sold comps map
Loading sold comps map…
Walkable amenities ~0.75 mi
Loading nearby amenities…
Taxation est. · year 1
- Rental income
- $28,133
- − Mortgage interest
- −$16,229
- − Property taxes
- −$948
- − Insurance
- −$1,449
- − Repairs & maintenance
- −$2,251
- − Management
- −$2,251
- − HOA
- −$996
- − Depreciation
- −$8,428
- Taxable loss
- −$4,418
- Est. tax savings @ 24.0%
- +$1,060
- After-tax cash flow
- $1,661/yr
For passive investors: Depreciation is non-cash, so a rental often shows a tax loss while cash-flowing — sheltering income. Rental losses are passive: they offset passive income freely, and up to $25,000/yr can offset ordinary (W-2) income if you actively participate and your MAGI is under $100k (phasing out to $0 by $150k); unused losses carry forward. On sale, claimed depreciation is recaptured at up to 25%, and gains may owe capital-gains tax (a 1031 exchange can defer both). Figures are a year-1 estimate at your 24.0% rate — not tax advice; consult a CPA.
Schools (NCES district)
- District
- Montgomery ISD
- NCES district ID
- 4831260
- Math proficiency
- 63% ▼ -3.00%
- Reading proficiency
- 57% ▼ -3.00%
- Median HH income
- $75,596
- Composite
- 53.55/100
- National rank
- #1445
- State rank
- #49 of 826 in TX
Livability — Montgomery
- Score
- 70/100
- State rank
- #372
- US rank
- #7894
Category grades
Schools grade is shown separately in the Schools card above.
Census & demographics
- County
- Montgomery County · 663,713 people
- City population
- 67,277
- Metro
- Houston-The Woodlands-Sugar Land, TX
- Population (ZIP)
- 32,583
- Household income
- $106,804
- Rent vs Own
- Severe rent burden
- 414.0
Population outlook (Montgomery County) Hauer SSP2
- Today (2025)
- 713,896 people
- By 2030
- 805,263 · +12.8%
- By 2040
- 992,708 · +39.1%
- By 2050
- 1,179,590 · +65.2%
- By 2075
- 1,628,084 · +128.1%
- By 2100
- 1,937,880 · +171.5%
Race, ethnicity, and origin ACS 2023
- Neighborhood character
- Predominantly White (87%)
- Race & ethnicity
- White 87% Two or more races 5% Hispanic / Latino 5% Black 4%
- Common ancestry
- Lithuanian 8% Slovak 2% Romanian 2%
- Foreign-born
- 3% · Canada, China
- Languages at home
- 96% English-only · Spanish 3%
Political lean MEDSL · Montgomery
- 2024 margin
- Solid R (+45.5) · D 26.8% · R 72.3%
- 2008→2024 swing
- +7.2pp toward D · 2008: -52.7pp · 2024: -45.5pp
- All cycles
- 2024: R+45.5 2020: R+43.8 2016: R+51.4 2012: R+60.7 2008: R+52.7
Not yet ingested
- Civics
- —
Market trends
- HPI YoY
- ▼ -101.28%
- Current HPI
- 233.0032
- Rent YoY
- ▼ -3.30%
- Metro
- Houston-The Woodlands-Sugar Land, TX
- State GDP YoY
- ▲ 3.95%
- F500 in state
- 110
Industry mix (Fortune 500 HQ in TX)
| Industry | F500 HQs | Revenue |
|---|---|---|
| Energy | 16 | $1,198B |
|
||
| Technology | 5 | $198B |
|
||
| Engineering / Construction | 4 | $72B |
|
||
| Energy Services | 3 | $60B |
|
||
| Utilities | 3 | $41B |
|
||
| Healthcare | 2 | $330B |
|
||
Price history
-5.9% since first listed8 events — show timeline
- 2026-05-09 Price Changed $309,720 Zillow
- 2026-05-08 Price Changed $309,720 HARMLS
- 2026-04-27 Price Changed $314,010 Zillow
- 2026-04-22 Price Changed $329,710 Zillow
- 2026-04-13 Price Changed $314,010 HARMLS
- 2026-04-06 Price Changed $331,000 Zillow
- 2026-03-27 Listed $329,250 HARMLS
- 2026-03-25 Listed $329,250 Zillow
Cash-flow waterfall
monthlySold comps — $/sqft
last 12 mo · ≤1 miLoading sold comps…