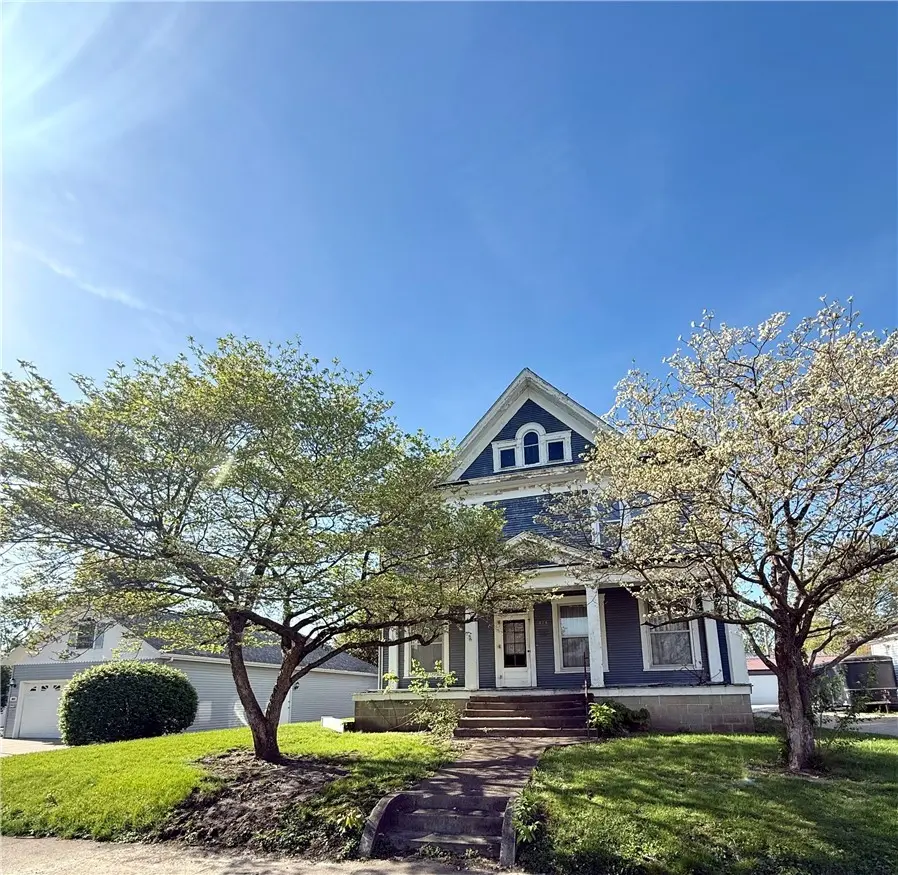
426 W Madison St · Paris, IL
Flood risk 1/10 · Minimal
- FEMA flood zone
- X (unshaded)
- Chance of flooding over 30 yrs
- 0.0%
- Est. flood insurance / yr
- $473 – $860
Fire risk 1/10 · Minimal
- Est. fire insurance / yr
- $804 – $1,492
Heat risk 4/10 · Minor
- Hot days now (above 105°F)
- 7 days/yr
- Hot days in 30 yrs
- 19 days/yr
Wind risk 2/10 · Minimal
- Chance of severe wind over 30 yrs
- 1.0%
Air-quality risk 4/10 · Minor
- Unhealthy air days now
- 3 days/yr
- Unhealthy air days in 30 yrs
- 5 days/yr
Risk factors via First Street. Map © Google.
Why this score? — see what drove the B- grade
The composite is a weighted blend of 9 inputs, each scored 0–100. Each bar is that input's sub-score; the figure is the points it added to the 100-point composite (weight × sub-score).
- Cash flow +30.0/30.0
- 1% rule +10.0/10.0
- DSCR +10.0/10.0
- ARV discount +7.5/15.0
- Livability +3.6/5.0
- Schools +2.8/10.0
- Rent growth +2.5/5.0
- Condition / age +2.5/5.0
- Appreciation +0.0/10.0
$49,000
🖨 Deal sheet 📄 Offer letter ✓ Due diligence
Listing remarks MLS
Enter into timeless elegance with this spacious 5-bedroom Victorian home, full of character and original woodwork throughout. A large, inviting front porch sets the tone as you enter into a generous living room, perfect for gatherings and everyday living. The main level features a separate dining room, a cozy eat-in kitchen, and a bonus family room offering extra flexibility. The primary bedroom and a full bathroom complete the main floor layout. An open staircase leads to the upper level, where you'll find four additional bedrooms and a second full bathroom, ideal for a growing household or guests. A large attic and an unfinished basement offer incredible storage or potential to expand your living space. Enjoy quiet moments on the enclosed back porch or take advantage of the spacious backyard, complete with a massive 4-car detached garage. This home is being sold as-is and offers a unique opportunity to own a piece of historic charm in Paris, IL. Don't miss out on making it your own! Call today to schedule a private showing.
Key facts
- Bonus family room
- Victorian home
- Separate dining room
Tags
Neighborhood map
What this means for you Summary
Snapshot
- This is a 5-bed/2.0-bath single-family listed at $49k.
Deal economics
- At list price, monthly cash flow is $595 ($7k/yr) — positive.
- The deal already cash-flows at list — no discount required.
- Meets the 1% rule at list price ($1k rent vs $49k).
- Recommended offer: $48k (3.0% below list) — sets the bar for market timing.
- Cap rate 20.9% vs local median 8.3% in Paris — top-decile yield for the area; either an underpriced asset or a hidden risk that comps aren't pricing in. Stress-test before assuming the spread holds.
Location & tenants
- Location reads 71/100 on livability (#342 in IL) — a middle-class / working-renter tenant base. Strengths: cost of living A+, housing A+, health & safety A+; Watch: employment D, crime F, amenities F.
- Paris-Union SD 95 (town): math 25% / reading 42% proficiency, ranked #227 of 620 in IL (top 37%) — families likely to look elsewhere, expect single-tenant / working-renter base with shorter leases.
- Market conditions: 82 active listings in the ZIP; 6 units permitted in Edgar County in 2024 (0 in 5+ unit buildings).
Forward outlook
- Local home prices are declining (-3.0%/yr); year-one equity from $339 of loan paydown is wiped out by about $1k of value loss. Plan a longer hold.
- Edgar County population projected at -30% by 2050 — secular population decline; favor cash flow + early exit over multi-decade hold.
- At projected returns (-3.0% appreciation + 3.0% rent growth), your $14k cash investment doubles in ~3 years — after that, you're playing with house money.
Negotiation context
- It's been on market 57 days — a 3% lower offer ($48k) is reasonable based on typical stale-listing flexibility.
- 5 sale attempts since 3y ago; this cycle's ask has dropped $10k (18%) from the opening price — seller is motivated, your offer sets the floor, not the list.
Risks & watch-outs
- Watch-outs: property tax is 4.1% of price; built in 1900 — expect roof / HVAC / electrical / plumbing capex.
Questions for the listing agent
- It's been on market 57 days. Have you received any prior offers? Is the seller open to a 3% concession, seller financing, or rate buy-down credit?
- Built in 1900 — when were the roof, HVAC, electrical panel, plumbing, and water heater last replaced?
- Property tax is high relative to price — has the assessment been appealed recently, and will the sale trigger a re-assessment?
- Is there a deadline driving the sale (1031 exchange, divorce, estate, relocation)? That informs how much negotiation room exists.
- Crime grade is F in this area — have there been break-ins, vandalism, or insurance claims at this property in the last 3 years? What carrier currently insures it and at what premium?
- What's the average days-on-market for RENTAL listings here right now (not sales)? A rising rental-DOM trend means longer vacancies and softer asking-rent achievability than the comps imply.
- What's the recent tenant-quality profile in this submarket — average credit score on applications, eviction rate, late-payment / NSF rate, and stable-employment percentage? A property-management company in the area should have these aggregated.
- How much new for-sale + rental construction is in the pipeline within 1–3 miles? Heavy new supply typically softens prices + rents 12–24 months out; constrained supply supports both.
Investment metrics
- 1% rule
- 2.68% ✓
- Cap rate
- 20.87%
- Cash-on-cash
- 52.05%
- DSCR
- 3.32
- GRM
- 3.1
CMA / ARV
- ARV (median comp)
- $115,195
- List price
- $49,000
- Delta
- -57.46%
- Verdict
- UNDERPRICED
- Comps
- 20 within 1.0 mi
Show comp detail 7 sales within ~0.75 mi
| Address | Dist | Beds/Ba | Sqft | Sold | Price | $/sf | Match |
|---|---|---|---|---|---|---|---|
| 410 Ten Broeck St | 0.28mi | 4/2.0 (-1) | 2,285 (-6%) | 4mo | $55,000 | $24 | 68 |
| 409 Sutherland Ave | 0.45mi | 5/2.0 | 2,552 (+4%) | 9mo | $97,500 | $38 | 64 |
| 508 Alexander St | 0.19mi | 4/2.0 (-1) | 2,688 (+10%) | 9mo | $35,000 | $13 | 62 |
| 501 S Main St | 0.39mi | 4/2.0 (-1) | 2,529 (+4%) | 14mo | $49,000 | $19 | 59 |
| 525 Prairie St | 0.61mi | 4/2.0 (-1) | 2,244 (-8%) | 0mo | $125,000 | $56 | 53 |
| 1202 S Main St | 0.69mi | 5/2.0 | 2,722 (+12%) | 11mo | $74,500 | $27 | 40 |
| 226 E Madison St | 0.61mi | 4/1.5 (-1) | 2,160 (-12%) | 12mo | $134,000 | $62 | 35 |
Match score weights: distance 35% · size 25% · config 20% · recency 20%. Top-matched comps best support the ARV.
Projected returns pro-forma
-3.0% appreciation · 3.0% rent growth · sell at horizon
- IRR
- 50.1%
- Equity multiple
- 3.19×
- Total profit
- $30,050
- Equity at exit
- $7,306
- IRR
- 55.6%
- Equity multiple
- 6.49×
- Total profit
- $75,319
- Equity at exit
- $4,237
Cash invested: $13,720 (down + closing). Projections, not guarantees.
Landlord ↔ Tenant lean methodology
- Overall (STATE)
- 43 Moderately Tenant-Leaning
- State Illinois
- 43 Moderately Tenant-Leaning · D+7
- County
- — inherits STATE
- City
- — inherits STATE
ZIP-level market 61944
- Active inventory
- 82
- Price-to-rent
- 3.1×
Monthly cashflow live
- Estimated rent
- $1,315 medium interval (Pro) →
- Mortgage (P&I)
- −$257
- Tax from tax record
- −$166 /mo · $1,991/yr
- Insurance
- −$20
- HOA
- −$0
- Vacancy / Maint / Mgmt
- −$276
- Net cashflow
- $595
Break-even live
UW: 25.0% down · 7.5% · 30yr · 1.5% tax · 5.0% vac · 8.0% maint · 8.0% mgmt
Financing live
Cash to close
- Down payment
- $12,250
- Closing costs
- $1,470
- Reserves months
- —
- Total cash needed
- —
Loan-product check · same deal, 3 products live
Conventional
25% down · 7.5% · 30yr
- Down + closing
- —
- Monthly P&I
- —
- Monthly cashflow
- —
- DSCR
- —
- Eligible?
- —
Personal DTI + credit; lowest rate.
DSCR
20% down · 8.5% · 30yr
- Down + closing
- —
- Monthly P&I
- —
- Monthly cashflow
- —
- DSCR
- —
- Eligible?
- —
No personal income docs; deal must DSCR.
Hard money
10% down · 12.0% · 12mo
- Down + closing
- —
- Monthly P&I
- —
- Monthly cashflow
- —
- DSCR
- —
- Eligible?
- —
Short-term bridge; refi at stabilization.
Listing history 38 events
-
2026-06-18days on market $49,000 Active 57 DOM
-
2026-06-17days on market $49,000 Active 56 DOM
-
2026-06-17price $49,000 Active 55 DOM
-
2026-06-16days on market $59,500 Active 55 DOM
-
2026-06-15days on market $59,500 Active 54 DOM
-
2026-06-13days on market $59,500 Active 52 DOM
-
2026-06-12days on market $59,500 Active 51 DOM
-
2026-06-09days on market $59,500 Active 48 DOM
-
2026-06-08days on market $59,500 Active 47 DOM
-
2026-06-07days on market $59,500 Active 46 DOM
-
2026-06-07days on market $59,500 Active 45 DOM
-
2026-06-04days on market $59,500 Active 42 DOM
-
2026-06-02days on market $59,500 Active 41 DOM
-
2026-06-01days on market $59,500 Active 40 DOM
-
2026-05-31days on market $59,500 Active 39 DOM
-
2026-05-31days on market $59,500 Active 38 DOM
-
2026-04-21$59,500 Active 1041-char remark
Show marketing remark (1041 chars)
Enter into timeless elegance with this spacious 5-bedroom Victorian home, full of character and original woodwork throughout. A large, inviting front porch sets the tone as you enter into a generous living room, perfect for gatherings and everyday living. The main level features a separate dining room, a cozy eat-in kitchen, and a bonus family room offering extra flexibility. The primary bedroom and a full bathroom complete the main floor layout. An open staircase leads to the upper level, where you'll find four additional bedrooms and a second full bathroom, ideal for a growing household or guests. A large attic and an unfinished basement offer incredible storage or potential to expand your living space. Enjoy quiet moments on the enclosed back porch or take advantage of the spacious backyard, complete with a massive 4-car detached garage. This home is being sold as-is and offers a unique opportunity to own a piece of historic charm in Paris, IL. Don't miss out on making it your own! Call today to schedule a private showing.
-
2025-10-08price $70,000
-
2025-09-19price $64,900
-
2025-08-14price $72,500
-
2025-05-29price $77,500
-
2025-05-13$82,500 Active
-
2023-05-12soldstatus $70,000
-
2023-04-28soldstatus $70,000 Closed
-
2023-04-28soldstatus $70,000 Closed
-
2023-04-28soldstatus $70,000 Closed
-
2023-04-21soldstatus $70,000
-
2023-03-24status Pending
-
2023-03-24status Pending
-
2023-03-24status Pending
-
2023-03-17historical
-
2023-02-14price $75,000
-
2023-02-14price $75,000
-
2023-02-14price $75,000
-
2023-01-18$87,900 Active
-
2023-01-18$87,900 Active
-
2023-01-18$87,900 Active
-
1977-03-15soldstatus $30,000
ⓘ Source: listings_history table (triggers on properties + properties_extension) + one-shot
backfill from property_details.listing_events for pre-trigger history.
Tax reassessment forecast IL · Partial reset (capped growth)
- Current annual tax
- $1,991 · $166/mo
- Projected year-2 tax
- $1,991 · $166/mo
- Expected delta
- $0/yr ($0/mo · 0.0%)
ⓘ Screening estimate from a state-policy table — verify with the county assessor before closing.
Climate risk First Street
- Flood 1/10 Low FEMA zone X (unshaded) · 0% chance over 30 yrs
- Wildfire 1/10 Low
- Heat 4/10 Moderate 7 d/yr ≥105°F today · 19 d/yr by 30 yrs out
- Wind 2/10 Low 100% chance of damaging wind over 30 yrs
- Air quality 4/10 Moderate 3 unhealthy d/yr today · 5 by 30 yrs out
Nearby sold comps map
Loading sold comps map…
Walkable amenities ~0.75 mi
Loading nearby amenities…
Taxation est. · year 1
- Rental income
- $15,774
- − Mortgage interest
- −$2,745
- − Property taxes
- −$1,991
- − Insurance
- −$245
- − Repairs & maintenance
- −$1,262
- − Management
- −$1,262
- − Depreciation
- −$1,425
- Taxable income
- $6,844
- Est. tax owed @ 24.0%
- −$1,643
- After-tax cash flow
- $5,499/yr
For passive investors: Depreciation is non-cash, so a rental often shows a tax loss while cash-flowing — sheltering income. Rental losses are passive: they offset passive income freely, and up to $25,000/yr can offset ordinary (W-2) income if you actively participate and your MAGI is under $100k (phasing out to $0 by $150k); unused losses carry forward. On sale, claimed depreciation is recaptured at up to 25%, and gains may owe capital-gains tax (a 1031 exchange can defer both). Figures are a year-1 estimate at your 24.0% rate — not tax advice; consult a CPA.
Schools (NCES district)
- District
- Paris-Union SD 95
- NCES district ID
- 1730750
- Math proficiency
- 25% ▼ -4.00%
- Reading proficiency
- 42% ▼ -7.00%
- Median HH income
- $36,294
- Composite
- 27.73/100
- National rank
- #6901
- State rank
- #227 of 620 in IL
Livability — Paris
- Score
- 71/100
- State rank
- #342
- US rank
- #6933
Category grades
Schools grade is shown separately in the Schools card above.
Census & demographics
- Census place
- Paris, IL
- City population
- 11,426
- Population (ZIP)
- 11,426
Population outlook (Edgar County) Hauer SSP2
- Today (2025)
- 15,960 people
- By 2030
- 14,978 · -6.2%
- By 2040
- 12,990 · -18.6%
- By 2050
- 11,087 · -30.5%
- By 2075
- 7,338 · -54.0%
- By 2100
- 4,526 · -71.6%
Race, ethnicity, and origin ACS 2023
- Neighborhood character
- Predominantly White (96%)
- Race & ethnicity
- White 96% Two or more races 3% Hispanic / Latino 1%
- Common ancestry
- Slovak 2% Serbian 2% Italian 1%
- Foreign-born
- 1%
- Languages at home
- 98% English-only · Spanish 1% Other Indo-European 1%
Political lean MEDSL · Edgar
- 2024 margin
- Solid R (+52.4) · D 23.0% · R 75.3% · Other 1.7%
- 2008→2024 swing
- -44.4pp toward R · 2008: -7.9pp · 2024: -52.4pp
- All cycles
- 2024: R+52.4 2020: R+52.5 2016: R+49.5 2012: R+32.8 2008: R+7.9
Not yet ingested
- Civics
- —
Market trends
- HPI YoY
- ▼ -66.48%
- Current HPI
- 108.1718
- Rent YoY
- —
- Metro
- —
- State GDP YoY
- ▲ 1.59%
- F500 in state
- 60
Industry mix (Fortune 500 HQ in IL)
| Industry | F500 HQs | Revenue |
|---|---|---|
| Insurance | 4 | $201B |
|
||
| Consumer Goods | 4 | $87B |
|
||
| Industrial Machinery | 3 | $64B |
|
||
| Healthcare | 2 | $55B |
|
||
| Retail / Pharmacy | 1 | $148B |
|
||
| Agriculture / Food | 1 | $86B |
|
||
Price history
+98.3% since first listed22 events — show timeline
- 2026-04-21 Listed $59,500 CIBR
- 2025-10-08 Price Changed $70,000 CIBR
- 2025-09-19 Price Changed $64,900 CIBR
- 2025-08-14 Price Changed $72,500 CIBR
- 2025-05-29 Price Changed $77,500 CIBR
- 2025-05-13 Listed $82,500 CIBR
- 2023-05-12 Sold (Public Records) $70,000 Public Records
- 2023-04-28 Sold (MLS) $70,000 MRED as Distributed by MLS Grid
- 2023-04-28 Sold (MLS) $70,000 MRED as Distributed by MLS Grid
- 2023-04-28 Sold (MLS) $70,000 CIBR
- 2023-04-21 Sold (Public Records) $70,000 Public Records
- 2023-03-24 Pending — MRED as Distributed by MLS Grid
- 2023-03-24 Pending — MRED as Distributed by MLS Grid
- 2023-03-24 Pending — CIBR
- 2023-03-17 Listing Removed — MRED as Distributed by MLS Grid
- 2023-02-14 Price Changed $75,000 CIBR
- 2023-02-14 Price Changed $75,000 MRED as Distributed by MLS Grid
- 2023-02-14 Price Changed $75,000 MRED as Distributed by MLS Grid
- 2023-01-18 Listed $87,900 MRED as Distributed by MLS Grid
- 2023-01-18 Listed $87,900 MRED as Distributed by MLS Grid
- 2023-01-18 Listed $87,900 CIBR
- 1977-03-15 Sold (Public Records) $30,000 Public Records
Property tax history
+6.5%/yrLatest (2024): $1,991 · -2.8% YoY. Source: county tax records.
Cash-flow waterfall
monthlySold comps — $/sqft
last 12 mo · ≤1 miLoading sold comps…