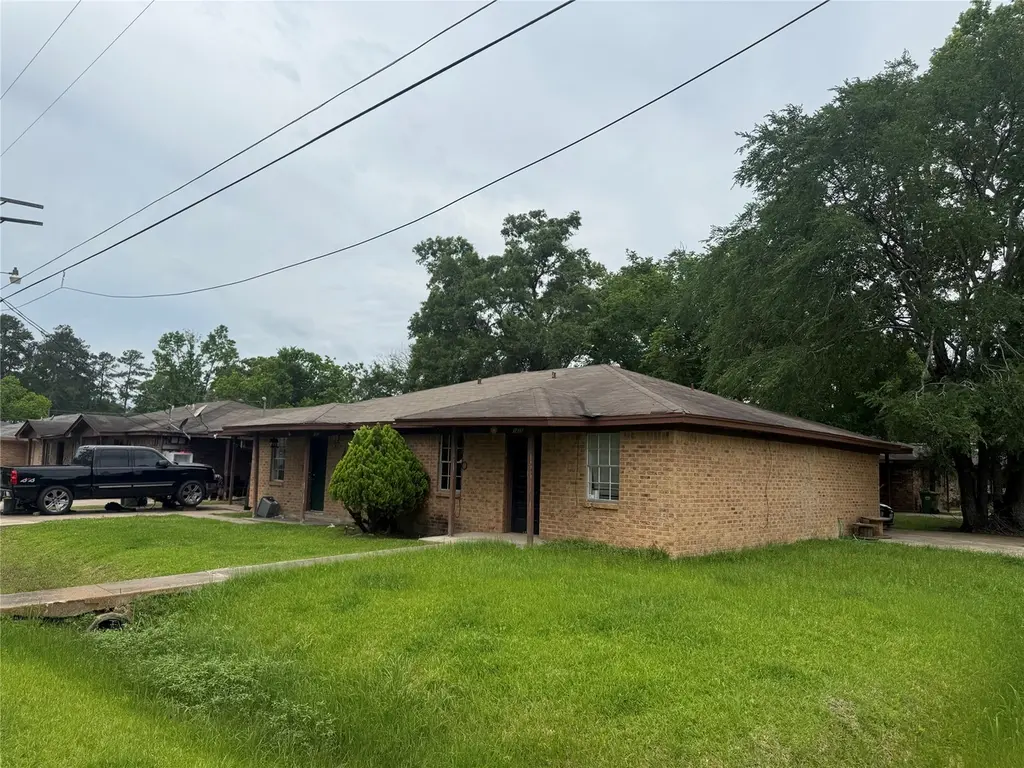
 Duplex
1413 Truman St #1415 · Cleveland, TX
Flood risk 1/10 · Minimal
- FEMA flood zone
- X (unshaded)
- Chance of flooding over 30 yrs
- 0.0%
- Est. flood insurance / yr
- $507 – $1,088
Fire risk 4/10 · Minor
- Est. fire insurance / yr
- $1,222 – $2,270
Heat risk 9/10 · Severe
- Hot days now (above 110°F)
- 7 days/yr
- Hot days in 30 yrs
- 24 days/yr
Wind risk 8/10 · Major
- Chance of severe wind over 30 yrs
- 99.0%
Air-quality risk 2/10 · Minimal
- Unhealthy air days now
- 1 days/yr
- Unhealthy air days in 30 yrs
- 1 days/yr
Risk factors via First Street. Map © Google.
Why this score? — see what drove the D grade
The composite is a weighted blend of 9 inputs, each scored 0–100. Each bar is that input's sub-score; the figure is the points it added to the 100-point composite (weight × sub-score).
- Cash flow +14.8/30.0
- ARV discount +5.3/15.0
- DSCR +4.5/10.0
- 1% rule +4.4/10.0
- Rent growth +3.5/5.0
- Livability +3.1/5.0
- Condition / age +2.5/5.0
- Schools +2.1/10.0
- Appreciation +0.0/10.0
$240,000
🖨 Deal sheet 📄 Offer letter ✓ Due diligence
Multi-family units
County records classify this as Multi-Family (2-4 Unit). Listing-text estimate: 2 units. confirmed
Listing remarks MLS
Investment opportunity in the growing community of Cleveland, TX 77327—a portfolio of five fully-occupied duplexes offering cash flow and long-term appreciation potential. Each duplex features two spacious 2-bedroom, 1-bath units, with approximately 900 square feet per side and a total of +/-1,800 square feet per building. That’s 10 income-producing units across the portfolio, all currently leased and generating steady rental income. These properties sit on individual lots and are ideal for investors looking to expand their portfolio, execute a 1031 exchange, or secure passive income in a strong rental market. Located in a high-demand area with ongoing development, this offering represents a turnkey solution for both new and seasoned investors seeking stability, scale, and growth in Texas real estate
Key facts
- 7,501 sq ft lot
- Parking
- Built 1978
Neighborhood map
What this means for you Summary
Snapshot
- This is a 2 × 2-bed/1-bath units multifamily listed at $240k.
Deal economics
- At list price, monthly cash flow is $67 ($800/yr) — positive. Per door: $33/mo.
- The deal already cash-flows at list — no discount required.
- To meet the 1% rule (rent ≥ 1% of price), the offer needs to be $225k (6.4% below list).
- Recommended offer: $211k (12.0% below list) — sets the bar for market timing.
- Cap rate 6.6% vs local median 4.7% in Cleveland — top-decile yield for the area; either an underpriced asset or a hidden risk that comps aren't pricing in. Stress-test before assuming the spread holds.
Location & tenants
- Location reads 61/100 on livability (#1,013 in TX) — a middle-class / working-renter tenant base. Strengths: cost of living A+, housing A+; Watch: schools F, crime D-, amenities F.
- Cleveland ISD (town): math 24% / reading 25% proficiency, ranked #723 of 826 in TX (top 88%) — low school quality limits family demand, transient renter base, plan for 1-2y turnover; 71% free/reduced lunch — lower-income household profile, screen leases tightly.
- Market conditions: Rents rising fast (+4.0%/yr); 1574 active listings in the ZIP; 4 comparable units currently listed for rent nearby; rentals lingering (median 44d on market — plan ~5-8 weeks vacancy on turnover, expect pricing pressure); 50% of comp listings sitting > 30 days — soft ceiling on asking rent; 1,321 units permitted in Liberty County in 2024 (0 in 5+ unit buildings).
- This rent runs 43% of the median local income ($62k/yr) — at the standard rent-burdened threshold; future hikes will face affordability resistance.
Forward outlook
- Local home prices are declining (-3.0%/yr); year-one equity from $2k of loan paydown is wiped out by about $7k of value loss. Plan a longer hold.
- Liberty County population projected at +24% by 2050 — long-run rental-demand tailwind backs the buy-and-hold thesis.
Negotiation context
- It's been on market 227 days — a 12% lower offer ($211k) is reasonable based on typical stale-listing flexibility.
- 2 sale attempts with the ask held roughly flat each time — persistent listings suggest the price (not the market) is what's stuck; bring a comps-based counter.
Risks & watch-outs
- Climate carrying-cost: severe wind risk, 99% chance of damaging wind over 30y; extreme-heat days projected 7→24/yr by 2055 (HVAC capex compounding) — expect insurance premiums to compound above CPI over the hold.
Questions for the listing agent
- It's been on market 227 days. Have you received any prior offers? Is the seller open to a 12% concession, seller financing, or rate buy-down credit?
- Can we see the unit-by-unit rent roll, current vacancy, and any below-market leases? What's the average tenancy length?
- What capital expenditures (roof, boiler, parking lot, exteriors) have been made in the last 5 years, and what's planned in the next 2?
- Built in 1978 — when were the roof, HVAC, electrical panel, plumbing, and water heater last replaced?
- Why hasn't it sold? Are there any deal-killer items the seller is aware of (foundation, flood, title, zoning, code violations)?
- Is there a deadline driving the sale (1031 exchange, divorce, estate, relocation)? That informs how much negotiation room exists.
- Schools are F-rated, which usually means shorter tenancies and higher turnover. Who's the typical renter profile here, and what's been the actual vacancy rate?
- Crime grade is D in this area — have there been break-ins, vandalism, or insurance claims at this property in the last 3 years? What carrier currently insures it and at what premium?
- The area grade is low — what's the realistic commute time and amenity access for the typical tenant pool here? Any planned neighborhood developments (good or bad) we should know about?
- What's the average days-on-market for RENTAL listings here right now (not sales)? A rising rental-DOM trend means longer vacancies and softer asking-rent achievability than the comps imply.
- What's the recent tenant-quality profile in this submarket — average credit score on applications, eviction rate, late-payment / NSF rate, and stable-employment percentage? A property-management company in the area should have these aggregated.
- How much new apartment / multifamily construction is in the pipeline within 1–3 miles? Heavy new supply (>2% of stock underway) typically softens rents 12–24 months out; light construction supports rent growth.
Investment metrics
- 1% rule
- 0.94% ✗
- Cap rate
- 6.63%
- Cash-on-cash
- 1.19%
- DSCR
- 1.05
- GRM
- 8.9
CMA / ARV
- ARV (median comp)
- $229,000
- List price
- $240,000
- Delta
- 4.80%
- Verdict
- FAIR
- Comps
- 1 within 2.0 mi
Projected returns pro-forma
-3.0% appreciation · 4.0% rent growth · sell at horizon
- IRR
- -13.2%
- Equity multiple
- 0.52×
- Total profit
- $-32,296
- Equity at exit
- $35,785
- IRR
- -2.7%
- Equity multiple
- 0.81×
- Total profit
- $-12,834
- Equity at exit
- $20,751
Cash invested: $67,200 (down + closing). Projections, not guarantees.
Landlord ↔ Tenant lean methodology
- Overall (STATE)
- 87 Strongly Landlord-Friendly
- State Texas
- 87 Strongly Landlord-Friendly · R+5
- County
- — inherits STATE
- City
- — inherits STATE
ZIP-level market 77327
- Home prices YoY
- -5.2%
- Rents YoY
- 4.0%
- Active inventory
- 1574
- Price-to-rent
- 17.8×
Monthly cashflow live
- Estimated rent
- $2,246 medium interval (Pro) →
- Mortgage (P&I)
- −$1,259
- Tax from tax record
- −$349 /mo · $4,189/yr
- Insurance
- −$100
- HOA
- −$0
- Vacancy / Maint / Mgmt
- −$472
- Net cashflow
- $67
Break-even live
2-unit breakdown (identical units grouped — click to expand)
| Units | Beds | Baths | Est. rent |
|---|---|---|---|
| 2× units | 2 | 1 | $2,246 |
| #1 | 2 | 1 | $1,123 |
| #2 | 2 | 1 | $1,123 |
| Total (2 units) | $2,246 | ||
UW: 25.0% down · 7.5% · 30yr · 1.5% tax · 5.0% vac · 8.0% maint · 8.0% mgmt
Financing live
Cash to close
- Down payment
- $60,000
- Closing costs
- $7,200
- Reserves months
- —
- Total cash needed
- —
Loan-product check · same deal, 3 products live
Conventional
25% down · 7.5% · 30yr
- Down + closing
- —
- Monthly P&I
- —
- Monthly cashflow
- —
- DSCR
- —
- Eligible?
- —
Personal DTI + credit; lowest rate.
DSCR
20% down · 8.5% · 30yr
- Down + closing
- —
- Monthly P&I
- —
- Monthly cashflow
- —
- DSCR
- —
- Eligible?
- —
No personal income docs; deal must DSCR.
Hard money
10% down · 12.0% · 12mo
- Down + closing
- —
- Monthly P&I
- —
- Monthly cashflow
- —
- DSCR
- —
- Eligible?
- —
Short-term bridge; refi at stabilization.
Rent comps 4 comps
| Address | Beds | Baths | Sqft | Rent | $/sqft | DOM | Units | Dist |
|---|---|---|---|---|---|---|---|---|
| 700 Lyle West Ave Cleveland, TX | 3.0 | 2.0 | 1080 | $1,195 | $1.11 | 1d | 1 | 0.03mi |
| 511 S Roosevelt Ave Cleveland, TX | 3.0 | 1.0 | 960 | $1,600 | $1.67 | 43d | 1 | 0.69mi |
| 201 Pine Bend Ct Cleveland, TX | 3.0 | 1.0 | 1040 | $1,200 | $1.15 | 43d | 1 | 0.72mi |
| 1301 Nevell St Cleveland, TX | 1.0–3.0 | 1.0–2.0 | 827 | $1,255 | $1.52 | 1d | 4 | 1.09mi |
Listing history 19 events
-
2026-06-18days on market $240,000 Active 227 DOM
-
2026-06-17days on market $240,000 Active 226 DOM
-
2026-06-16days on market $240,000 Active 225 DOM
-
2026-06-15days on market $240,000 Active 224 DOM
-
2026-06-13days on market $240,000 Active 222 DOM
-
2026-06-09days on market $240,000 Active 218 DOM
-
2026-06-08days on market $240,000 Active 217 DOM
-
2026-06-07days on market $240,000 Active 216 DOM
-
2026-06-04days on market $240,000 Active 213 DOM
-
2026-06-03days on market $240,000 Active 212 DOM
-
2026-06-02days on market $240,000 Active 211 DOM
-
2026-06-01days on market $240,000 Active 210 DOM
-
2026-05-31days on market $240,000 Active 209 DOM
-
2025-11-13price $240,000 823-char remark
Show marketing remark (823 chars)
Investment opportunity in the growing community of Cleveland, TX 77327—a portfolio of five fully-occupied duplexes offering cash flow and long-term appreciation potential. Each duplex features two spacious 2-bedroom, 1-bath units, with approximately 900 square feet per side and a total of +/-1,800 square feet per building. That’s 10 income-producing units across the portfolio, all currently leased and generating steady rental income. These properties sit on individual lots and are ideal for investors looking to expand their portfolio, execute a 1031 exchange, or secure passive income in a strong rental market. Located in a high-demand area with ongoing development, this offering represents a turnkey solution for both new and seasoned investors seeking stability, scale, and growth in Texas real estate
-
2025-11-03$250,000 Active 823-char remark
Show marketing remark (823 chars)
Investment opportunity in the growing community of Cleveland, TX 77327—a portfolio of five fully-occupied duplexes offering cash flow and long-term appreciation potential. Each duplex features two spacious 2-bedroom, 1-bath units, with approximately 900 square feet per side and a total of +/-1,800 square feet per building. That’s 10 income-producing units across the portfolio, all currently leased and generating steady rental income. These properties sit on individual lots and are ideal for investors looking to expand their portfolio, execute a 1031 exchange, or secure passive income in a strong rental market. Located in a high-demand area with ongoing development, this offering represents a turnkey solution for both new and seasoned investors seeking stability, scale, and growth in Texas real estate
-
2025-10-31historical
-
2025-04-30$250,000 Active
-
2005-08-02soldstatus
-
2004-06-22soldstatus
ⓘ Source: listings_history table (triggers on properties + properties_extension) + one-shot
backfill from property_details.listing_events for pre-trigger history.
Tax reassessment forecast TX · Resets to sale price
- Current annual tax
- $4,189 · $349/mo
- Projected year-2 tax
- $4,392 · $366/mo
- Expected delta
- +$203/yr (+$17/mo · 4.9%)
ⓘ Screening estimate from a state-policy table — verify with the county assessor before closing.
Climate risk First Street
- Flood 1/10 Low FEMA zone X (unshaded) · 0% chance over 30 yrs
- Wildfire 4/10 Moderate
- Heat 9/10 Extreme 7 d/yr ≥110°F today · 24 d/yr by 30 yrs out
- Wind 8/10 Severe 99% chance of damaging wind over 30 yrs
- Air quality 2/10 Low 1 unhealthy d/yr today · 1 by 30 yrs out
Nearby sold comps map
Loading sold comps map…
Walkable amenities ~0.75 mi
Loading nearby amenities…
Taxation est. · year 1
- Rental income
- $26,952
- − Mortgage interest
- −$13,444
- − Property taxes
- −$4,189
- − Insurance
- −$1,200
- − Repairs & maintenance
- −$2,156
- − Management
- −$2,156
- − Depreciation
- −$6,982
- Taxable loss
- −$3,174
- Est. tax savings @ 24.0%
- +$762
- After-tax cash flow
- $1,562/yr
For passive investors: Depreciation is non-cash, so a rental often shows a tax loss while cash-flowing — sheltering income. Rental losses are passive: they offset passive income freely, and up to $25,000/yr can offset ordinary (W-2) income if you actively participate and your MAGI is under $100k (phasing out to $0 by $150k); unused losses carry forward. On sale, claimed depreciation is recaptured at up to 25%, and gains may owe capital-gains tax (a 1031 exchange can defer both). Figures are a year-1 estimate at your 24.0% rate — not tax advice; consult a CPA.
Schools (NCES district)
- District
- Cleveland ISD
- NCES district ID
- 4814370
- Math proficiency
- 24% ▼ -13.00%
- Reading proficiency
- 25% ▼ -4.00%
- Median HH income
- $39,173
- Composite
- 20.61/100
- National rank
- #8549
- State rank
- #723 of 826 in TX
Livability — Cleveland
- Score
- 61/100
- State rank
- #1013
- US rank
- #17943
Category grades
Schools grade is shown separately in the Schools card above.
Census & demographics
- Census place
- Cleveland, TX
- County
- Liberty County · 82,189 people
- City population
- 17,208
- Metro
- Houston-The Woodlands-Sugar Land, TX
- Population (ZIP)
- 42,685
- Household income
- $62,219
- Rent vs Own
- Severe rent burden
- 437.0
Population outlook (Liberty County) Hauer SSP2
- Today (2025)
- 87,956 people
- By 2030
- 92,161 · +4.8%
- By 2040
- 100,784 · +14.6%
- By 2050
- 109,471 · +24.5%
- By 2075
- 133,470 · +51.7%
- By 2100
- 147,372 · +67.6%
Race, ethnicity, and origin ACS 2023
- Neighborhood character
- Diverse neighborhood (Simpson 0.57)
- Race & ethnicity
- Hispanic / Latino 54% White 36% Two or more races 18% Black 8% Native American 2%
- Hispanic origin (detail)
- Mexican 42%
- Common ancestry
- Lithuanian 2% Serbian 1% Slovak 0%
- Foreign-born
- 22% · Canada
- Languages at home
- 51% English-only · Spanish 48%
Political lean MEDSL · Liberty
- 2024 margin
- Solid R (+61.6) · D 19.0% · R 80.6%
- 2008→2024 swing
- -17.9pp toward R · 2008: -43.7pp · 2024: -61.6pp
- All cycles
- 2024: R+61.6 2020: R+59.7 2016: R+58.0 2012: R+53.3 2008: R+43.7
Not yet ingested
- Civics
- —
Market trends
- HPI YoY
- ▼ -12.39%
- Current HPI
- 224.9222
- Rent YoY
- ▲ 4.00%
- Metro
- Houston-The Woodlands-Sugar Land, TX
- State GDP YoY
- ▲ 3.95%
- F500 in state
- 110
Industry mix (Fortune 500 HQ in TX)
| Industry | F500 HQs | Revenue |
|---|---|---|
| Energy | 16 | $1,198B |
|
||
| Technology | 5 | $198B |
|
||
| Engineering / Construction | 4 | $72B |
|
||
| Energy Services | 3 | $60B |
|
||
| Utilities | 3 | $41B |
|
||
| Healthcare | 2 | $330B |
|
||
Price history
-4.0% since first listed6 events — show timeline
- 2025-11-13 Price Changed $240,000 HARMLS
- 2025-11-03 Listed $250,000 HARMLS
- 2025-10-31 Listing Removed — HARMLS
- 2025-04-30 Listed $250,000 HARMLS
- 2005-08-02 Sold (Public Records) — Public Records
- 2004-06-22 Sold (Public Records) — Public Records
Property tax history
+7.6%/yrLatest (2025): $4,189 · -7.7% YoY. Source: county tax records.
Cash-flow waterfall
monthlySold comps — $/sqft
last 12 mo · ≤1 miLoading sold comps…