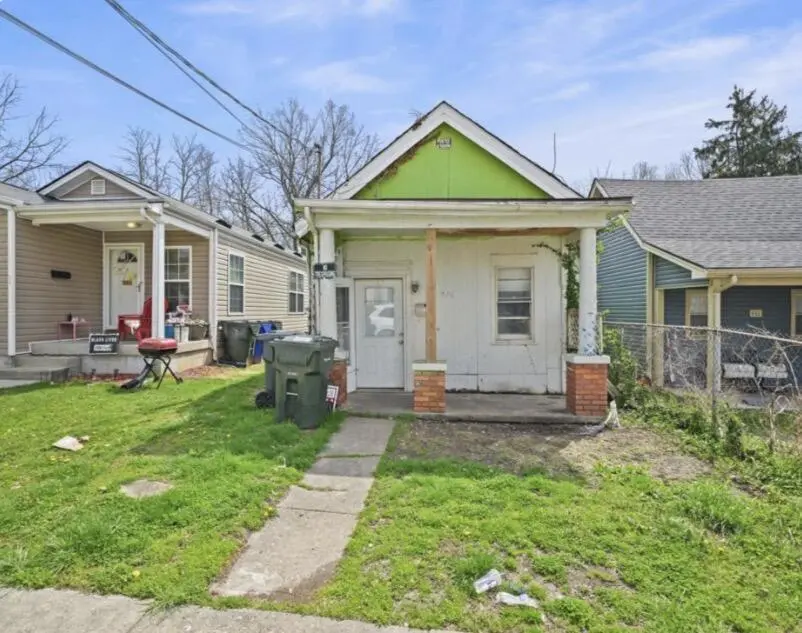
436 Ohio St · Lexington-Fayette, KY
Flood risk 1/10 · Minimal
- FEMA flood zone
- X (unshaded)
- Chance of flooding over 30 yrs
- 0.0%
- Est. flood insurance / yr
- $507 – $1,088
Fire risk 1/10 · Minimal
- Est. fire insurance / yr
- $839 – $1,559
Heat risk 4/10 · Minor
- Hot days now (above 101°F)
- 7 days/yr
- Hot days in 30 yrs
- 19 days/yr
Wind risk 2/10 · Minimal
- Chance of severe wind over 30 yrs
- 1.0%
Air-quality risk 1/10 · Minimal
- Unhealthy air days now
- 0 days/yr
- Unhealthy air days in 30 yrs
- 0 days/yr
Risk factors via First Street. Map © Google.
Why this score? — see what drove the B grade
The composite is a weighted blend of 9 inputs, each scored 0–100. Each bar is that input's sub-score; the figure is the points it added to the 100-point composite (weight × sub-score).
- Cash flow +28.5/30.0
- ARV discount +15.0/15.0
- DSCR +10.0/10.0
- 1% rule +7.9/10.0
- Rent growth +5.0/5.0
- Schools +3.4/10.0
- Livability +2.5/5.0
- Condition / age +2.5/5.0
- Appreciation +0.0/10.0
$103,000
🖨 Deal sheet 📄 Offer letter ✓ Due diligence
Listing remarks
Great investment opportunity! This residential income property offers strong potential for future monthly cash flow. Currently vacant, allowing the new owner to set market rents and maximize returns. Contact the listing agent to schedule a showing.
Key facts
- 4,181 sq ft lot
- Built 1900
- Listed 54 days
Property features AI
Finance
- Other: Lot size approximately 4,181.76 sq ft (0.096 acres)
- Financial info: Parcel number 13258200
Exterior
- Utilities: Water and sewer information not provided; Power information not provided
- Home design: Downtown subdivision; Located in Fayette County, KY; Directions: Broadway east onto 4th St past Transylvania, right onto Ohio (house on the right); or Rose to Elmtree Lane, right onto 4th, right onto Ohio
- Construction: Total building area approximately 4,200
- Exterior features: Shingle roof
Interior
- Bathrooms: 1 full bathroom
- Interior features: Window air conditioning units; Forced air heating; Natural gas heating
Neighborhood map
What this means for you Summary
Snapshot
- This is a 2-bed/1.0-bath single-family listed at $103k.
Deal economics
- At list price, monthly cash flow is $338 ($4k/yr) — positive.
- The deal already cash-flows at list — no discount required.
- Meets the 1% rule at list price ($1k rent vs $103k).
- Recommended offer: $100k (3.0% below list) — sets the bar for market timing.
- Cap rate 10.2% vs local median 3.8% in Lexington-Fayette — top-decile yield for the area; either an underpriced asset or a hidden risk that comps aren't pricing in. Stress-test before assuming the spread holds.
Location & tenants
- Location reads: area grade B — affects rentability + tenant quality, not the cash-flow math above.
- Fayette County (urban): math 35% / reading 45% proficiency, ranked #27 of 165 in KY (top 16%) — families likely to look elsewhere, expect single-tenant / working-renter base with shorter leases.
- Zoned schools: William Wells Brown Elementary (math 8% / reading 12%, grade F, #648 of 676 statewide, top 98%, 308 students, 86% FRL); Lexington Trad Magnet School (math 11% / reading 29%, grade F, #206 of 217 statewide, top 95%, 296 students, 81% FRL); Lafayette High School (math 47% / reading 54%, grade D+, #10 of 254 statewide, top 4%, 2,432 students, 38% FRL) — zoned schools average 68% FRL vs 44% district-wide (24 pts higher); higher-poverty schools than district average — tighter screening recommended.
- Zoned-school proficiency averages 27% at this address vs 40% district-wide (-13 pts) — the specific schools serving this property underperform the Fayette County average; the district grade overstates school quality for this exact location.
- Market conditions: Rents rising fast (+11.8%/yr); 82 active listings in the ZIP; 39 comparable units currently listed for rent nearby; rentals at typical pace (median 23d on market — plan ~3-4 weeks tenant-placement turnaround); lower-income renter base — watch delinquency; 1,036 units permitted in Fayette County in 2024 (542 in 5+ unit buildings).
Forward outlook
- Local home prices are declining (-3.0%/yr); year-one equity from $712 of loan paydown is wiped out by about $3k of value loss. Plan a longer hold.
- Fayette County population projected at +35% by 2050 — long-run rental-demand tailwind backs the buy-and-hold thesis.
- At projected returns (-3.0% appreciation + 8.0% rent growth), your $29k cash investment doubles in ~7 years — after that, you're playing with house money.
Negotiation context
- It's been on market 55 days — a 3% lower offer ($100k) is reasonable based on typical stale-listing flexibility.
- 3 sale attempts since 8y ago; this cycle's ask is 14% above the opening price — seller raised mid-cycle; expect resistance to lowballs.
- Current owner paid $20k; list at $103k implies a 415% gain — meaningful room to come down on a strong offer.
Risks & watch-outs
- Watch-outs: built in 1900 — expect roof / HVAC / electrical / plumbing capex.
Questions for the listing agent
- It's been on market 55 days. Have you received any prior offers? Is the seller open to a 3% concession, seller financing, or rate buy-down credit?
- Built in 1900 — when were the roof, HVAC, electrical panel, plumbing, and water heater last replaced?
- Is there a deadline driving the sale (1031 exchange, divorce, estate, relocation)? That informs how much negotiation room exists.
- What's the average days-on-market for RENTAL listings here right now (not sales)? A rising rental-DOM trend means longer vacancies and softer asking-rent achievability than the comps imply.
- What's the recent tenant-quality profile in this submarket — average credit score on applications, eviction rate, late-payment / NSF rate, and stable-employment percentage? A property-management company in the area should have these aggregated.
- How much new for-sale + rental construction is in the pipeline within 1–3 miles? Heavy new supply typically softens prices + rents 12–24 months out; constrained supply supports both.
Investment metrics
- 1% rule
- 1.29% ✓
- Cap rate
- 10.23%
- Cash-on-cash
- 14.07%
- DSCR
- 1.63
- GRM
- 6.5
CMA / ARV
- ARV (on-the-fly)
- $166,112
- Comps found
- 12
Show comp detail 12 sales within ~0.75 mi
| Address | Dist | Beds/Ba | Sqft | Sold | Price | $/sf | Match |
|---|---|---|---|---|---|---|---|
| 440 Ohio St | 0.01mi | 2/1.0 | 900 (-3%) | 12mo | $161,300 | $179 | 84 |
| 564 Ohio St | 0.21mi | 2/1.0 | 881 (-5%) | 11mo | $126,000 | $143 | 73 |
| 443 Ohio St | 0.03mi | 2/1.0 | 1,063 (+14%) | 3mo | $151,000 | $142 | 72 |
| 318 E Sixth St | 0.22mi | 1/1.0 (-1) | 854 (-8%) | 1mo | $111,650 | $131 | 70 |
| 570 Ohio St | 0.22mi | 3/2.0 (+1) | 1,014 (+9%) | 1mo | $145,000 | $143 | 65 |
| 751 Dakota St | 0.73mi | 2/1.5 | 930 (+0%) | 1mo | $205,000 | $220 | 62 |
| 549 N Limestone | 0.41mi | 2/1.0 | 840 (-10%) | 3mo | $240,000 | $286 | 62 |
| 220 W 6th St | 0.53mi | 2/2.0 | 960 (+3%) | 4mo | $221,000 | $230 | 62 |
| 545 North Limestone | 0.41mi | 2/1.0 | 1,008 (+9%) | 12mo | $245,000 | $243 | 56 |
| 635 N Martin Luther King Blvd | 0.38mi | 3/1.0 (+1) | 1,035 (+12%) | 2mo | $185,000 | $179 | 56 |
| 330 Corral St | 0.37mi | 3/1.0 (+1) | 1,056 (+14%) | 11mo | $165,000 | $156 | 46 |
| 738 Maple Ave | 0.47mi | 3/2.0 (+1) | 1,000 (+8%) | 16mo | $85,000 | $85 | 42 |
Match score weights: distance 35% · size 25% · config 20% · recency 20%. Top-matched comps best support the ARV.
Projected returns pro-forma
-3.0% appreciation · 8.0% rent growth · sell at horizon
- IRR
- 9.9%
- Equity multiple
- 1.41×
- Total profit
- $11,884
- Equity at exit
- $15,358
- IRR
- 22.8%
- Equity multiple
- 3.43×
- Total profit
- $70,119
- Equity at exit
- $8,906
Cash invested: $28,840 (down + closing). Projections, not guarantees.
Landlord ↔ Tenant lean methodology
- Overall (STATE)
- 83 Strongly Landlord-Friendly
- State Kentucky
- 83 Strongly Landlord-Friendly · R+16
- County
- — inherits STATE
- City
- — inherits STATE
ZIP-level market 40508
- Rents YoY
- 11.8%
- Active inventory
- 82
- Price-to-rent
- 6.5×
Monthly cashflow live
- Estimated rent
- $1,329 high interval (Pro) →
- Mortgage (P&I)
- −$540
- Tax est. 1.5%
- −$129 /mo · $1,545/yr
- Insurance
- −$43
- HOA
- −$0
- Vacancy / Maint / Mgmt
- −$279
- Net cashflow
- $338
Break-even live
UW: 25.0% down · 7.5% · 30yr · 1.5% tax · 5.0% vac · 8.0% maint · 8.0% mgmt
Financing live
Cash to close
- Down payment
- $25,750
- Closing costs
- $3,090
- Reserves months
- —
- Total cash needed
- —
Loan-product check · same deal, 3 products live
Conventional
25% down · 7.5% · 30yr
- Down + closing
- —
- Monthly P&I
- —
- Monthly cashflow
- —
- DSCR
- —
- Eligible?
- —
Personal DTI + credit; lowest rate.
DSCR
20% down · 8.5% · 30yr
- Down + closing
- —
- Monthly P&I
- —
- Monthly cashflow
- —
- DSCR
- —
- Eligible?
- —
No personal income docs; deal must DSCR.
Hard money
10% down · 12.0% · 12mo
- Down + closing
- —
- Monthly P&I
- —
- Monthly cashflow
- —
- DSCR
- —
- Eligible?
- —
Short-term bridge; refi at stabilization.
Rent comps 39 comps
| Address | Beds | Baths | Sqft | Rent | $/sqft | DOM | Units | Dist |
|---|---|---|---|---|---|---|---|---|
| 500 Ohio St Unit 3 Lexington, KY | 1.0 | 1.0 | 825 | $695 | $0.84 | 13d | 1 | 0.08mi |
| 425 Hawkins Ave Lexington, KY | 3.0 | 1.5 | 1124 | $1,570 | $1.40 | 13d | 1 | 0.10mi |
| 426 E Fifth St Unit Z1 Lexington, KY | 2.0 | 1.0 | 719 | $1,195 | $1.66 | 23d | 1 | 0.12mi |
| 434 N Martin Luther King Blvd #201 Lexington, KY | 2.0 | 2.0 | 950 | $1,450 | $1.53 | 23d | 1 | 0.20mi |
| 402 Gunn St #202 Lexington, KY | 1.0 | 1.0 | 625 | $900 | $1.44 | 23d | 1 | 0.29mi |
| 402 Gunn St #201 Lexington, KY | 1.0 | 1.0 | 625 | $950 | $1.52 | 23d | 1 | 0.29mi |
| 246 Warnock St Lexington, KY | 2.0 | 1.0 | 810 | $1,195 | $1.48 | 23d | 1 | 0.33mi |
| 236 Warnock St Lexington, KY | 3.0 | 1.0 | 1028 | $2,200 | $2.14 | 23d | 1 | 0.34mi |
| 214 E Seventh St Lexington, KY | 2.0 | 1.0 | 832 | $1,000 | $1.20 | 23d | 1 | 0.39mi |
| 706 Lancaster Ave Lexington, KY | 3.0 | 3.0 | 1050 | $1,495 | $1.42 | 13d | 1 | 0.41mi |
| 199 Eddie St Lexington, KY | 2.0 | 1.0 | 552 | $1,295 | $2.35 | 13d | 1 | 0.46mi |
| 653 Jackson St Lexington, KY | 2.0 | 1.0 | 839 | $1,295 | $1.54 | 13d | 1 | 0.50mi |
| 222 W Sixth St Lexington, KY | 3.0 | 1.5 | 1050 | $1,150 | $1.10 | 23d | 1 | 0.51mi |
| 325 W 6th St Lexington, KY | 1.0 | 1.0 | 900 | $1,300 | $1.44 | 23d | 1 | 0.59mi |
| 161 E Loudon Ave Lexington, KY | 2.0 | 1.0 | 1118 | $1,300 | $1.16 | 23d | 1 | 0.63mi |
| 547 N Broadway #2 Lexington, KY | 1.0 | 1.0 | 650 | $1,000 | $1.54 | 23d | 1 | 0.63mi |
| 120 E Main St Lexington, KY | 2.0 | 1.0–2.0 | 710 | $2,486 | $3.50 | 13d | 20 | 0.67mi |
| 143 Woodland Ave Lexington, KY | 2.0 | 1.0 | 1100 | $1,650 | $1.50 | 23d | 1 | 0.74mi |
| 341 Grosvenor Ave #4 Lexington, KY | 3.0 | 3.0 | 859 | $2,600 | $3.03 | 23d | 1 | 0.80mi |
| 341 Grosvenor Ave Unit 1 Lexington, KY | 3.0 | 2.0 | 700 | $2,050 | $2.93 | 23d | 1 | 0.80mi |
| 341 Grosvenor Ave Unit 3 Lexington, KY | 3.0 | 3.0 | 875 | $2,500 | $2.86 | 23d | 1 | 0.80mi |
| 115 W Loudon Ave Unit L97 Lexington, KY | 3.0 | 2.0 | 960 | $980 | $1.02 | 23d | 1 | 0.81mi |
| 342 Grosvenor Ave Apt 2 Lexington, KY | 1.0 | 1.0 | 650 | $850 | $1.31 | 23d | 1 | 0.83mi |
| 168 Woodland Ave Unit 2 Lexington, KY | 1.0 | 1.0 | 620 | $925 | $1.49 | 23d | 1 | 0.83mi |
| 51 Mentelle Park Unit 4 Lexington, KY | 1.0 | 1.0 | 1000 | $1,060 | $1.06 | 13d | 1 | 0.88mi |
| 139 N Hanover Ave Lexington, KY | 2.0 | 1.0 | 600 | $1,275 | $2.12 | 23d | 1 | 0.88mi |
| 261 S Limestone #303 Lexington, KY | 2.0 | 2.0 | 1102 | $2,995 | $2.72 | 23d | 1 | 0.91mi |
| 275 S Limestone #115 Lexington, KY | 2.0 | 2.0 | 1010 | $2,500 | $2.48 | 23d | 1 | 0.92mi |
| 811 Shelby Ave Unit Z1 Lexington, KY | 2.0 | 1.0 | 792 | $1,224 | $1.55 | 13d | 1 | 0.95mi |
| 530 E High St Lexington, KY | 1.0 | 1.0 | 685 | $1,171 | $1.71 | 13d | 1 | 0.97mi |
| 330 Rose St Lexington, KY | 1.0–2.0 | 1.0 | 627 | $1,450 | $2.31 | 23d | 1 | 0.97mi |
| 345 Blackburn Ave Lexington, KY | 2.0 | 2.0 | 946 | $1,925 | $2.03 | 13d | 1 | 0.99mi |
| 330 Newtown Pike Lexington, KY | 1.0–3.0 | 1.0–2.0 | 976 | $1,205 | $1.23 | 23d | 1 | 1.11mi |
| 161 Preston Ave #3 Lexington, KY | 2.0 | 1.0 | 900 | $1,500 | $1.67 | 13d | 1 | 1.18mi |
| 585 S Upper St #114 Lexington, KY | 2.0 | 2.0 | 1000 | $1,995 | $2.00 | 23d | 1 | 1.23mi |
| 232 Bassett Ave Lexington, KY | 2.0 | 1.0 | 989 | $1,495 | $1.51 | 13d | 1 | 1.24mi |
| 723 Charles Ave Lexington, KY | 3.0 | 1.0 | 992 | $1,300 | $1.31 | 13d | 1 | 1.24mi |
| 832 W High St Unit 1 Lexington, KY | 3.0 | 1.5 | 900 | $1,400 | $1.56 | 23d | 1 | 1.25mi |
| 150 Northland Dr Lexington, KY | 1.0 | 1.0 | 660 | $900 | $1.36 | 23d | 1 | 1.27mi |
Listing history 28 events
-
2026-06-18days on market $103,000 Active 55 DOM
-
2026-06-17days on market $103,000 Active 54 DOM
-
2026-06-16days on market $103,000 Active 53 DOM
-
2026-06-15days on market $103,000 Active 52 DOM
-
2026-06-14days on market $103,000 Active 50 DOM
-
2026-06-13days on market $103,000 Active 49 DOM
-
2026-06-10days on market $103,000 Active 47 DOM
-
2026-06-09days on market $103,000 Active 46 DOM
-
2026-06-08days on market $103,000 Active 45 DOM
-
2026-06-07days on market $103,000 Active 44 DOM
-
2026-06-05days on market $103,000 Active 41 DOM
-
2026-06-03days on market $103,000 Active 40 DOM
-
2026-06-02days on market $103,000 Active 39 DOM
-
2026-06-01days on market $103,000 Active 38 DOM
-
2026-05-31days on market $103,000 Active 37 DOM
-
2026-05-06price $103,000
-
2026-04-28price $105,000
-
2026-04-24$89,999 Active
-
2026-04-12historical
-
2026-04-06price $95,000
-
2026-04-01$100,000 Active
-
2018-10-10historical
-
2018-10-05soldstatus $20,000
-
2018-09-19soldstatus $230,000
-
2018-09-13price $29,999
-
2018-08-27$39,000 Active
-
2016-06-24soldstatus $516,800
-
2016-06-08soldstatus $516,800
ⓘ Source: listings_history table (triggers on properties + properties_extension) + one-shot
backfill from property_details.listing_events for pre-trigger history.
Climate risk First Street
- Flood 1/10 Low FEMA zone X (unshaded) · 0% chance over 30 yrs
- Wildfire 1/10 Low
- Heat 4/10 Moderate 7 d/yr ≥101°F today · 19 d/yr by 30 yrs out
- Wind 2/10 Low 100% chance of damaging wind over 30 yrs
- Air quality 1/10 Low 0 unhealthy d/yr today · 0 by 30 yrs out
Nearby sold comps map
Loading sold comps map…
Walkable amenities ~0.75 mi
Loading nearby amenities…
Taxation est. · year 1
- Rental income
- $15,947
- − Mortgage interest
- −$5,770
- − Property taxes
- −$1,545
- − Insurance
- −$515
- − Repairs & maintenance
- −$1,276
- − Management
- −$1,276
- − Depreciation
- −$2,996
- Taxable income
- $2,570
- Est. tax owed @ 24.0%
- −$617
- After-tax cash flow
- $3,440/yr
For passive investors: Depreciation is non-cash, so a rental often shows a tax loss while cash-flowing — sheltering income. Rental losses are passive: they offset passive income freely, and up to $25,000/yr can offset ordinary (W-2) income if you actively participate and your MAGI is under $100k (phasing out to $0 by $150k); unused losses carry forward. On sale, claimed depreciation is recaptured at up to 25%, and gains may owe capital-gains tax (a 1031 exchange can defer both). Figures are a year-1 estimate at your 24.0% rate — not tax advice; consult a CPA.
Schools (NCES district)
- District
- Fayette County
- NCES district ID
- 2101860
- Math proficiency
- 35% ▼ -16.00%
- Reading proficiency
- 45% ▼ -13.00%
- Median HH income
- $49,245
- Composite
- 34.38/100
- National rank
- #5211
- State rank
- #27 of 165 in KY
Livability — Lexington-Fayette
No livability data for this city. (Only ~50 U.S. cities are tracked.)
Census & demographics
- Census place
- Lexington-Fayette, KY
- County
- Fayette County · 317,143 people
- City population
- 321,882
- Metro
- Lexington-Fayette, KY
- Population (ZIP)
- 23,756
- Household income
- $29,440
- Rent vs Own
- Severe rent burden
- 2644.0
Population outlook (Fayette County) Hauer SSP2
- Today (2025)
- 363,454 people
- By 2030
- 388,270 · +6.8%
- By 2040
- 438,688 · +20.7%
- By 2050
- 490,667 · +35.0%
- By 2075
- 625,394 · +72.1%
- By 2100
- 721,354 · +98.5%
Race, ethnicity, and origin ACS 2023
- Neighborhood character
- Diverse neighborhood (Simpson 0.58)
- Race & ethnicity
- White 60% Black 22% Hispanic / Latino 9% Two or more races 7% Asian 3%
- Hispanic origin (detail)
- Mexican 5%
- Common ancestry
- Serbian 2% Italian 2% Lithuanian 2%
- Foreign-born
- 9% · Canada, China
- Languages at home
- 87% English-only · Spanish 8% Chinese 1% Other Indo-European 1%
Political lean MEDSL · Fayette
- 2024 margin
- D (+18.1) · D 58.0% · R 39.9% · Other 2.1%
- 2008→2024 swing
- +13.3pp toward D · 2008: 4.8pp · 2024: 18.1pp
- All cycles
- 2024: D+18.1 2020: D+20.8 2016: D+9.5 2012: D+1.0 2008: D+4.8
Not yet ingested
- Civics
- —
Market trends
- HPI YoY
- ▼ -251.04%
- Current HPI
- 204.3994
- Rent YoY
- ▲ 11.83%
- Metro
- Lexington-Fayette, KY
- State GDP YoY
- ▲ 1.81%
- F500 in state
- 4
Industry mix (Fortune 500 HQ in KY)
| Industry | F500 HQs | Revenue |
|---|---|---|
| Healthcare | 1 | $118B |
|
||
| Food / Beverage | 1 | $7B |
|
||
Price history
-80.1% since first listed13 events — show timeline
- 2026-05-06 Price Changed $103,000 ImagineMLS
- 2026-04-28 Price Changed $105,000 ImagineMLS
- 2026-04-24 Listed $89,999 ImagineMLS
- 2026-04-12 Listing Removed — ImagineMLS
- 2026-04-06 Price Changed $95,000 ImagineMLS
- 2026-04-01 Listed $100,000 ImagineMLS
- 2018-10-10 Listing Removed — ImagineMLS
- 2018-10-05 Sold (Public Records) $20,000 Public Records
- 2018-09-19 Sold (Public Records) $230,000 Public Records
- 2018-09-13 Price Changed $29,999 ImagineMLS
- 2018-08-27 Listed $39,000 ImagineMLS
- 2016-06-24 Sold (Public Records) $516,800 Public Records
- 2016-06-08 Sold (Public Records) $516,800 Public Records
Property tax history
+1.8%/yrLatest (2015): $169 · +1.8% YoY. Source: county tax records.
Cash-flow waterfall
monthlySold comps — $/sqft
last 12 mo · ≤1 miLoading sold comps…