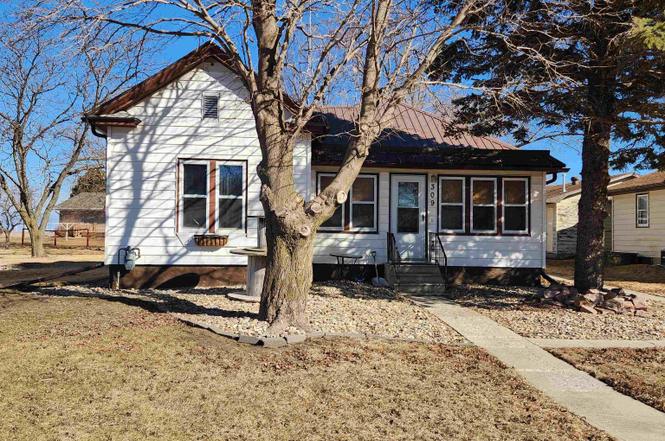
309 Iowa St · Archer, IA
Flood risk 1/10 · Minimal
- FEMA flood zone
- X (unshaded)
- Chance of flooding over 30 yrs
- 0.0%
- Est. flood insurance / yr
- $473 – $860
Fire risk 1/10 · Minimal
- Est. fire insurance / yr
- $902 – $1,676
Heat risk 3/10 · Minor
- Hot days now (above 101°F)
- 7 days/yr
- Hot days in 30 yrs
- 15 days/yr
Wind risk 2/10 · Minimal
- Chance of severe wind over 30 yrs
- —
Air-quality risk 1/10 · Minimal
- Unhealthy air days now
- 0 days/yr
- Unhealthy air days in 30 yrs
- 0 days/yr
Risk factors via First Street. Map © Google.
Why this score? — see what drove the D+ grade
The composite is a weighted blend of 9 inputs, each scored 0–100. Each bar is that input's sub-score; the figure is the points it added to the 100-point composite (weight × sub-score).
- Cash flow +14.2/30.0
- Appreciation +8.9/10.0
- Schools +6.4/10.0
- DSCR +4.3/10.0
- 1% rule +3.1/10.0
- ARV discount +3.1/15.0
- Livability +3.1/5.0
- Rent growth +2.5/5.0
- Condition / age +2.5/5.0
$109,000
🖨 Deal sheet 📄 Offer letter ✓ Due diligence
Listing remarks
Looking to stop renting and start owning? Looking for an investment property? This ranch style home offers 2 bedrooms, a 3/4 bathroom, eat-in kitchen, laundry room and a nice sized living room on the main floor with additional space for storage in the basement. Outside you will find a 2 stall detached garage which is insulated and contains a finished bonus room. There is also a 12'x20' garden shed for all your storage needs. The large yard and raised garden beds finish off the outdoor space. Affordable, comfortable, and ready for its next chapter!
Key facts
- Finished bonus room
- Laundry room
- Ranch style home
Tags
Neighborhood map
What this means for you Summary
Snapshot
- This is a 2-bed/1.5-bath single-family listed at $109k.
Deal economics
- At list price, monthly cash flow is $17 ($206/yr) — positive.
- The deal already cash-flows at list — no discount required.
- To meet the 1% rule (rent ≥ 1% of price), the offer needs to be $88k (19.3% below list).
- Recommended offer: $88k (19.3% below list) — sets the bar for 1% rule.
Location & tenants
- Location reads 61/100 on livability (#792 in IA) — a middle-class / working-renter tenant base. Strengths: cost of living A+, housing B; Watch: employment D+, health & safety D, amenities F.
- Sheldon Community School District (town): math 74% / reading 78% proficiency, ranked #63 of 289 in IA (top 22%) — strong family-tenant draw, lease renewals of 3-5y typical.
- Zoned schools: Sheldon Middle School (math 70% / reading 78%, grade A, #83 of 246 statewide, top 34%, 320 students, 47% FRL); Sheldon High School (math 73% / reading 81%, grade A-, #60 of 336 statewide, top 21%, 342 students, 39% FRL).
- Market conditions: 4 active listings in the ZIP; 13 units permitted in O'Brien County in 2024 (0 in 5+ unit buildings).
Forward outlook
- In year one you build about $9k of equity ($754 loan paydown + $8k appreciation (7.7% local appreciation)).
- O'Brien County population projected at -11% by 2050 — secular population decline; favor cash flow + early exit over multi-decade hold.
- At projected returns (7.7% appreciation + 3.0% rent growth), your $31k cash investment doubles in ~3 years — after that, you're playing with house money.
- By year 4, paydown + projected appreciation supports a ~$32k cash-out refi (75% LTV) — recoverable capital for the next deal without selling this one.
Negotiation context
- It's been on market 42 days — a 3% lower offer ($106k) is reasonable based on typical stale-listing flexibility.
- 2 sale attempts with the ask held roughly flat each time — persistent listings suggest the price (not the market) is what's stuck; bring a comps-based counter.
- Current owner paid $72k; list at $109k implies a 50% gain — meaningful room to come down on a strong offer.
Risks & watch-outs
- Watch-outs: built in 1904 — expect roof / HVAC / electrical / plumbing capex.
Questions for the listing agent
- It's been on market 42 days. Have you received any prior offers? Is the seller open to a 19% concession, seller financing, or rate buy-down credit?
- Built in 1904 — when were the roof, HVAC, electrical panel, plumbing, and water heater last replaced?
- Is there a deadline driving the sale (1031 exchange, divorce, estate, relocation)? That informs how much negotiation room exists.
- Schools are D-rated, which usually means shorter tenancies and higher turnover. Who's the typical renter profile here, and what's been the actual vacancy rate?
- The area grade is low — what's the realistic commute time and amenity access for the typical tenant pool here? Any planned neighborhood developments (good or bad) we should know about?
- What's the average days-on-market for RENTAL listings here right now (not sales)? A rising rental-DOM trend means longer vacancies and softer asking-rent achievability than the comps imply.
- What's the recent tenant-quality profile in this submarket — average credit score on applications, eviction rate, late-payment / NSF rate, and stable-employment percentage? A property-management company in the area should have these aggregated.
- How much new for-sale + rental construction is in the pipeline within 1–3 miles? Heavy new supply typically softens prices + rents 12–24 months out; constrained supply supports both.
Investment metrics
- 1% rule
- 0.81% ✗
- Cap rate
- 6.48%
- Cash-on-cash
- 0.68%
- DSCR
- 1.03
- GRM
- 10.3
CMA / ARV
- ARV (on-the-fly)
- $99,330
- Comps found
- 2
Show comp detail 2 sales within ~0.75 mi
| Address | Dist | Beds/Ba | Sqft | Sold | Price | $/sf | Match |
|---|---|---|---|---|---|---|---|
| 309 Iowa St | 0.00mi | 2/1.0 | 946 (0%) | 0mo | $99,000 | $105 | 98 |
| 404 Fletcher Ave | 0.16mi | 3/1.0 (+1) | 1,085 (+15%) | 8mo | $112,500 | $104 | 54 |
Match score weights: distance 35% · size 25% · config 20% · recency 20%. Top-matched comps best support the ARV.
Projected returns pro-forma
7.73% appreciation · 3.0% rent growth · sell at horizon
- IRR
- 19.9%
- Equity multiple
- 2.45×
- Total profit
- $44,117
- Equity at exit
- $80,846
- IRR
- 18.6%
- Equity multiple
- 5.16×
- Total profit
- $127,082
- Equity at exit
- $158,640
Cash invested: $30,520 (down + closing). Projections, not guarantees.
Landlord ↔ Tenant lean methodology
- Overall (STATE)
- 83 Strongly Landlord-Friendly
- State Iowa
- 83 Strongly Landlord-Friendly · R+6
- County
- — inherits STATE
- City
- — inherits STATE
ZIP-level market 51231
- Home prices YoY
- 4.9%
- Active inventory
- 4
- Price-to-rent
- 10.3×
Monthly cashflow live
- Estimated rent
- $880 medium interval (Pro) →
- Mortgage (P&I)
- −$572
- Tax from tax record
- −$61 /mo · $730/yr
- Insurance
- −$45
- HOA
- −$0
- Vacancy / Maint / Mgmt
- −$185
- Net cashflow
- $17
Break-even live
UW: 25.0% down · 7.5% · 30yr · 1.5% tax · 5.0% vac · 8.0% maint · 8.0% mgmt
Financing live
Cash to close
- Down payment
- $27,250
- Closing costs
- $3,270
- Reserves months
- —
- Total cash needed
- —
Loan-product check · same deal, 3 products live
Conventional
25% down · 7.5% · 30yr
- Down + closing
- —
- Monthly P&I
- —
- Monthly cashflow
- —
- DSCR
- —
- Eligible?
- —
Personal DTI + credit; lowest rate.
DSCR
20% down · 8.5% · 30yr
- Down + closing
- —
- Monthly P&I
- —
- Monthly cashflow
- —
- DSCR
- —
- Eligible?
- —
No personal income docs; deal must DSCR.
Hard money
10% down · 12.0% · 12mo
- Down + closing
- —
- Monthly P&I
- —
- Monthly cashflow
- —
- DSCR
- —
- Eligible?
- —
Short-term bridge; refi at stabilization.
Listing history 5 events
-
2026-04-27status Pending
-
2026-04-07status Active
-
2026-03-24status Pending
-
2026-03-02$109,000 Active
-
2020-12-21soldstatus $72,500
ⓘ Source: listings_history table (triggers on properties + properties_extension) + one-shot
backfill from property_details.listing_events for pre-trigger history.
Tax reassessment forecast IA · Partial reset (capped growth)
- Current annual tax
- $730 · $61/mo
- Projected year-2 tax
- $1,221 · $102/mo
- Expected delta
- +$491/yr (+$41/mo · 67.2%)
ⓘ Screening estimate from a state-policy table — verify with the county assessor before closing.
Climate risk First Street
- Flood 1/10 Low FEMA zone X (unshaded) · 0% chance over 30 yrs
- Wildfire 1/10 Low
- Heat 3/10 Moderate 7 d/yr ≥101°F today · 15 d/yr by 30 yrs out
- Wind 2/10 Low
- Air quality 1/10 Low 0 unhealthy d/yr today · 0 by 30 yrs out
Nearby sold comps map
Loading sold comps map…
Walkable amenities ~0.75 mi
Loading nearby amenities…
Taxation est. · year 1
- Rental income
- $10,558
- − Mortgage interest
- −$6,106
- − Property taxes
- −$730
- − Insurance
- −$545
- − Repairs & maintenance
- −$845
- − Management
- −$845
- − Depreciation
- −$3,171
- Taxable loss
- −$1,683
- Est. tax savings @ 24.0%
- +$404
- After-tax cash flow
- $610/yr
For passive investors: Depreciation is non-cash, so a rental often shows a tax loss while cash-flowing — sheltering income. Rental losses are passive: they offset passive income freely, and up to $25,000/yr can offset ordinary (W-2) income if you actively participate and your MAGI is under $100k (phasing out to $0 by $150k); unused losses carry forward. On sale, claimed depreciation is recaptured at up to 25%, and gains may owe capital-gains tax (a 1031 exchange can defer both). Figures are a year-1 estimate at your 24.0% rate — not tax advice; consult a CPA.
Schools (NCES district)
- District
- Sheldon Community School District
- NCES district ID
- 1925980
- Math proficiency
- 74% ▼ -4.00%
- Reading proficiency
- 78% ▬ 0.00%
- Median HH income
- $50,644
- Composite
- 64.39/100
- National rank
- #545
- State rank
- #63 of 289 in IA
Livability — Archer
- Score
- 61/100
- State rank
- #792
- US rank
- #17924
Category grades
Schools grade is shown separately in the Schools card above.
Census & demographics
- Census place
- Archer, IA
- Population (ZIP)
- 543
Population outlook (O'Brien County) Hauer SSP2
- Today (2025)
- 13,353 people
- By 2030
- 13,040 · -2.3%
- By 2040
- 12,422 · -7.0%
- By 2050
- 11,887 · -11.0%
- By 2075
- 11,132 · -16.6%
- By 2100
- 10,176 · -23.8%
Race, ethnicity, and origin ACS 2023
- Neighborhood character
- Predominantly White (100%)
- Race & ethnicity
- White 100%
- Common ancestry
- Iranian 8% Portuguese 1%
- Foreign-born
- 0%
- Languages at home
- 98% English-only · Spanish 2%
Political lean MEDSL · O'Brien
- 2024 margin
- Solid R (+60.9) · D 19.0% · R 80.0% · Other 1.0%
- 2008→2024 swing
- -26.1pp toward R · 2008: -34.9pp · 2024: -60.9pp
- All cycles
- 2024: R+60.9 2020: R+56.8 2016: R+60.2 2012: R+45.2 2008: R+34.9
Not yet ingested
- Civics
- —
Market trends
- HPI YoY
- ▲ 7.73%
- Current HPI
- 165.2763
- Rent YoY
- —
- Metro
- —
- State GDP YoY
- ▲ 2.48%
- F500 in state
- 4
Industry mix (Fortune 500 HQ in IA)
| Industry | F500 HQs | Revenue |
|---|---|---|
| Financial Services | 1 | $16B |
|
||
| Retail / Convenience | 1 | $15B |
|
||
Price history
+50.3% since first listed5 events — show timeline
- 2026-04-27 Pending — NWIA
- 2026-04-07 Relisted — NWIA
- 2026-03-24 Pending — NWIA
- 2026-03-02 Listed $109,000 NWIA
- 2020-12-21 Sold (Public Records) $72,500 Public Records
Property tax history
+17.7%/yrLatest (2025): $730 · +5.2% YoY. Source: county tax records.
Cash-flow waterfall
monthlySold comps — $/sqft
last 12 mo · ≤1 miLoading sold comps…