 Triplex
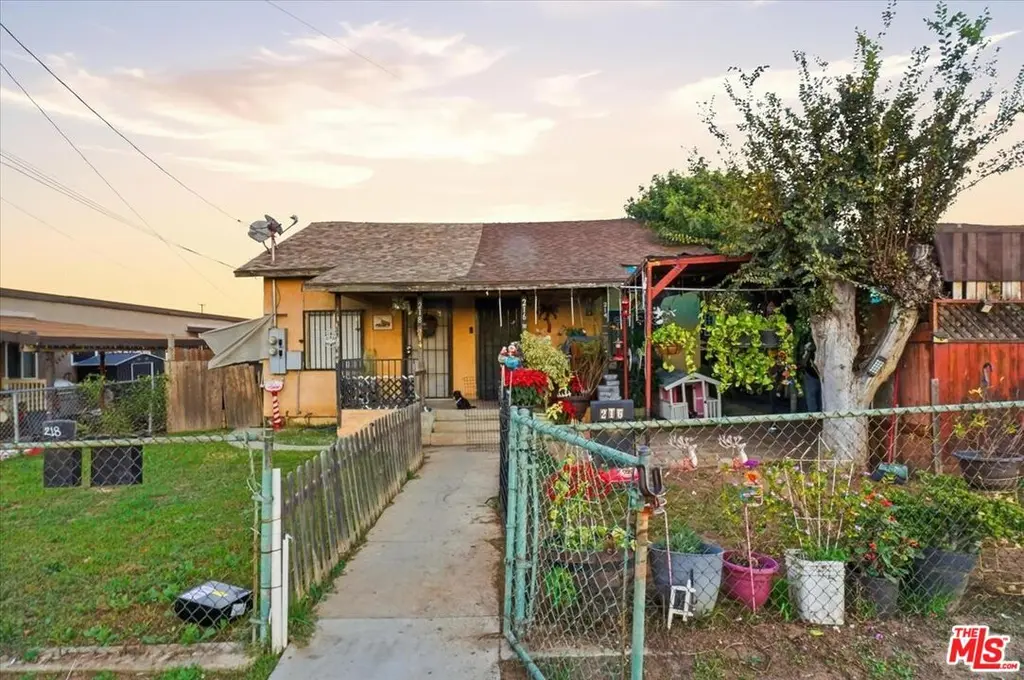
214 N Alma Ave · East Los Angeles, CA
Flood risk 1/10 · Minimal
- FEMA flood zone
- X (unshaded)
- Chance of flooding over 30 yrs
- 0.0%
- Est. flood insurance / yr
- $507 – $1,088
Fire risk 1/10 · Minimal
- Est. fire insurance / yr
- $659 – $1,223
Heat risk 6/10 · Moderate
- Hot days now (above 94°F)
- 7 days/yr
- Hot days in 30 yrs
- 21 days/yr
Wind risk 1/10 · Minimal
- Chance of severe wind over 30 yrs
- —
Air-quality risk 5/10 · Moderate
- Unhealthy air days now
- 9 days/yr
- Unhealthy air days in 30 yrs
- 9 days/yr
Risk factors via First Street. Map © Google.
Why this score? — see what drove the C+ grade
The composite is a weighted blend of 9 inputs, each scored 0–100. Each bar is that input's sub-score; the figure is the points it added to the 100-point composite (weight × sub-score).
- Cash flow +27.0/30.0
- ARV discount +10.7/15.0
- DSCR +9.4/10.0
- 1% rule +6.3/10.0
- Schools +3.6/10.0
- Livability +3.0/5.0
- Condition / age +2.5/5.0
- Rent growth +1.7/5.0
- Appreciation +0.0/10.0
$670,000
🖨 Deal sheet 📄 Offer letter ✓ Due diligence
Multi-family units
County records classify this as Multi-Family (2-4 Unit). Listing-text estimate: 3 units. confirmed
Listing remarks MLS
Investment opportunity at 214 N Alma Ave featuring a triplex with three units, each offering 2 bedrooms and 1 bathroom. This property presents strong income potential and is ideal for investors or owner occupants seeking rental income. Each unit offers a functional layout with the opportunity to add value over time. Conveniently located near shopping, dining, schools, and major transportation routes, providing consistent rental demand. Buyer to verify all information and condition of the property. A great opportunity to own a multi unit property with long term upside and income potential.
Key facts
- 6,513 sq ft lot
- Parking
- Built 1921
Neighborhood map
What this means for you Summary
Snapshot
- This is a 3 × 2-bed/1.0-bath units multifamily listed at $670k.
Deal economics
- At list price, monthly cash flow is $2k ($23k/yr) — positive. Per door: $628/mo.
- The deal already cash-flows at list — no discount required.
- Meets the 1% rule at list price ($8k rent vs $670k).
- Recommended offer: $630k (6.0% below list) — sets the bar for market timing.
- Cap rate 9.7% vs local median 3.7% in East Los Angeles — top-decile yield for the area; either an underpriced asset or a hidden risk that comps aren't pricing in. Stress-test before assuming the spread holds.
Location & tenants
- Location reads 60/100 on livability (#594 in CA) — a middle-class / working-renter tenant base. Strengths: commute A+, schools B+; Watch: employment C-, health & safety D, crime F.
- Los Angeles Unified (urban): math 29% / reading 54% proficiency, ranked #223 of 517 in CA (top 43%) — families likely to look elsewhere, expect single-tenant / working-renter base with shorter leases; 67% free/reduced lunch — lower-income household profile, screen leases tightly.
- Market conditions: Rents falling (-3.3%/yr); 80 active listings in the ZIP; 40 comparable units currently listed for rent nearby; rentals lingering (median 44d on market — plan ~5-8 weeks vacancy on turnover, expect pricing pressure); 52% of comp listings sitting > 30 days — soft ceiling on asking rent; 19,697 units permitted in Los Angeles County in 2024 (9,426 in 5+ unit buildings).
- At $7,580/mo this rent would consume 125% of the median local household income ($73k/yr) (locally 1857% of renters already pay >50% of income on rent) — very limited rent-growth headroom before tenants either downsize or default.
Forward outlook
- Local home prices are declining (-3.0%/yr); year-one equity from $5k of loan paydown is wiped out by about $20k of value loss. Plan a longer hold.
- Los Angeles County population projected at +9% by 2050 — modest demand growth; plan on rents tracking national, not racing it.
Negotiation context
- It's been on market 69 days — a 6% lower offer ($630k) is reasonable based on typical stale-listing flexibility.
- 3 sale attempts with the ask held roughly flat each time — persistent listings suggest the price (not the market) is what's stuck; bring a comps-based counter.
Risks & watch-outs
- Watch-outs: built in 1921 — expect roof / HVAC / electrical / plumbing capex.
- Climate carrying-cost: extreme-heat days projected 7→21/yr by 2055 (HVAC capex compounding) — expect insurance premiums to compound above CPI over the hold.
Questions for the listing agent
- It's been on market 69 days. Have you received any prior offers? Is the seller open to a 6% concession, seller financing, or rate buy-down credit?
- Can we see the unit-by-unit rent roll, current vacancy, and any below-market leases? What's the average tenancy length?
- What capital expenditures (roof, boiler, parking lot, exteriors) have been made in the last 5 years, and what's planned in the next 2?
- Built in 1921 — when were the roof, HVAC, electrical panel, plumbing, and water heater last replaced?
- Why hasn't it sold? Are there any deal-killer items the seller is aware of (foundation, flood, title, zoning, code violations)?
- Is there a deadline driving the sale (1031 exchange, divorce, estate, relocation)? That informs how much negotiation room exists.
- Schools are B-rated — typically a magnet for longer-tenancy family renters. What's the average tenant stay here, and is there a school-zone premium baked into asking?
- Crime grade is F in this area — have there been break-ins, vandalism, or insurance claims at this property in the last 3 years? What carrier currently insures it and at what premium?
- What's the average days-on-market for RENTAL listings here right now (not sales)? A rising rental-DOM trend means longer vacancies and softer asking-rent achievability than the comps imply.
- What's the recent tenant-quality profile in this submarket — average credit score on applications, eviction rate, late-payment / NSF rate, and stable-employment percentage? A property-management company in the area should have these aggregated.
- How much new apartment / multifamily construction is in the pipeline within 1–3 miles? Heavy new supply (>2% of stock underway) typically softens rents 12–24 months out; light construction supports rent growth.
Investment metrics
- 1% rule
- 1.13% ✓
- Cap rate
- 9.67%
- Cash-on-cash
- 12.04%
- DSCR
- 1.54
- GRM
- 7.4
CMA / ARV
- ARV (median comp)
- $720,552
- List price
- $670,000
- Delta
- -7.02%
- Verdict
- FAIR
- Comps
- 20 within 1.0 mi
Projected returns pro-forma
-3.0% appreciation · 0.0% rent growth · sell at horizon
- IRR
- -1.6%
- Equity multiple
- 0.94×
- Total profit
- $-11,076
- Equity at exit
- $99,899
- IRR
- 4.8%
- Equity multiple
- 1.31×
- Total profit
- $58,072
- Equity at exit
- $57,929
Cash invested: $187,600 (down + closing). Projections, not guarantees.
Landlord ↔ Tenant lean methodology
- Overall (STATE)
- 18 Strongly Tenant-Friendly
- State California
- 18 Strongly Tenant-Friendly · D+13
- County
- — inherits STATE
- City
- — inherits STATE
ZIP-level market 90063
- Rents YoY
- -3.3%
- Active inventory
- 80
- Price-to-rent
- 22.1×
Monthly cashflow live
- Estimated rent
- $7,580 high interval (Pro) →
- Mortgage (P&I)
- −$3,514
- Tax from tax record
- −$313 /mo · $3,752/yr
- Insurance
- −$279
- HOA
- −$0
- Vacancy / Maint / Mgmt
- −$1,592
- Net cashflow
- $1,883
Break-even live
3-unit breakdown (identical units grouped — click to expand)
| Units | Beds | Baths | Est. rent |
|---|---|---|---|
| 3× units | 2 | 1 | $7,581 |
| #1 | 2 | 1 | $2,527 |
| #2 | 2 | 1 | $2,527 |
| #3 | 2 | 1 | $2,527 |
| Total (3 units) | $7,580 | ||
UW: 25.0% down · 7.5% · 30yr · 1.5% tax · 5.0% vac · 8.0% maint · 8.0% mgmt
Financing live
Cash to close
- Down payment
- $167,500
- Closing costs
- $20,100
- Reserves months
- —
- Total cash needed
- —
Loan-product check · same deal, 3 products live
Conventional
25% down · 7.5% · 30yr
- Down + closing
- —
- Monthly P&I
- —
- Monthly cashflow
- —
- DSCR
- —
- Eligible?
- —
Personal DTI + credit; lowest rate.
DSCR
20% down · 8.5% · 30yr
- Down + closing
- —
- Monthly P&I
- —
- Monthly cashflow
- —
- DSCR
- —
- Eligible?
- —
No personal income docs; deal must DSCR.
Hard money
10% down · 12.0% · 12mo
- Down + closing
- —
- Monthly P&I
- —
- Monthly cashflow
- —
- DSCR
- —
- Eligible?
- —
Short-term bridge; refi at stabilization.
Rent comps 40 comps
| Address | Beds | Baths | Sqft | Rent | $/sqft | DOM | Units | Dist |
|---|---|---|---|---|---|---|---|---|
| 107 S Dacotah St Los Angeles, CA | 1.0 | 1.0 | 510 | $1,895 | $3.72 | 1d | 1 | 0.55mi |
| 519 S Rowan Ave Unit 519 Los Angeles, CA | 1.0 | 1.0 | 500 | $1,850 | $3.70 | 10d | 1 | 0.66mi |
| 150 1/2 S Bonnie Beach Pl Los Angeles, CA | 1.0 | 1.0 | 700 | $1,800 | $2.57 | 24d | 1 | 0.67mi |
| 4039 1/2 San Carlos St Los Angeles, CA | 1.0 | 1.0 | 450 | $1,595 | $3.54 | 43d | 1 | 0.67mi |
| 3143 Wabash Ave Unit 3141-2 Los Angeles, CA | 1.0 | 1.0 | 604 | $1,590 | $2.63 | 43d | 1 | 0.67mi |
| 3143 Wabash Ave Unit 3143-10 Los Angeles, CA | 1.0 | 1.0 | 604 | $1,590 | $2.63 | 24d | 1 | 0.67mi |
| 4045 San Carlos St Los Angeles, CA | 2.0 | 1.0 | 700 | $2,550 | $3.64 | 7d | 1 | 0.68mi |
| 3261 City Terrace Dr Unit 3257 Los Angeles, CA | — | 1.0 | 500 | $1,200 | $2.40 | 24d | 1 | 0.68mi |
| 477 Nassau Ave Unit 479A Los Angeles, CA | — | 1.0 | 400 | $1,850 | $4.62 | 43d | 1 | 0.69mi |
| 2820 Boulder St Los Angeles, CA | 1.0 | 1.0 | 425 | $2,025 | $4.76 | 43d | 1 | 0.71mi |
| 3059 E 5th St Los Angeles, CA | 1.0 | 1.0 | 530 | $1,800 | $3.40 | 43d | 1 | 0.72mi |
| 3331 City Terrace Dr Los Angeles, CA | 1.0 | 1.0 | 700 | $1,800 | $2.57 | 43d | 1 | 0.73mi |
| 2621 E Michigan Ave Los Angeles, CA | 1.0 | 1.0 | 375 | $1,950 | $5.20 | 43d | 1 | 0.75mi |
| 1020 Sentinel Ave Los Angeles, CA | 2.0 | 1.0 | 712 | $2,500 | $3.51 | 24d | 1 | 0.77mi |
| 220 N Saratoga St Los Angeles, CA | 1.0 | 1.0 | 600 | $1,800 | $3.00 | 43d | 1 | 0.78mi |
| 2757 Winter St Los Angeles, CA | 1.0 | 1.0 | 600 | $1,900 | $3.17 | 43d | 1 | 0.82mi |
| 3420 Percy St Unit 3 Los Angeles, CA | 1.0 | 1.0 | 600 | $1,750 | $2.92 | 43d | 1 | 0.89mi |
| 2621 Michigan Ave Los Angeles, CA | 1.0 | 1.0 | 375 | $1,950 | $5.20 | 43d | 1 | 0.90mi |
| 1080 Geraghty Ave Los Angeles, CA | 2.0 | 1.0 | 750 | $2,199 | $2.93 | 43d | 1 | 0.91mi |
| 2853 E 6th St Los Angeles, CA | 2.0 | 1.0 | 552 | $2,000 | $3.62 | 44d | 1 | 0.94mi |
| 215 N Fickett St Unit 5 Los Angeles, CA | 2.0 | 1.0 | 750 | $1,913 | $2.55 | 14d | 1 | 0.96mi |
| 215 N Fickett St Unit 5 Los Angeles, CA | 2.0 | 1.0 | 750 | $1,913 | $2.55 | 5d | 1 | 0.96mi |
| 215 N Fickett St Los Angeles, CA | 2.0 | 1.0 | 750 | $1,913 | $2.55 | 11d | 1 | 0.96mi |
| 215 N Fickett St Unit 5 Los Angeles, CA | 2.0 | 1.0 | 750 | $1,913 | $2.55 | 3d | 1 | 0.96mi |
| 215 N Fickett St Los Angeles, CA | 2.0 | 1.0 | 750 | $2,195 | $2.93 | 16d | 1 | 0.96mi |
| 2617 E 4th St Los Angeles, CA | 1.0 | 1.0 | 527 | $1,950 | $3.70 | 43d | 1 | 1.01mi |
| 2736 Pomeroy Ave Los Angeles, CA | 1.0 | 1.0 | 750 | $1,553 | $2.07 | 43d | 2 | 1.02mi |
| 215 S Fickett St Unit 5 Los Angeles, CA | 2.0 | 1.0 | 750 | $1,913 | $2.55 | 7d | 1 | 1.02mi |
| 215 S Fickett St Unit 5 Los Angeles, CA | 2.0 | 1.0 | 750 | $1,913 | $2.55 | 10d | 1 | 1.02mi |
| 460 S Mott St Los Angeles, CA | 2.0 | 2.0 | 736 | $3,500 | $4.76 | 43d | 1 | 1.03mi |
| 466 S Mott St Los Angeles, CA | 1.0 | 1.0 | 420 | $2,100 | $5.00 | 43d | 1 | 1.04mi |
| 2735 E 6th St Los Angeles, CA | 1.0 | 1.0 | 520 | $2,245 | $4.31 | 3d | 43 | 1.04mi |
| 1215 Geraghty Ave Unit W104TH Los Angeles, CA | 1.0 | 1.0 | 500 | $1,999 | $4.00 | 24d | 1 | 1.04mi |
| 607 Camulos St Los Angeles, CA | 1.0 | 1.0 | 600 | $1,600 | $2.67 | 43d | 1 | 1.04mi |
| 2439 1/2 Boulder St Los Angeles, CA | 2.0 | 1.0 | 500 | $2,000 | $4.00 | 7d | 1 | 1.05mi |
| 116 S Mathews St Los Angeles, CA | 1.0 | 1.0 | 700 | $1,575 | $2.25 | 43d | 1 | 1.05mi |
| 2424 Michigan Ave Unit 1-17 Los Angeles, CA | 1.0 | 1.0 | 526 | $2,172 | $4.13 | 43d | 1 | 1.05mi |
| 2770 Marengo St Los Angeles, CA | 1.0 | 1.0 | 550 | $1,900 | $3.45 | 24d | 1 | 1.08mi |
| 110 S Soto St Unit 6 Los Angeles, CA | — | 1.0 | 450 | $1,400 | $3.11 | 22d | 1 | 1.11mi |
| 610 N Soto St Unit 103 Los Angeles, CA | 1.0 | 1.0 | 492 | $2,100 | $4.27 | 43d | 1 | 1.11mi |
Listing history 11 events
-
2026-06-07days on market $670,000 Active 69 DOM
-
2026-06-04days on market $670,000 Active 66 DOM
-
2026-06-03days on market $670,000 Active 65 DOM
-
2026-06-02days on market $670,000 Active 64 DOM
-
2026-06-01days on market $670,000 Active 63 DOM
-
2026-05-31days on market $670,000 Active 62 DOM
-
2026-03-30$670,000 Active 595-char remark
Show marketing remark (595 chars)
Investment opportunity at 214 N Alma Ave featuring a triplex with three units, each offering 2 bedrooms and 1 bathroom. This property presents strong income potential and is ideal for investors or owner occupants seeking rental income. Each unit offers a functional layout with the opportunity to add value over time. Conveniently located near shopping, dining, schools, and major transportation routes, providing consistent rental demand. Buyer to verify all information and condition of the property. A great opportunity to own a multi unit property with long term upside and income potential.
-
2026-01-30price
-
2026-01-08status Active
-
2026-01-03status Pending
-
2025-12-10Active
ⓘ Source: listings_history table (triggers on properties + properties_extension) + one-shot
backfill from property_details.listing_events for pre-trigger history.
Tax reassessment forecast CA · Resets to sale price
- Current annual tax
- $3,752 · $313/mo
- Projected year-2 tax
- $5,092 · $424/mo
- Expected delta
- +$1,340/yr (+$112/mo · 35.7%)
ⓘ Screening estimate from a state-policy table — verify with the county assessor before closing.
Climate risk First Street
- Flood 1/10 Low FEMA zone X (unshaded) · 0% chance over 30 yrs
- Wildfire 1/10 Low
- Heat 6/10 Major 7 d/yr ≥94°F today · 21 d/yr by 30 yrs out
- Wind 1/10 Low
- Air quality 5/10 Major 9 unhealthy d/yr today · 9 by 30 yrs out
Nearby sold comps map
Loading sold comps map…
Walkable amenities ~0.75 mi
Loading nearby amenities…
Taxation est. · year 1
- Rental income
- $90,960
- − Mortgage interest
- −$37,530
- − Property taxes
- −$3,752
- − Insurance
- −$3,350
- − Repairs & maintenance
- −$7,277
- − Management
- −$7,277
- − Depreciation
- −$19,491
- Taxable income
- $12,283
- Est. tax owed @ 24.0%
- −$2,948
- After-tax cash flow
- $19,646/yr
For passive investors: Depreciation is non-cash, so a rental often shows a tax loss while cash-flowing — sheltering income. Rental losses are passive: they offset passive income freely, and up to $25,000/yr can offset ordinary (W-2) income if you actively participate and your MAGI is under $100k (phasing out to $0 by $150k); unused losses carry forward. On sale, claimed depreciation is recaptured at up to 25%, and gains may owe capital-gains tax (a 1031 exchange can defer both). Figures are a year-1 estimate at your 24.0% rate — not tax advice; consult a CPA.
Schools (NCES district)
- District
- Los Angeles Unified
- NCES district ID
- 0622710
- Math proficiency
- 29% ▼ -4.00%
- Reading proficiency
- 54% ▲ 10.00%
- Median HH income
- $50,403
- Composite
- 35.67/100
- National rank
- #4875
- State rank
- #223 of 517 in CA
Livability — East Los Angeles
- Score
- 60/100
- State rank
- #594
- US rank
- #19237
Category grades
Schools grade is shown separately in the Schools card above.
Census & demographics
- Census place
- East Los Angeles, CA
- County
- Los Angeles County · 9,444,647 people
- City population
- 108,740
- Metro
- Los Angeles-Long Beach-Anaheim, CA
- Population (ZIP)
- 48,397
- Household income
- $72,942
- Rent vs Own
- Severe rent burden
- 1857.0
Population outlook (Los Angeles County) Hauer SSP2
- Today (2025)
- 10,940,515 people
- By 2030
- 11,256,481 · +2.9%
- By 2040
- 11,729,929 · +7.2%
- By 2050
- 11,948,407 · +9.2%
- By 2075
- 11,818,114 · +8.0%
- By 2100
- 10,842,928 · -0.9%
Race, ethnicity, and origin ACS 2023
- Neighborhood character
- Predominantly Hispanic (94%)
- Race & ethnicity
- Hispanic / Latino 94% Two or more races 13% White 3% Native American 2% Asian 2%
- Hispanic origin (detail)
- Mexican 84%
- Foreign-born
- 40% · Canada, China
- Languages at home
- 17% English-only · Spanish 81%
Political lean MEDSL · Los Angeles
- 2024 margin
- Solid D (+32.9) · D 64.8% · R 31.9% · Other 3.3%
- 2008→2024 swing
- -7.4pp toward R · 2008: 40.4pp · 2024: 32.9pp
- All cycles
- 2024: D+32.9 2020: D+44.2 2016: D+48.0 2012: D+40.0 2008: D+40.4
Not yet ingested
- Civics
- —
Market trends
- HPI YoY
- ▼ -841.41%
- Current HPI
- 476.1519
- Rent YoY
- ▼ -3.30%
- Metro
- Los Angeles-Long Beach-Anaheim, CA
- State GDP YoY
- ▲ 3.21%
- F500 in state
- 116
Industry mix (Fortune 500 HQ in CA)
| Industry | F500 HQs | Revenue |
|---|---|---|
| Technology | 27 | $1,492B |
|
||
| Financial Services | 3 | $174B |
|
||
| Retail | 3 | $44B |
|
||
| Insurance | 3 | $26B |
|
||
| Media / Entertainment | 2 | $115B |
|
||
| Pharmaceuticals / Biotech | 2 | $62B |
|
||
Price history
5 events — show timeline
- 2026-03-30 Listed $670,000 TheMLS
- 2026-01-30 Price Changed — TheMLS
- 2026-01-08 Relisted — TheMLS
- 2026-01-03 Pending — TheMLS
- 2025-12-10 Listed — TheMLS
Property tax history
+2.3%/yrLatest (2025): $3,752 · +5.9% YoY. Source: county tax records.
Cash-flow waterfall
monthlySold comps — $/sqft
last 12 mo · ≤1 miLoading sold comps…