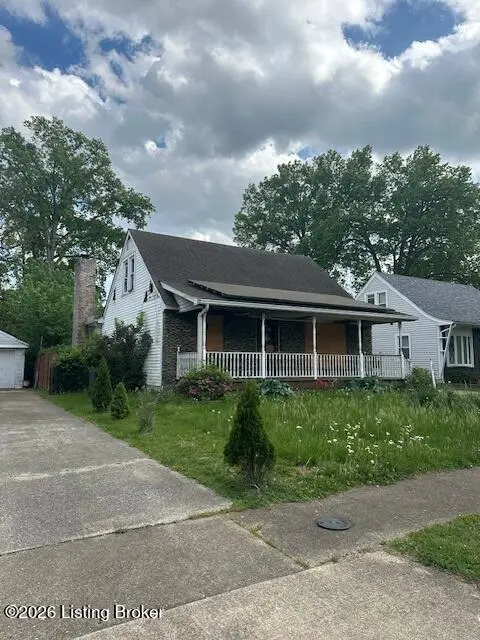
205 Kenoak Dr · Louisville, KY
Flood risk 1/10 · Minimal
- FEMA flood zone
- X (unshaded)
- Chance of flooding over 30 yrs
- 0.0%
- Est. flood insurance / yr
- $507 – $1,088
Fire risk 1/10 · Minimal
- Est. fire insurance / yr
- $839 – $1,559
Heat risk 5/10 · Moderate
- Hot days now (above 105°F)
- 6 days/yr
- Hot days in 30 yrs
- 16 days/yr
Wind risk 2/10 · Minimal
- Chance of severe wind over 30 yrs
- 2.0%
Air-quality risk 2/10 · Minimal
- Unhealthy air days now
- 1 days/yr
- Unhealthy air days in 30 yrs
- 3 days/yr
Risk factors via First Street. Map © Google.
Why this score? — see what drove the D grade
The composite is a weighted blend of 9 inputs, each scored 0–100. Each bar is that input's sub-score; the figure is the points it added to the 100-point composite (weight × sub-score).
- Cash flow +15.0/30.0
- ARV discount +7.5/15.0
- 1% rule +5.0/10.0
- DSCR +5.0/10.0
- Livability +3.2/5.0
- Rent growth +3.0/5.0
- Condition / age +2.5/5.0
- Schools +2.3/10.0
- Appreciation +0.0/10.0
$1
🖨 Deal sheet 📄 Offer letter ✓ Due diligence
Listing remarks MLS
Amazing Deal! Abundant square footage! 3 Bedroom 2 Full Bath Cape Cod! Welcoming Front Porch entry. Good sized & Updated Eat In Kitchen w/ custom cabinetry & recessed lighting. Large Family Room w/ gas fireplace w/ stone surround & vaulted ceiling. Living Room w/ crown molding. 1st Floor Master Bedroom w/ tray ceiling & attached Master Bath. Another Full Bath & the Laundry Room complete the 1st level. 2nd Floor includes 2 good sized Bedrooms. Back of home w/ screened porch & deck area. 1 car detached garage with attached carport. Great opportunity! Call for your showing!
Key facts
- 5,950 sq ft lot
- Garage
- Built 1952
Property features AI
Finance
- Other: Lot is level with sidewalks; Approximately 0.14-acre lot
- HOA & community: No association fee
Exterior
- Parking: Detached garage (1 car); Driveway access
- Utilities: Electricity connected; Natural gas
- Home design: Cape Cod style; Residential property listed as Auction; Two stories; Entry from the front
- Construction: Built in 1952; Vinyl siding; Shingle roof; Crawl space foundation
- Exterior features: See remarks
Interior
- Kitchen: Eat-in kitchen on the first floor
- Bedrooms: Three bedrooms total with primary suite on the first floor and two additional bedrooms on the second floor
- Bathrooms: Two full bathrooms including a primary full bathroom on the first floor
- Heating & cooling: Forced-air heating (natural gas); Central air conditioning
- Interior features: Eight total rooms; Six closets; One fireplace (on first level); No basement
- Laundry & utility: First-floor laundry
Neighborhood map
What this means for you Summary
Snapshot
- This is a 3-bed/2.0-bath single-family listed at $1.
Deal economics
- At list price, monthly cash flow is $1k ($13k/yr) — positive.
- The deal already cash-flows at list — no discount required.
- Meets the 1% rule at list price ($1k rent vs $1).
- Cap rate 1317424.1% vs local median 5.0% in Louisville — top-decile yield for the area; either an underpriced asset or a hidden risk that comps aren't pricing in. Stress-test before assuming the spread holds.
Location & tenants
- Location reads 63/100 on livability (#333 in KY) — a middle-class / working-renter tenant base. Strengths: cost of living A+, housing A+; Watch: employment C-, health & safety D+, schools D-.
- Jefferson County (urban): math 19% / reading 35% proficiency, ranked #121 of 165 in KY (top 73%) — low school quality limits family demand, transient renter base, plan for 1-2y turnover.
- Market conditions: Rents rising (+1.9%/yr); 243 active listings in the ZIP; 8 comparable units currently listed for rent nearby; rentals at typical pace (median 24d on market — plan ~3-4 weeks tenant-placement turnaround); 2,836 units permitted in Jefferson County in 2024 (1,558 in 5+ unit buildings).
- This rent runs 30% of the median local income ($55k/yr) — at the standard rent-burdened threshold; future hikes will face affordability resistance.
Forward outlook
- Local home prices are declining (-3.0%/yr); year-one equity from $0 of loan paydown is wiped out by about $0 of value loss. Plan a longer hold.
- Jefferson County population projected at +13% by 2050 — modest demand growth; plan on rents tracking national, not racing it.
- At projected returns (-3.0% appreciation + 1.9% rent growth), your $0 cash investment doubles in ~1 year — after that, you're playing with house money.
Negotiation context
- Only 5 days on market — expect competitive offers; lowballing is unlikely to land.
- 2 sale attempts since 10y ago with the ask held roughly flat each time — persistent listings suggest the price (not the market) is what's stuck; bring a comps-based counter.
Risks & watch-outs
- Watch-outs: built in 1952 — expect roof / HVAC / electrical / plumbing capex.
- Climate carrying-cost: extreme-heat days projected 6→16/yr by 2055 (HVAC capex compounding) — expect insurance premiums to compound above CPI over the hold.
Questions for the listing agent
- Built in 1952 — when were the roof, HVAC, electrical panel, plumbing, and water heater last replaced?
- Is there a deadline driving the sale (1031 exchange, divorce, estate, relocation)? That informs how much negotiation room exists.
- Schools are D-rated, which usually means shorter tenancies and higher turnover. Who's the typical renter profile here, and what's been the actual vacancy rate?
- Crime grade is F in this area — have there been break-ins, vandalism, or insurance claims at this property in the last 3 years? What carrier currently insures it and at what premium?
- The area grade is low — what's the realistic commute time and amenity access for the typical tenant pool here? Any planned neighborhood developments (good or bad) we should know about?
- What's the average days-on-market for RENTAL listings here right now (not sales)? A rising rental-DOM trend means longer vacancies and softer asking-rent achievability than the comps imply.
- What's the recent tenant-quality profile in this submarket — average credit score on applications, eviction rate, late-payment / NSF rate, and stable-employment percentage? A property-management company in the area should have these aggregated.
- How much new for-sale + rental construction is in the pipeline within 1–3 miles? Heavy new supply typically softens prices + rents 12–24 months out; constrained supply supports both.
Investment metrics
- 1% rule
- 138969.00% ✓
- Cap rate
- 1317424.12%
- Cash-on-cash
- 4705063.67%
- DSCR
- 209349.86
- GRM
- 0.0
CMA / ARV
- ARV (on-the-fly)
- $226,086
- Comps found
- 12
Show comp detail 12 sales within ~0.75 mi
| Address | Dist | Beds/Ba | Sqft | Sold | Price | $/sf | Match |
|---|---|---|---|---|---|---|---|
| 226 Kenoak Dr | 0.14mi | 4/1.0 (+1) | 1,435 (-7%) | 1mo | $223,350 | $156 | 72 |
| 5329 Alpine Way | 0.35mi | 3/1.5 | 1,560 (+1%) | 11mo | $230,000 | $147 | 70 |
| 345 Alger Ave | 0.25mi | 2/2.0 (-1) | 1,450 (-6%) | 13mo | $200,000 | $138 | 63 |
| 330 Kenwood Hill Rd | 0.41mi | 3/2.0 | 1,653 (+8%) | 11mo | $260,000 | $157 | 59 |
| 727 Iroquois Ave | 0.50mi | 3/1.5 | 1,473 (-4%) | 12mo | $245,000 | $166 | 58 |
| 5323 Lone Oak Trl | 0.45mi | 3/1.5 | 1,465 (-5%) | 15mo | $154,000 | $105 | 56 |
| 817 Iroquois Ave | 0.51mi | 4/2.0 (+1) | 1,600 (+4%) | 11mo | $264,000 | $165 | 56 |
| 701 Orchard Hill Dr | 0.44mi | 3/1.5 | 1,391 (-10%) | 7mo | $220,000 | $158 | 56 |
| 242 Steedly Dr | 0.55mi | 4/2.0 (+1) | 1,412 (-8%) | 2mo | $185,001 | $131 | 54 |
| 107 Cambridge Dr | 0.33mi | 2/1.0 (-1) | 1,440 (-6%) | 14mo | $160,000 | $111 | 53 |
| 508 Hill Ridge Rd | 0.65mi | 3/2.5 | 1,604 (+4%) | 15mo | $225,000 | $140 | 48 |
| 517 Auburndale Ave | 0.66mi | 4/1.0 (+1) | 1,463 (-5%) | 18mo | $199,000 | $136 | 37 |
Match score weights: distance 35% · size 25% · config 20% · recency 20%. Top-matched comps best support the ARV.
Projected returns pro-forma
-3.0% appreciation · 1.89% rent growth · sell at horizon
- IRR
- —
- Equity multiple
- 244315.80×
- Total profit
- $68,408
- Equity at exit
- $0
- IRR
- —
- Equity multiple
- 512608.34×
- Total profit
- $143,530
- Equity at exit
- $0
Cash invested: $0 (down + closing). Projections, not guarantees.
Landlord ↔ Tenant lean methodology
- Overall (STATE)
- 83 Strongly Landlord-Friendly
- State Kentucky
- 83 Strongly Landlord-Friendly · R+16
- County
- — inherits STATE
- City
- — inherits STATE
ZIP-level market 40214
- Rents YoY
- 1.9%
- Active inventory
- 243
Monthly cashflow live
- Estimated rent
- $1,390 high interval (Pro) →
- Mortgage (P&I)
- −$0
- Tax est. 1.5%
- −$0 /mo · $0/yr
- Insurance
- −$0
- HOA
- −$0
- Vacancy / Maint / Mgmt
- −$292
- Net cashflow
- $1,098
Break-even live
UW: 25.0% down · 7.5% · 30yr · 1.5% tax · 5.0% vac · 8.0% maint · 8.0% mgmt
Financing live
Cash to close
- Down payment
- $0
- Closing costs
- $0
- Reserves months
- —
- Total cash needed
- —
Loan-product check · same deal, 3 products live
Conventional
25% down · 7.5% · 30yr
- Down + closing
- —
- Monthly P&I
- —
- Monthly cashflow
- —
- DSCR
- —
- Eligible?
- —
Personal DTI + credit; lowest rate.
DSCR
20% down · 8.5% · 30yr
- Down + closing
- —
- Monthly P&I
- —
- Monthly cashflow
- —
- DSCR
- —
- Eligible?
- —
No personal income docs; deal must DSCR.
Hard money
10% down · 12.0% · 12mo
- Down + closing
- —
- Monthly P&I
- —
- Monthly cashflow
- —
- DSCR
- —
- Eligible?
- —
Short-term bridge; refi at stabilization.
Rent comps 8 comps
| Address | Beds | Baths | Sqft | Rent | $/sqft | DOM | Units | Dist |
|---|---|---|---|---|---|---|---|---|
| 519 Forum Ave Louisville, KY | 3.0 | 1.5 | 1693 | $1,600 | $0.95 | 23d | 1 | 0.74mi |
| 5033 Wabash Pl Louisville, KY | 3.0 | 1.5 | 1156 | $1,350 | $1.17 | 23d | 1 | 1.08mi |
| 5013 Wabash Pl Louisville, KY | 3.0 | 2.0 | 1080 | $1,400 | $1.30 | 23d | 1 | 1.10mi |
| 1507 Arling Ave Louisville, KY | 3.0 | 2.0 | 1148 | $1,275 | $1.11 | 16d | 1 | 1.16mi |
| 4725 Southern Pkwy Unit 1 Louisville, KY | 2.0 | 1.0 | 1296 | $925 | $0.71 | 3d | 1 | 1.19mi |
| 1517 Shingo Ave Louisville, KY | 3.0 | 2.0 | 1100 | $1,349 | $1.23 | 23d | 1 | 1.20mi |
| 7500 Cranfill Way Louisville, KY | 2.0 | 1.5–2.0 | 1008 | $1,198 | $1.19 | 2d | 22 | 1.39mi |
| 4608 S 3rd St Unit 1st Floor Louisville, KY | 2.0 | 1.5 | 1100 | $1,500 | $1.36 | 23d | 1 | 1.42mi |
Listing history 6 events
-
2026-05-09status Pending
-
2026-05-04$1 Active
-
2017-01-06soldstatus $95,000
-
2016-12-27soldstatus $95,000 Closed 603-char remark
Show marketing remark (603 chars)
Amazing Deal! Abundant square footage! 3 Bedroom 2 Full Bath Cape Cod! Welcoming Front Porch entry. Good sized & Updated Eat In Kitchen w/ custom cabinetry & recessed lighting. Large Family Room w/ gas fireplace w/ stone surround & vaulted ceiling. Living Room w/ crown molding. 1st Floor Master Bedroom w/ tray ceiling & attached Master Bath. Another Full Bath & the Laundry Room complete the 1st level. 2nd Floor includes 2 good sized Bedrooms. Back of home w/ screened porch & deck area. 1 car detached garage with attached carport. Great opportunity! Call for your showing!
-
2016-10-31historical Active Under Contract 603-char remark
Show marketing remark (603 chars)
Amazing Deal! Abundant square footage! 3 Bedroom 2 Full Bath Cape Cod! Welcoming Front Porch entry. Good sized & Updated Eat In Kitchen w/ custom cabinetry & recessed lighting. Large Family Room w/ gas fireplace w/ stone surround & vaulted ceiling. Living Room w/ crown molding. 1st Floor Master Bedroom w/ tray ceiling & attached Master Bath. Another Full Bath & the Laundry Room complete the 1st level. 2nd Floor includes 2 good sized Bedrooms. Back of home w/ screened porch & deck area. 1 car detached garage with attached carport. Great opportunity! Call for your showing!
-
2016-10-26$95,000 Active 603-char remark
Show marketing remark (603 chars)
Amazing Deal! Abundant square footage! 3 Bedroom 2 Full Bath Cape Cod! Welcoming Front Porch entry. Good sized & Updated Eat In Kitchen w/ custom cabinetry & recessed lighting. Large Family Room w/ gas fireplace w/ stone surround & vaulted ceiling. Living Room w/ crown molding. 1st Floor Master Bedroom w/ tray ceiling & attached Master Bath. Another Full Bath & the Laundry Room complete the 1st level. 2nd Floor includes 2 good sized Bedrooms. Back of home w/ screened porch & deck area. 1 car detached garage with attached carport. Great opportunity! Call for your showing!
ⓘ Source: listings_history table (triggers on properties + properties_extension) + one-shot
backfill from property_details.listing_events for pre-trigger history.
Climate risk First Street
- Flood 1/10 Low FEMA zone X (unshaded) · 0% chance over 30 yrs
- Wildfire 1/10 Low
- Heat 5/10 Major 6 d/yr ≥105°F today · 16 d/yr by 30 yrs out
- Wind 2/10 Low 2% chance of damaging wind over 30 yrs
- Air quality 2/10 Low 1 unhealthy d/yr today · 3 by 30 yrs out
Nearby sold comps map
Loading sold comps map…
Walkable amenities ~0.75 mi
Loading nearby amenities…
Taxation est. · year 1
- Rental income
- $16,676
- − Mortgage interest
- −$0
- − Property taxes
- −$0
- − Insurance
- −$0
- − Repairs & maintenance
- −$1,334
- − Management
- −$1,334
- − Depreciation
- −$0
- Taxable income
- $14,008
- Est. tax owed @ 24.0%
- −$3,362
- After-tax cash flow
- $9,812/yr
For passive investors: Depreciation is non-cash, so a rental often shows a tax loss while cash-flowing — sheltering income. Rental losses are passive: they offset passive income freely, and up to $25,000/yr can offset ordinary (W-2) income if you actively participate and your MAGI is under $100k (phasing out to $0 by $150k); unused losses carry forward. On sale, claimed depreciation is recaptured at up to 25%, and gains may owe capital-gains tax (a 1031 exchange can defer both). Figures are a year-1 estimate at your 24.0% rate — not tax advice; consult a CPA.
Schools (NCES district)
- District
- Jefferson County
- NCES district ID
- 2102990
- Math proficiency
- 19% ▼ -17.00%
- Reading proficiency
- 35% ▼ -11.00%
- Median HH income
- $47,885
- Composite
- 23.45/100
- National rank
- #7884
- State rank
- #121 of 165 in KY
Livability — Louisville
- Score
- 63/100
- State rank
- #333
- US rank
- #15887
Category grades
Schools grade is shown separately in the Schools card above.
Census & demographics
- Census place
- Louisville, KY
- County
- Jefferson County · 790,184 people
- City population
- 769,292
- Metro
- Louisville/Jefferson County, KY-IN
- Population (ZIP)
- 45,405
- Household income
- $54,931
- Rent vs Own
- Severe rent burden
- 2054.0
Population outlook (Jefferson County) Hauer SSP2
- Today (2025)
- 823,112 people
- By 2030
- 849,343 · +3.2%
- By 2040
- 895,696 · +8.8%
- By 2050
- 933,630 · +13.4%
- By 2075
- 1,028,262 · +24.9%
- By 2100
- 1,072,675 · +30.3%
Race, ethnicity, and origin ACS 2023
- Neighborhood character
- Diverse neighborhood (Simpson 0.67)
- Race & ethnicity
- White 51% Black 22% Hispanic / Latino 14% Two or more races 12% Asian 7%
- Hispanic origin (detail)
- Mexican 3% Cuban 6%
- Common ancestry
- Slovak 1% Lithuanian 1% Serbian 1%
- Foreign-born
- 21% · Canada, Vietnam, Philippines
- Languages at home
- 74% English-only · Spanish 12% Vietnamese 3% Other Asian/Pacific 2%
Political lean MEDSL · Jefferson
- 2024 margin
- D (+16.6) · D 57.4% · R 40.9% · Other 1.7%
- 2008→2024 swing
- +4.5pp toward D · 2008: 12.0pp · 2024: 16.6pp
- All cycles
- 2024: D+16.6 2020: D+20.1 2016: D+13.3 2012: D+11.1 2008: D+12.0
Not yet ingested
- Civics
- —
Market trends
- HPI YoY
- ▼ -235.43%
- Current HPI
- 237.4062
- Rent YoY
- ▲ 1.89%
- Metro
- Louisville/Jefferson County, KY-IN
- State GDP YoY
- ▲ 1.81%
- F500 in state
- 4
Industry mix (Fortune 500 HQ in KY)
| Industry | F500 HQs | Revenue |
|---|---|---|
| Healthcare | 1 | $118B |
|
||
| Food / Beverage | 1 | $7B |
|
||
Price history
+0.0% since first listed6 events — show timeline
- 2026-05-09 Pending — Metro Search MLS
- 2026-05-04 Listed $1 Metro Search MLS
- 2017-01-06 Sold (Public Records) $95,000 Public Records
- 2016-12-27 Sold (MLS) $95,000 Metro Search MLS
- 2016-10-31 Contingent — Metro Search MLS
- 2016-10-26 Listed $95,000 Metro Search MLS
Property tax history
+12.6%/yrLatest (2025): $2,068 · +26.8% YoY. Source: county tax records.
Cash-flow waterfall
monthlySold comps — $/sqft
last 12 mo · ≤1 miLoading sold comps…