 Duplex
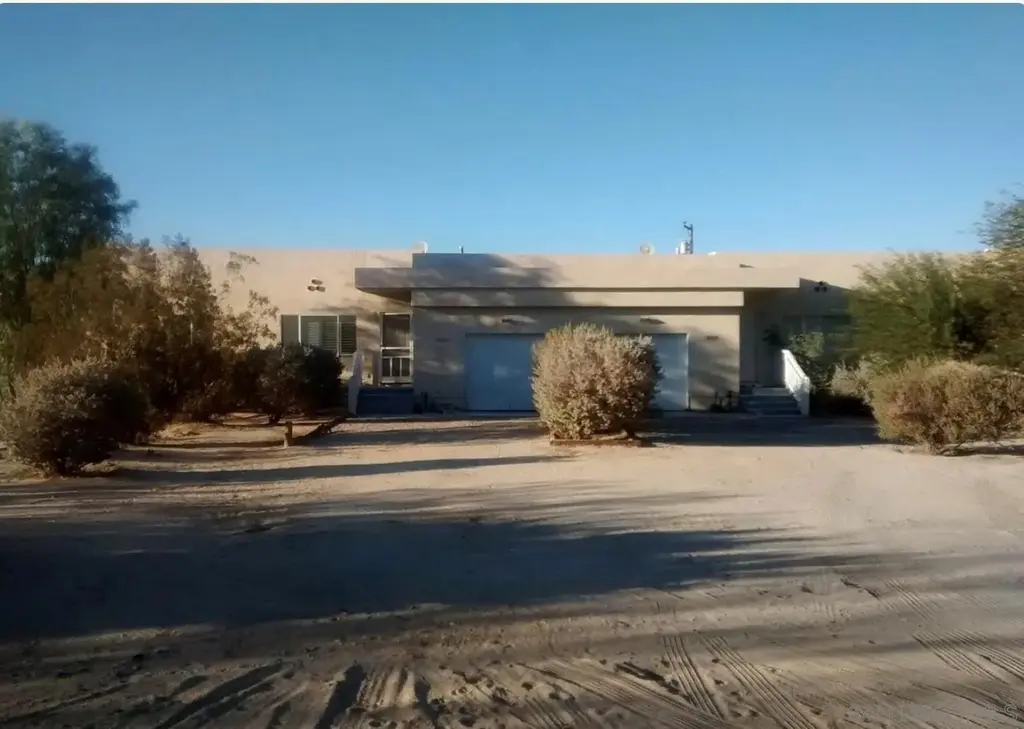
2610-2612 Double O Rd · Borrego Springs, CA
Flood risk 1/10 · Minimal
- FEMA flood zone
- AO
- Chance of flooding over 30 yrs
- 0.0%
- Est. flood insurance / yr
- $848 – $2,087
Fire risk 3/10 · Minor
- Est. fire insurance / yr
- $659 – $1,223
Heat risk 9/10 · Severe
- Hot days now (above 112°F)
- 8 days/yr
- Hot days in 30 yrs
- 26 days/yr
Wind risk 1/10 · Minimal
- Chance of severe wind over 30 yrs
- —
Air-quality risk 3/10 · Minor
- Unhealthy air days now
- 3 days/yr
- Unhealthy air days in 30 yrs
- 4 days/yr
Risk factors via First Street. Map © Google.
Why this score? — see what drove the B- grade
The composite is a weighted blend of 9 inputs, each scored 0–100. Each bar is that input's sub-score; the figure is the points it added to the 100-point composite (weight × sub-score).
- Cash flow +30.0/30.0
- 1% rule +10.0/10.0
- DSCR +10.0/10.0
- ARV discount +8.2/15.0
- Livability +2.9/5.0
- Schools +2.6/10.0
- Rent growth +2.5/5.0
- Condition / age +2.5/5.0
- Appreciation +0.0/10.0
$350,000
🖨 Deal sheet 📄 Offer letter ✓ Due diligence
Multi-family units
County records classify this as Multi-Family (2-4 Unit). Listing-text estimate: 2 units. confirmed
Listing remarks MLS
Great income property in Borrego Springs. Quiet street on a Cul de Sac.
Key facts
- Quiet street
- Cul de sac
- 0.6 acre lot
Tags
Neighborhood map
What this means for you Summary
Snapshot
- This is a 2 × 4-bed/2.0-bath units multifamily listed at $350k.
Deal economics
- At list price, monthly cash flow is $3k ($33k/yr) — positive. Per door: $1k/mo.
- The deal already cash-flows at list — no discount required.
- Meets the 1% rule at list price ($6k rent vs $350k).
- Recommended offer: $318k (9.0% below list) — sets the bar for market timing.
- Cap rate 16.1% vs local median 6.0% in Borrego Springs — top-decile yield for the area; either an underpriced asset or a hidden risk that comps aren't pricing in. Stress-test before assuming the spread holds.
Location & tenants
- Location reads 58/100 on livability (#712 in CA) — a working-class tenant base; expect higher turnover. Strengths: crime A+, employment A+, housing A+; Watch: schools F, amenities F, commute F.
- Borrego Springs Unified (rural): math 20% / reading 35% proficiency, ranked #1,120 of 1,400 in CA (top 80%) — low school quality limits family demand, transient renter base, plan for 1-2y turnover; 72% free/reduced lunch — lower-income household profile, screen leases tightly.
- Market conditions: 174 active listings in the ZIP; 11,759 units permitted in San Diego County in 2024 (7,244 in 5+ unit buildings).
Forward outlook
- Local home prices are declining (-3.0%/yr); year-one equity from $2k of loan paydown is wiped out by about $10k of value loss. Plan a longer hold.
- San Diego County population projected at +20% by 2050 — long-run rental-demand tailwind backs the buy-and-hold thesis.
- At projected returns (-3.0% appreciation + 3.0% rent growth), your $98k cash investment doubles in ~4 years — after that, you're playing with house money.
Negotiation context
- It's been on market 119 days — a 9% lower offer ($318k) is reasonable based on typical stale-listing flexibility.
- 7 sale attempts since 24y ago with the ask held roughly flat each time — persistent listings suggest the price (not the market) is what's stuck; bring a comps-based counter.
- Current owner paid $156k; list at $350k implies a 125% gain — meaningful room to come down on a strong offer.
Risks & watch-outs
- Watch-outs: flood insurance adds $122/mo.
- Climate carrying-cost: in FEMA flood zone AO (mandatory federal flood insurance); extreme-heat days projected 8→26/yr by 2055 (HVAC capex compounding) — expect insurance premiums to compound above CPI over the hold.
Questions for the listing agent
- It's been on market 119 days. Have you received any prior offers? Is the seller open to a 9% concession, seller financing, or rate buy-down credit?
- Can we see the unit-by-unit rent roll, current vacancy, and any below-market leases? What's the average tenancy length?
- What capital expenditures (roof, boiler, parking lot, exteriors) have been made in the last 5 years, and what's planned in the next 2?
- What's the actual annual flood-insurance premium (NFIP or private), and is the property in a SFHA with mandatory coverage?
- Why hasn't it sold? Are there any deal-killer items the seller is aware of (foundation, flood, title, zoning, code violations)?
- Is there a deadline driving the sale (1031 exchange, divorce, estate, relocation)? That informs how much negotiation room exists.
- Schools are F-rated, which usually means shorter tenancies and higher turnover. Who's the typical renter profile here, and what's been the actual vacancy rate?
- What's the average days-on-market for RENTAL listings here right now (not sales)? A rising rental-DOM trend means longer vacancies and softer asking-rent achievability than the comps imply.
- What's the recent tenant-quality profile in this submarket — average credit score on applications, eviction rate, late-payment / NSF rate, and stable-employment percentage? A property-management company in the area should have these aggregated.
- How much new apartment / multifamily construction is in the pipeline within 1–3 miles? Heavy new supply (>2% of stock underway) typically softens rents 12–24 months out; light construction supports rent growth.
Investment metrics
- 1% rule
- 1.81% ✓
- Cap rate
- 16.09%
- Cash-on-cash
- 35.00%
- DSCR
- 2.56
- GRM
- 4.6
CMA / ARV
- ARV (median comp)
- $355,532
- List price
- $350,000
- Delta
- -1.56%
- Verdict
- FAIR
- Comps
- 4 within 1.0 mi
Projected returns pro-forma
-3.0% appreciation · 3.0% rent growth · sell at horizon
- IRR
- 28.8%
- Equity multiple
- 2.20×
- Total profit
- $117,581
- Equity at exit
- $52,186
- IRR
- 36.2%
- Equity multiple
- 4.34×
- Total profit
- $326,854
- Equity at exit
- $30,262
Cash invested: $98,000 (down + closing). Projections, not guarantees.
Landlord ↔ Tenant lean methodology
- Overall (STATE)
- 18 Strongly Tenant-Friendly
- State California
- 18 Strongly Tenant-Friendly · D+13
- County
- — inherits STATE
- City
- — inherits STATE
ZIP-level market 92004
- Home prices YoY
- -18.4%
- Active inventory
- 174
- Price-to-rent
- 9.2×
Monthly cashflow live
- Estimated rent
- $6,352 medium interval (Pro) →
- Mortgage (P&I)
- −$1,835
- Tax from tax record
- −$178 /mo · $2,137/yr
- Insurance
- −$146
- Flood insurance flood zone
- −$122 /mo · $1,468/yr
- HOA
- −$0
- Vacancy / Maint / Mgmt
- −$1,334
- Net cashflow
- $2,736
Break-even live
2-unit breakdown (identical units grouped — click to expand)
| Units | Beds | Baths | Est. rent |
|---|---|---|---|
| 2× units | 4 | 2 | $6,352 |
| #1 | 4 | 2 | $3,176 |
| #2 | 4 | 2 | $3,176 |
| Total (2 units) | $6,352 | ||
UW: 25.0% down · 7.5% · 30yr · 1.5% tax · 5.0% vac · 8.0% maint · 8.0% mgmt
Financing live
Cash to close
- Down payment
- $87,500
- Closing costs
- $10,500
- Reserves months
- —
- Total cash needed
- —
Loan-product check · same deal, 3 products live
Conventional
25% down · 7.5% · 30yr
- Down + closing
- —
- Monthly P&I
- —
- Monthly cashflow
- —
- DSCR
- —
- Eligible?
- —
Personal DTI + credit; lowest rate.
DSCR
20% down · 8.5% · 30yr
- Down + closing
- —
- Monthly P&I
- —
- Monthly cashflow
- —
- DSCR
- —
- Eligible?
- —
No personal income docs; deal must DSCR.
Hard money
10% down · 12.0% · 12mo
- Down + closing
- —
- Monthly P&I
- —
- Monthly cashflow
- —
- DSCR
- —
- Eligible?
- —
Short-term bridge; refi at stabilization.
Listing history 32 events
-
2026-06-19days on market $350,000 Active 119 DOM
-
2026-06-18days on market $350,000 Active 118 DOM
-
2026-06-17days on market $350,000 Active 117 DOM
-
2026-06-16days on market $350,000 Active 116 DOM
-
2026-06-15days on market $350,000 Active 115 DOM
-
2026-06-14days on market $350,000 Active 113 DOM
-
2026-06-12days on market $350,000 Active 112 DOM
-
2026-06-09days on market $350,000 Active 109 DOM
-
2026-06-08days on market $350,000 Active 108 DOM
-
2026-06-07days on market $350,000 Active 107 DOM
-
2026-06-07days on market $350,000 Active 106 DOM
-
2026-06-04days on market $350,000 Active 103 DOM
-
2026-06-02days on market $350,000 Active 102 DOM
-
2026-06-01days on market $350,000 Active 101 DOM
-
2026-05-31days on market $350,000 Active 100 DOM
-
2026-05-31days on market $350,000 Active 99 DOM
-
2026-02-20$350,000 Active 71-char remark
Show marketing remark (71 chars)
Great income property in Borrego Springs. Quiet street on a Cul de Sac.
-
2026-02-08historical
-
2025-10-21price $375,000
-
2025-08-10$395,000 Active
-
2015-04-16soldstatus $155,500
-
2009-05-19historical
-
2009-05-19historical
-
2008-11-18$269,900
-
2008-11-18$269,900
-
2008-07-23historical
-
2008-07-23historical
-
2008-04-23$269,000
-
2008-04-23$269,000
-
2003-11-06soldstatus $185,000
-
2003-10-03soldstatus $185,000
-
2002-08-22$210,000
ⓘ Source: listings_history table (triggers on properties + properties_extension) + one-shot
backfill from property_details.listing_events for pre-trigger history.
Tax reassessment forecast CA · Resets to sale price
- Current annual tax
- $2,137 · $178/mo
- Projected year-2 tax
- $2,660 · $222/mo
- Expected delta
- +$523/yr (+$44/mo · 24.5%)
ⓘ Screening estimate from a state-policy table — verify with the county assessor before closing.
Climate risk First Street
- Flood 1/10 Low FEMA zone AO · 0% chance over 30 yrs
- Wildfire 3/10 Moderate
- Heat 9/10 Extreme 8 d/yr ≥112°F today · 26 d/yr by 30 yrs out
- Wind 1/10 Low
- Air quality 3/10 Moderate 3 unhealthy d/yr today · 4 by 30 yrs out
Nearby sold comps map
Loading sold comps map…
Walkable amenities ~0.75 mi
Loading nearby amenities…
Taxation est. · year 1
- Rental income
- $76,224
- − Mortgage interest
- −$19,605
- − Property taxes
- −$2,137
- − Insurance
- −$3,218
- − Repairs & maintenance
- −$6,098
- − Management
- −$6,098
- − Depreciation
- −$10,182
- Taxable income
- $28,886
- Est. tax owed @ 24.0%
- −$6,933
- After-tax cash flow
- $25,904/yr
For passive investors: Depreciation is non-cash, so a rental often shows a tax loss while cash-flowing — sheltering income. Rental losses are passive: they offset passive income freely, and up to $25,000/yr can offset ordinary (W-2) income if you actively participate and your MAGI is under $100k (phasing out to $0 by $150k); unused losses carry forward. On sale, claimed depreciation is recaptured at up to 25%, and gains may owe capital-gains tax (a 1031 exchange can defer both). Figures are a year-1 estimate at your 24.0% rate — not tax advice; consult a CPA.
Schools (NCES district)
- District
- Borrego Springs Unified
- NCES district ID
- 0605700
- Math proficiency
- 20% ▼ -6.00%
- Reading proficiency
- 35% ▼ -6.00%
- Median HH income
- $42,330
- Composite
- 26.31/100
- National rank
- #12684
- State rank
- #1120 of 1400 in CA
Livability — Borrego Springs
- Score
- 58/100
- State rank
- #712
- US rank
- #21334
Category grades
Schools grade is shown separately in the Schools card above.
Census & demographics
- Census place
- Borrego Springs, CA
- Population (ZIP)
- 3,030
Population outlook (San Diego County) Hauer SSP2
- Today (2025)
- 3,678,185 people
- By 2030
- 3,856,546 · +4.8%
- By 2040
- 4,171,407 · +13.4%
- By 2050
- 4,421,607 · +20.2%
- By 2075
- 4,831,599 · +31.4%
- By 2100
- 4,832,502 · +31.4%
Race, ethnicity, and origin ACS 2023
- Neighborhood character
- Predominantly White (66%)
- Race & ethnicity
- White 66% Hispanic / Latino 33% Two or more races 24%
- Hispanic origin (detail)
- Mexican 29%
- Common ancestry
- Lithuanian 10% Slovak 5% Scotch-Irish 1%
- Foreign-born
- 27% · Canada
- Languages at home
- 70% English-only · Spanish 30%
Political lean MEDSL · San Diego
- 2024 margin
- D (+16.8) · D 56.9% · R 40.1% · Other 2.9%
- 2008→2024 swing
- +6.6pp toward D · 2008: 10.2pp · 2024: 16.8pp
- All cycles
- 2024: D+16.8 2020: D+22.8 2016: D+17.8 2012: D+5.1 2008: D+10.2
Not yet ingested
- Civics
- —
Market trends
- HPI YoY
- ▼ -50.39%
- Current HPI
- 222.8196
- Rent YoY
- —
- Metro
- —
- State GDP YoY
- ▲ 3.21%
- F500 in state
- 116
Industry mix (Fortune 500 HQ in CA)
| Industry | F500 HQs | Revenue |
|---|---|---|
| Technology | 27 | $1,492B |
|
||
| Financial Services | 3 | $174B |
|
||
| Retail | 3 | $44B |
|
||
| Insurance | 3 | $26B |
|
||
| Media / Entertainment | 2 | $115B |
|
||
| Pharmaceuticals / Biotech | 2 | $62B |
|
||
Price history
+66.7% since first listed16 events — show timeline
- 2026-02-20 Listed $350,000 SDMLS
- 2026-02-08 Listing Removed — SDMLS
- 2025-10-21 Price Changed $375,000 SDMLS
- 2025-08-10 Listed $395,000 SDMLS
- 2015-04-16 Sold (Public Records) $155,500 Public Records
- 2009-05-19 Listing Removed — CRMLS
- 2009-05-19 Listing Removed — SDMLS
- 2008-11-18 Listed $269,900 CRMLS
- 2008-11-18 Listed $269,900 SDMLS
- 2008-07-23 Listing Removed — CRMLS
- 2008-07-23 Listing Removed — SDMLS
- 2008-04-23 Listed $269,000 CRMLS
- 2008-04-23 Listed $269,000 SDMLS
- 2003-11-06 Sold (MLS) $185,000 CRMLS
- 2003-10-03 Sold (Public Records) $185,000 Public Records
- 2002-08-22 Listed $210,000 CRMLS
Property tax history
-0.1%/yrLatest (2025): $2,137 · +2.1% YoY. Source: county tax records.
Cash-flow waterfall
monthlySold comps — $/sqft
last 12 mo · ≤1 miLoading sold comps…